We’ve recently seen national “basic skills” and Team Economist is now back with another one: National “learning-adjusted years of schooling”. We might say that national intelligence enjoys a paradoxical popularity. While one cannot talk about the matter directly without associated whining on Twitter, one can talk about all sorts of almost-the-same-thing. In keeping with tradition, these definitely-not-national-IQs papers never cite the originators of the field, or even Rindermann or Becker for that matter. Here’s the new paper:
- Altinok, N., & Diebolt, C. (2023). Cliometrics of Learning-Adjusted Years of Schooling: Evidence from a New Dataset (No. 02-23).
Analyzing education does not only involve years of schooling, quality matters! This paper aims at providing better data on schooling with a focus on learning outcomes. It provides the largest dataset on learning outcomes, years of schooling and learning-adjusted year of schooling (LAYS) with comparable data between 1970 and 2020. The quantity dimension is measured by years of schooling and uses the latest data from Barro and Lee (J Dev Econ 104:184–198, 2013), while the quality dimension is taken from linking standardized, psychometrically robust international achievement tests and hybrid tests. The data are available for more than 120 countries between 1970 and 2020. Several findings can be highlighted. A global convergence on both learning outcomes and enrollment has occurred since 1970, but a breakdown can be found after 1990. A very low number of countries perform better after 2000 regarding the quality of schooling, while most countries have a stable level of learning outcomes.
I think the back story of papers like these is roughly as follows. Once economists figured out that human capital is very important, they tried measuring this. Of course, they first turned to the easiest thing they could find in large datasets, educational attainment. Since this is somewhat difficult to compare across various times and places due to changes in categorization, a smarter approach (maybe) is to use years of education. Later they noted that this is still not quite right because people learn at different speeds, so they don’t get the same out of education. These differences in learning speed are then attributed mostly to educational policy and school factors. Standard stuff. In this paper, they diligently compiled various test scores across countries (“quality dimension is taken from linking standardized, psychometrically robust international achievement tests and hybrid tests”) as well as years of education. Using these, one can compute a kind of efficacy of the schooling. Thus one gets “learning adjusted years of education”. The causal model assumed is still the same deficient one, namely that differences in test scores can be taken as a measure of educational quality, instead of student body quality. But this doesn’t really matter for the practical use of their dataset. One nice thing is that they compiled a longitudinal dataset so that one may use fixed effects models:
First, we propose the first real panel dataset with 5-year intervals between 1970 and 2020 for more than 120 countries and for both dimensions of schooling (i.e., quality and quantity). To our knowledge, this is the largest existing dataset covering both dimensions of schooling. Second, our dataset aggregates all existing learning achievement tests in order to obtain comparable scores across countries, while most previous papers propose separate scores for each dimension. These scores are computed with a parsimonious methodology which combines multiple improvements derived from previous papers. For instance, we first focus on the actual results of student achievement tests, and only then do we use imputation methods for predicting results in a multiple dimension analysis (i.e., skill, year, grade, level of schooling). In a second step, additional data on schooling and literacy are used for the multiple imputation process. This makes our data close to the original results of achievement tests, but it also provides real panel data over time. Therefore, the data are more extensive than those in previous datasets and go back as far as 1970 for a large number of countries.
They supply the usual world maps:
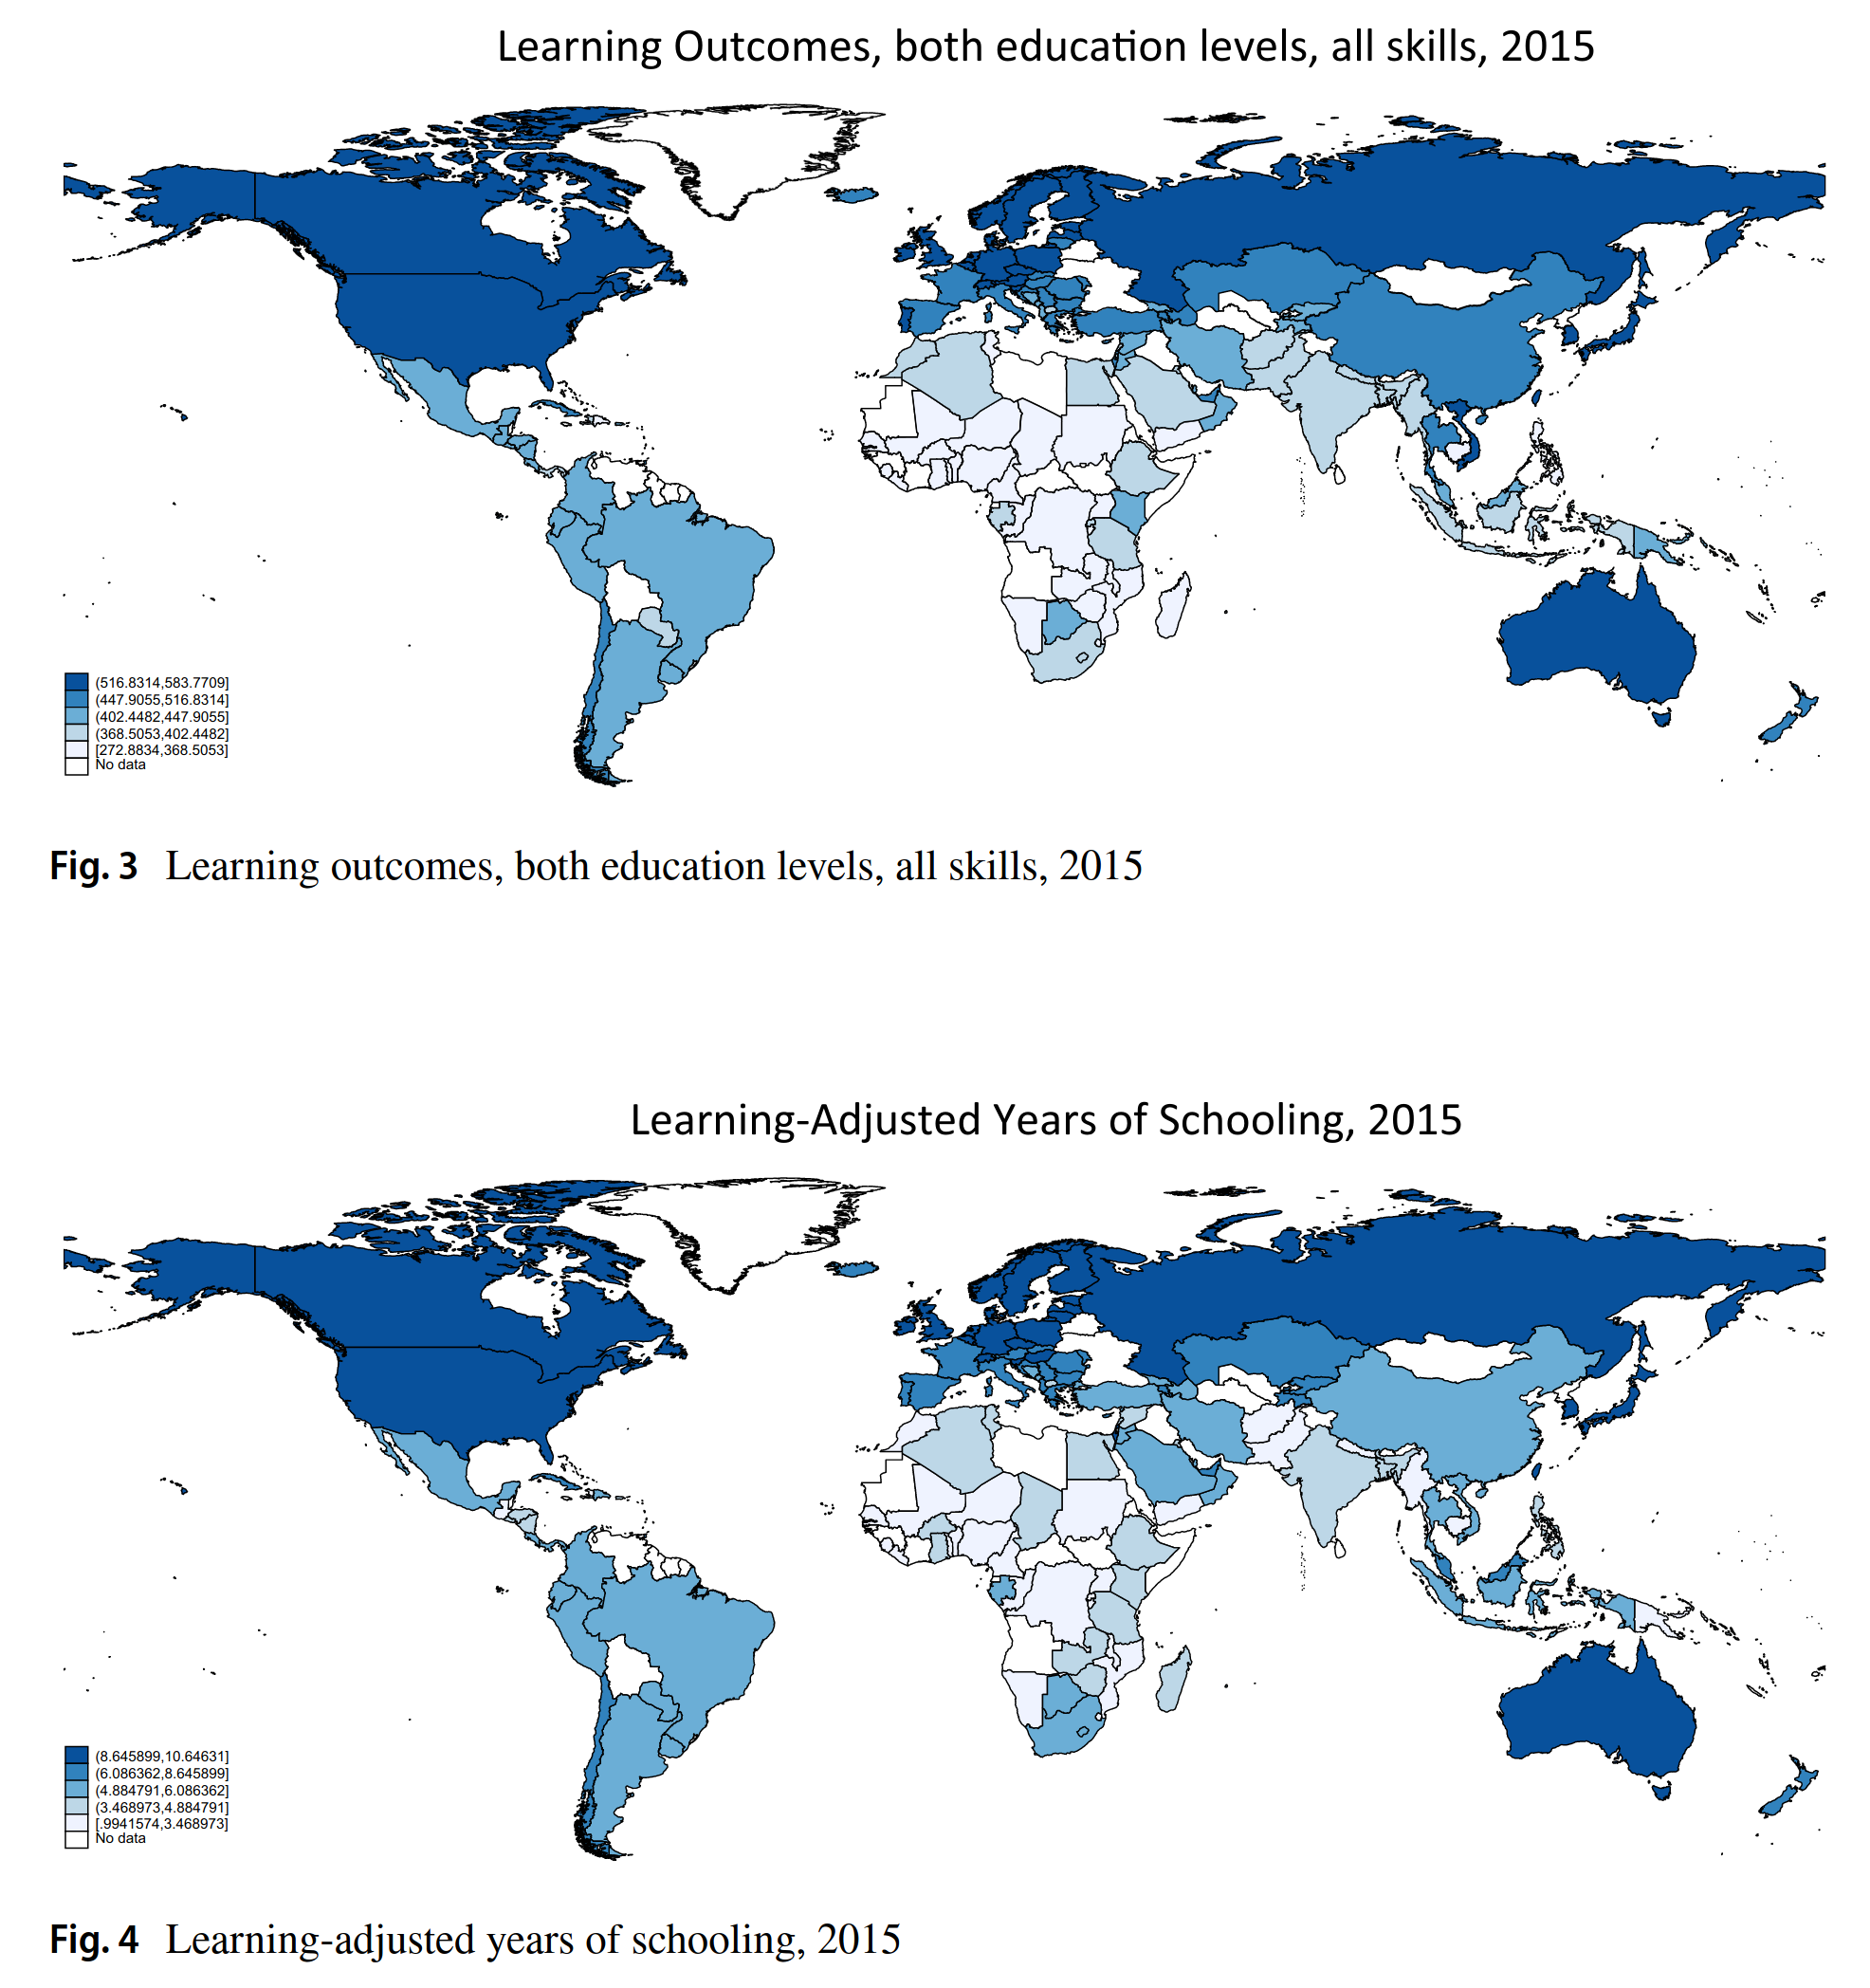
The maps of course look like every other such world map ever made.
The new dataset looks like this (dataset is in the excel file at the journal website):
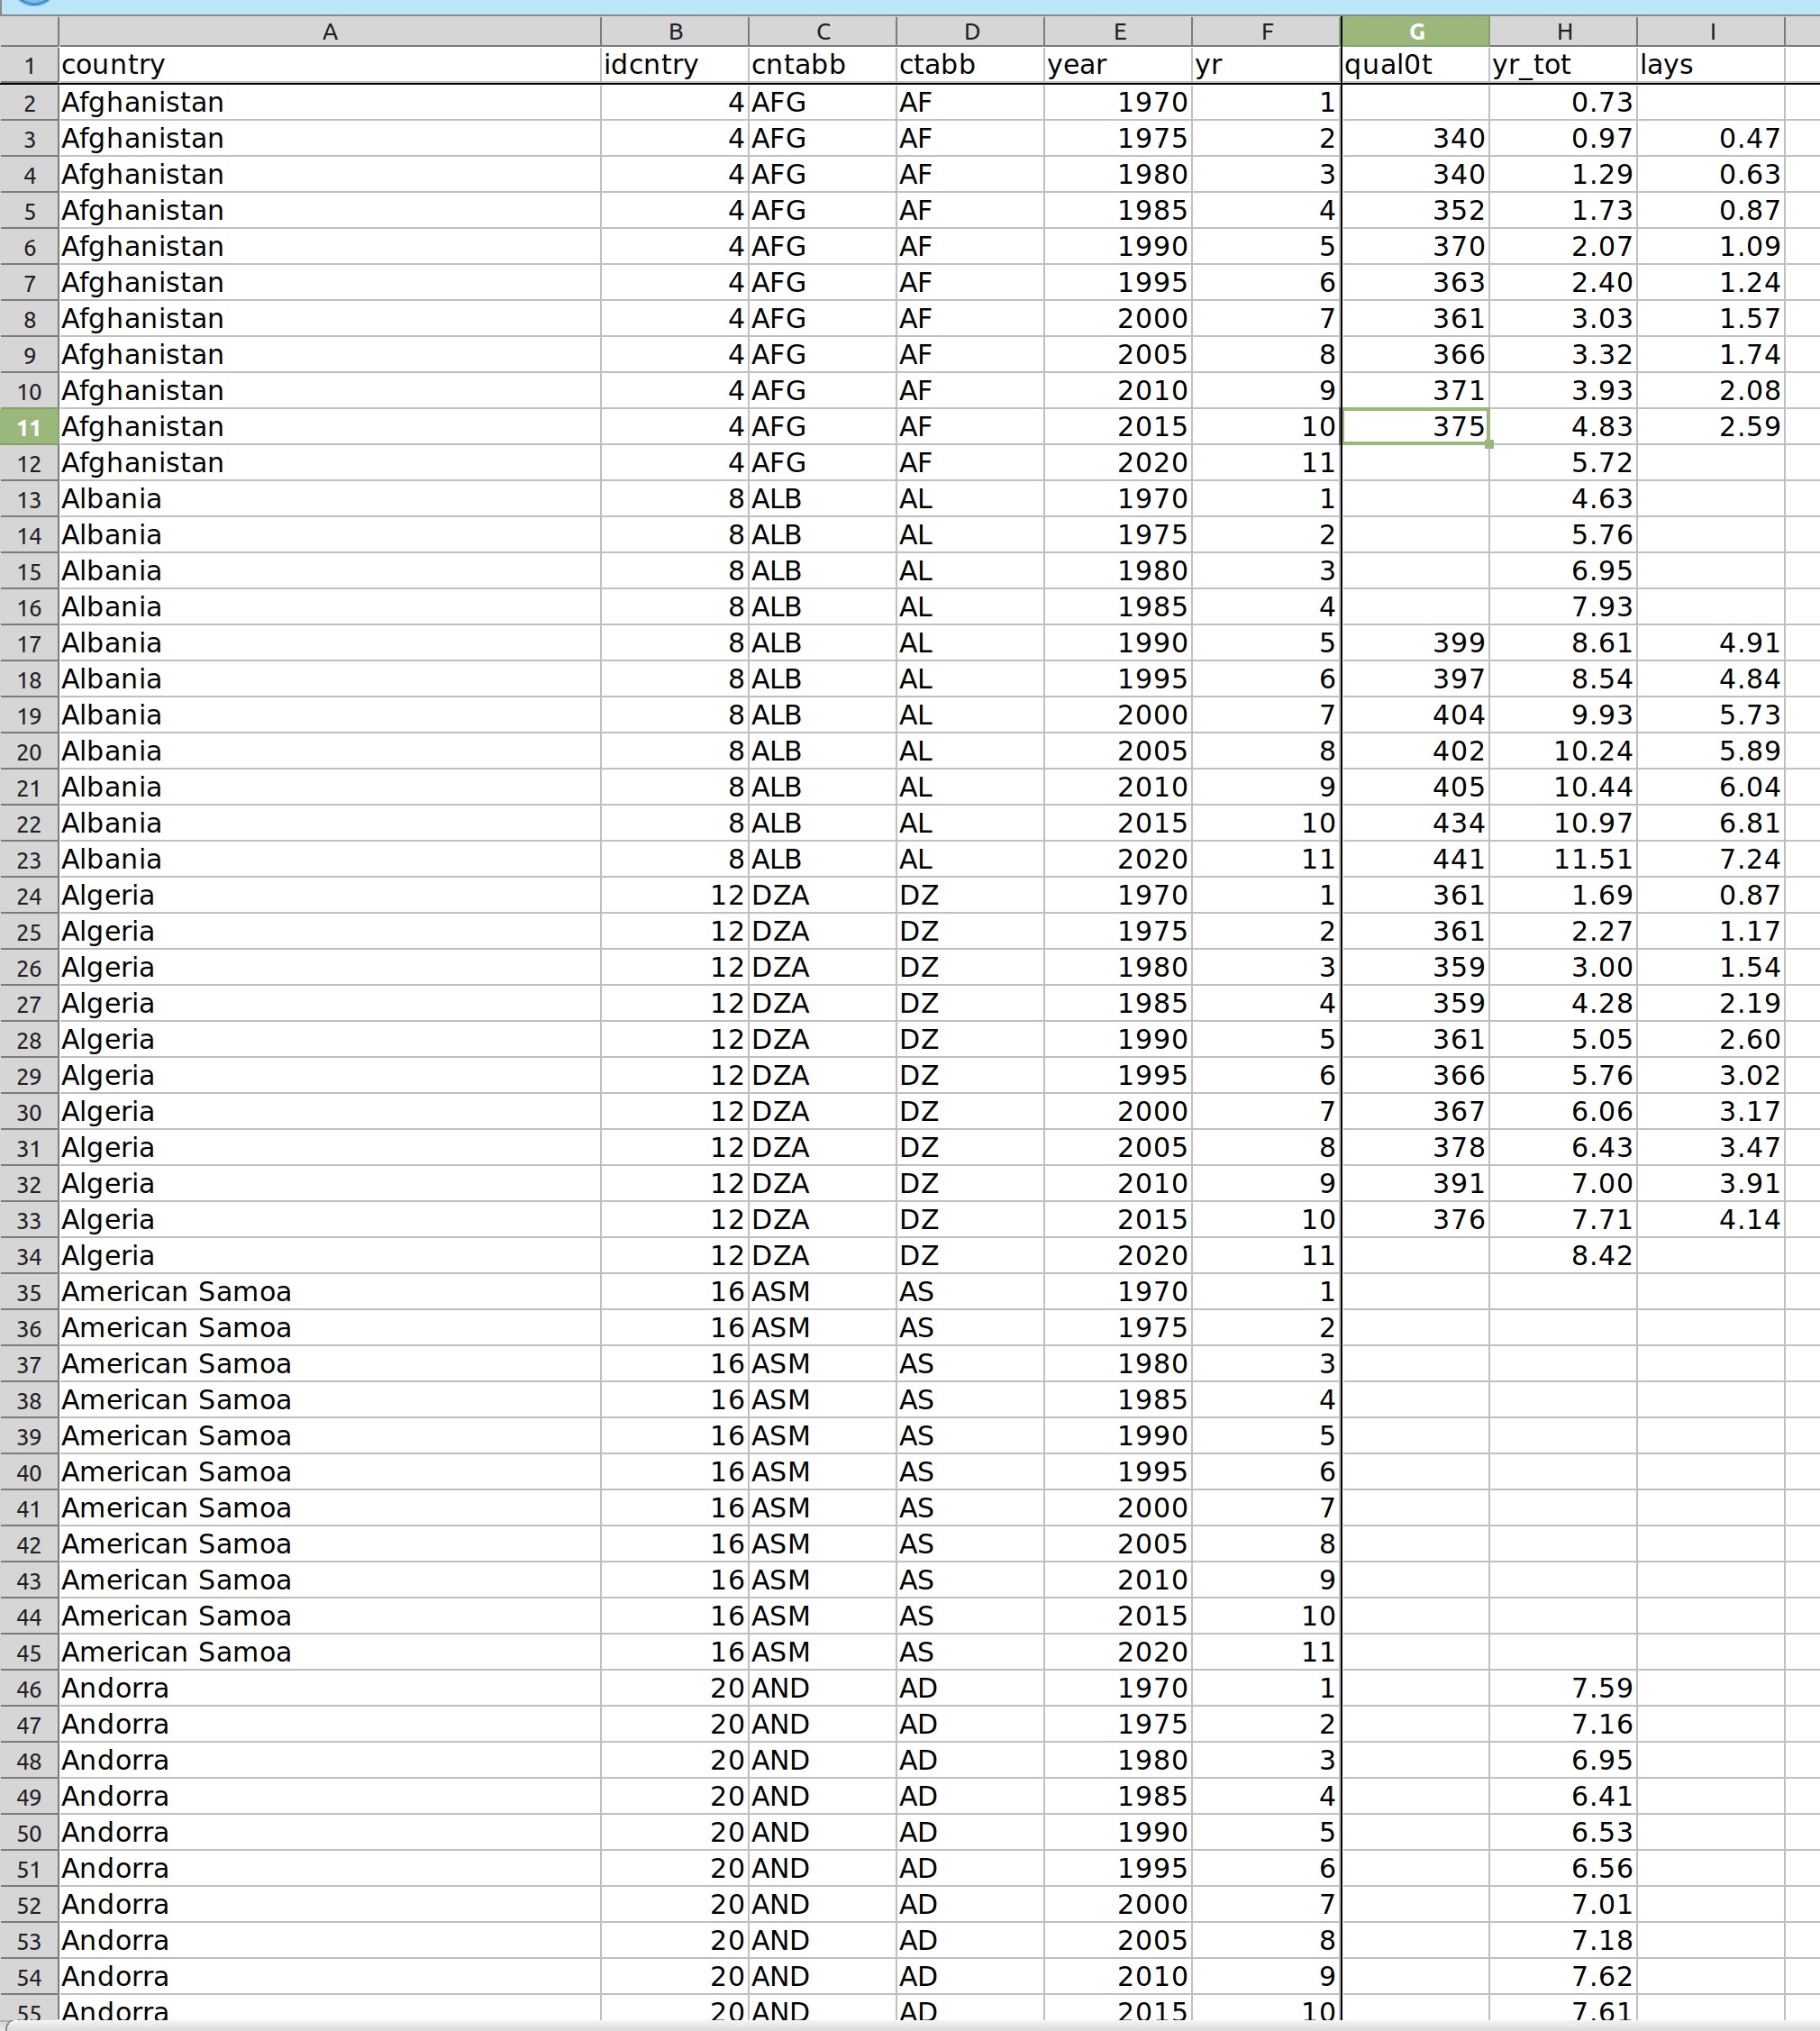
So “qual0t” are the test scores (not on the IQ scale), and “lays” is the learning-adjusted years of education, their new metric. Their dataset has missing values, some of which can be seen above. There is 2020 data for Albania but not for the other countries, presumably because they didn’t participate in some kind of school study in that time period, or that the authors didn’t impute the values so far into the future. Who knows. In terms of data availability by year, it looks like this:
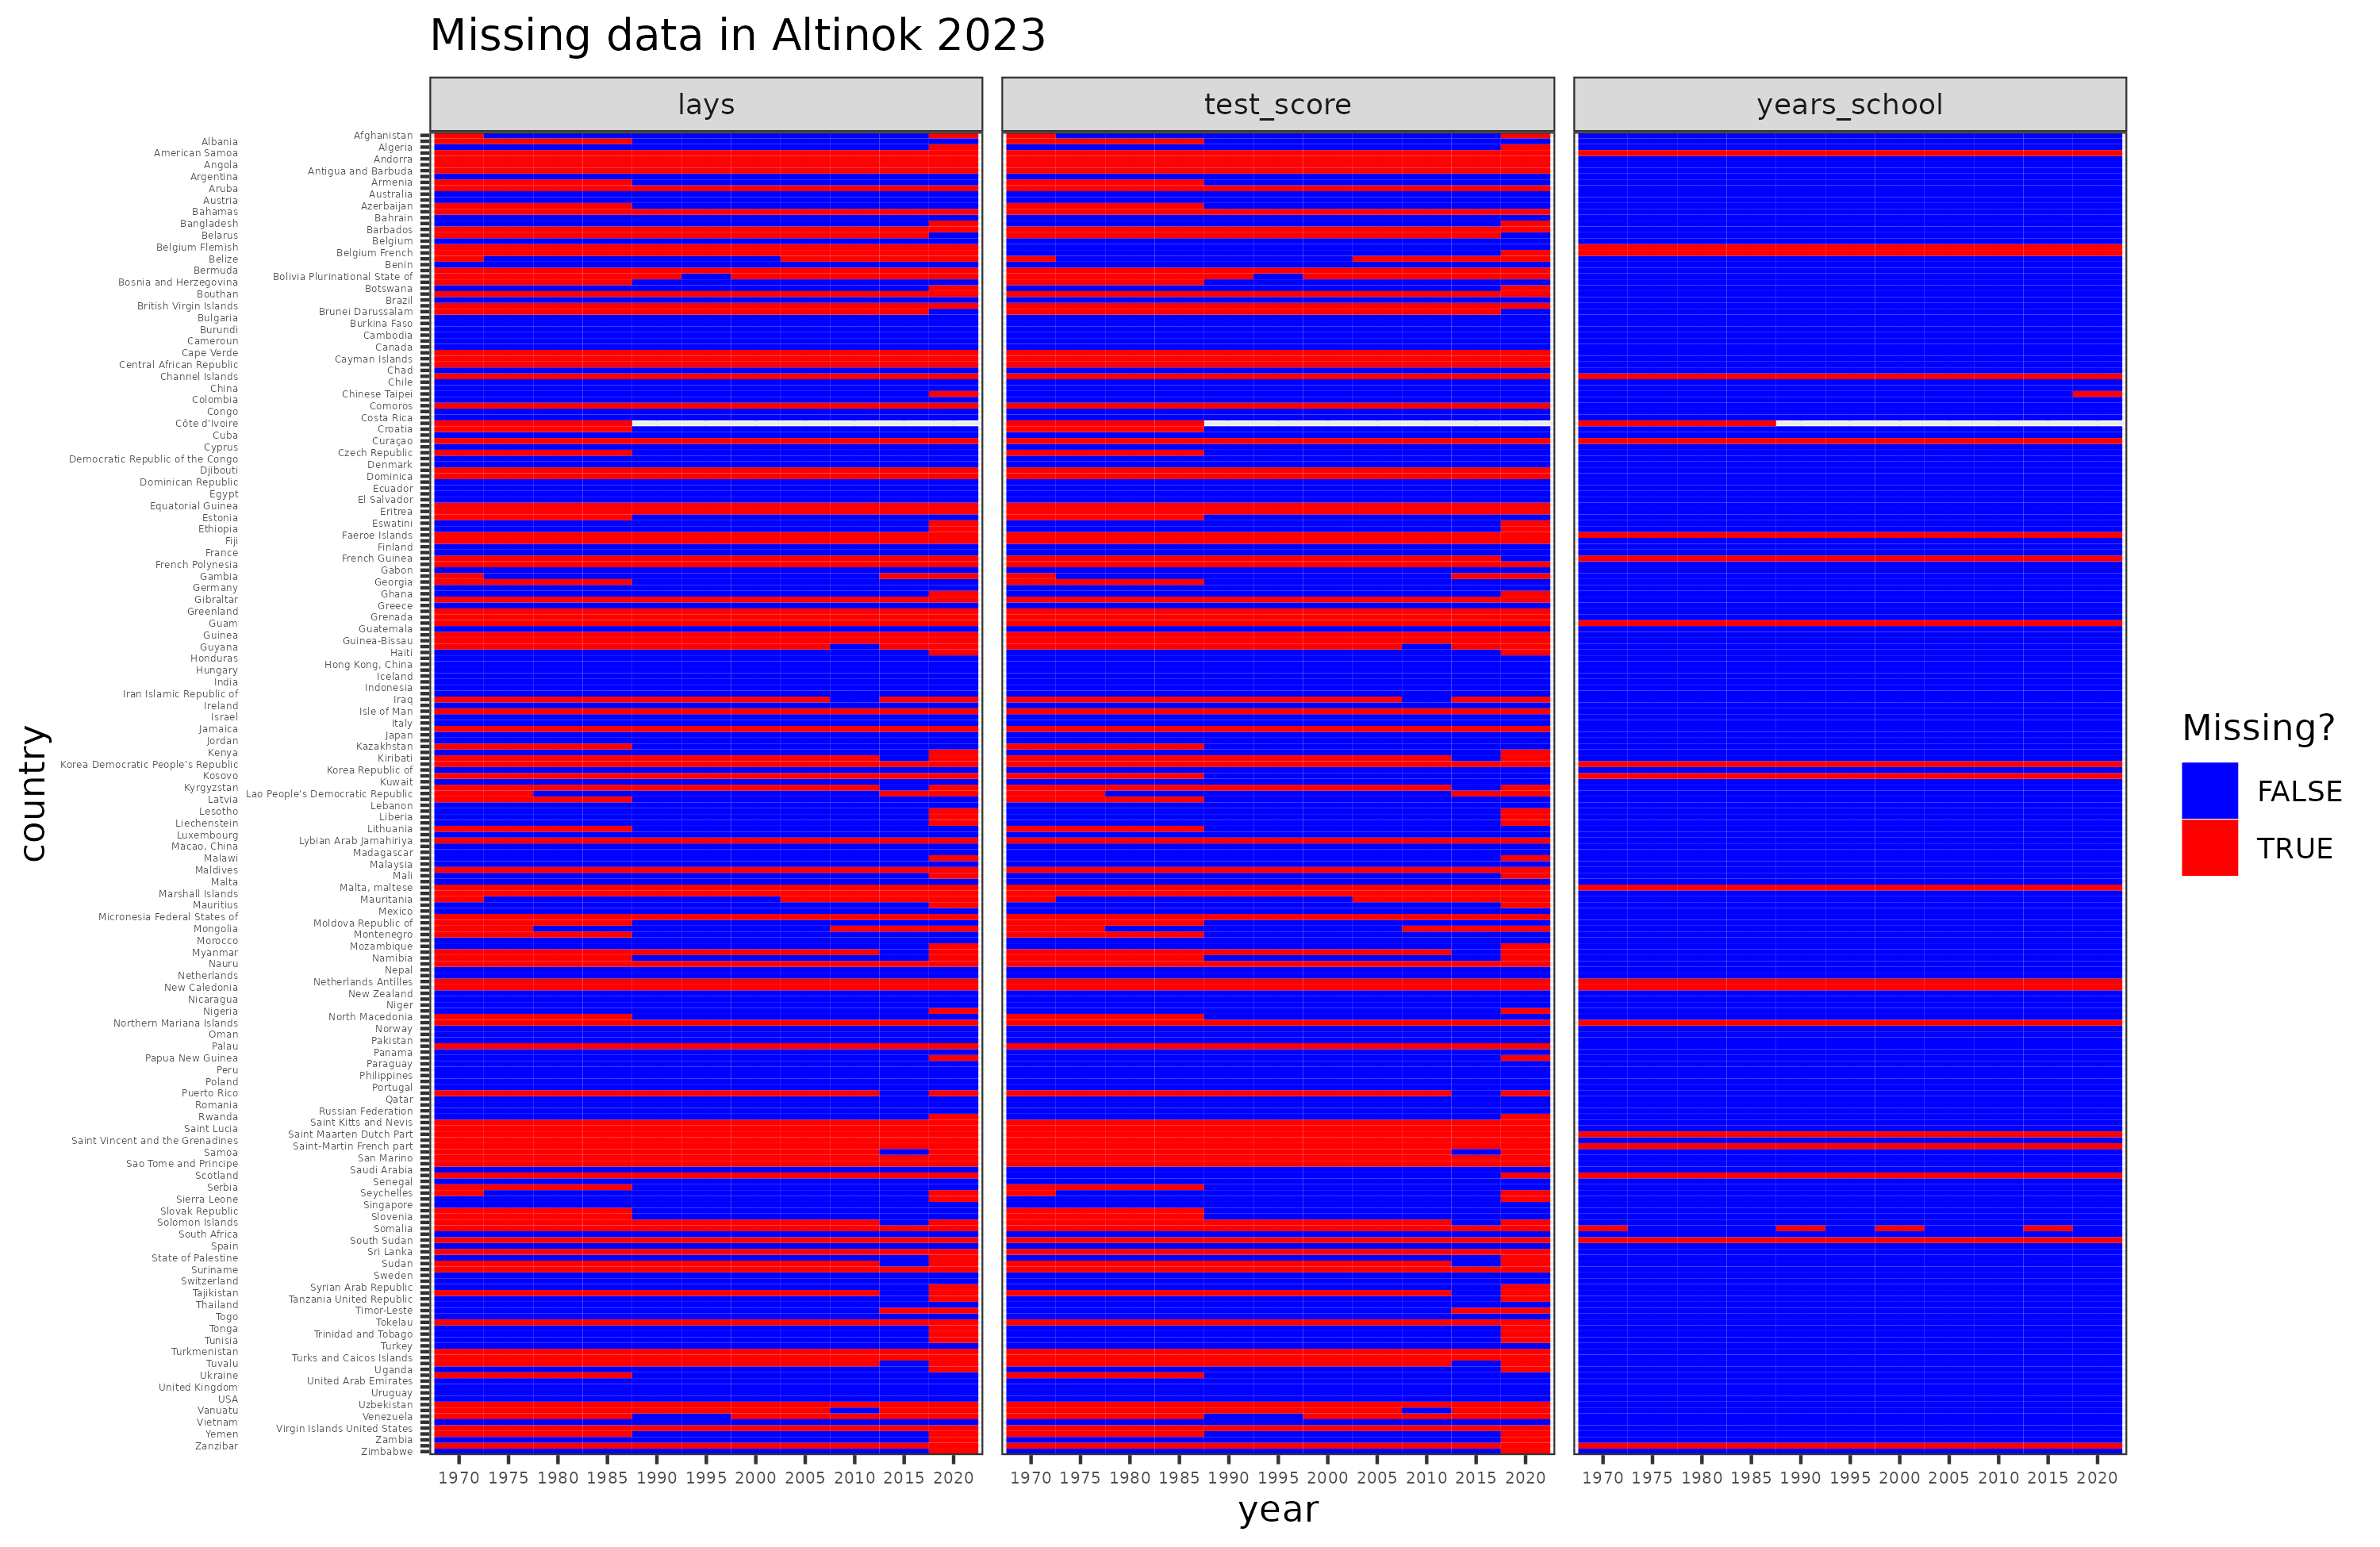
So there’s quite a bit of missing data, with some countries having no data at all, and others very sparse data. This is no different than any other international dataset. There also appears to be a hole for Côte d’Ivoire where the authors apparently forgot to fill in the rows for years 1990-2020.
Super, so a new, public dataset covering most countries. Let’s see how well it correlates with the prior collection of such meta-analytic estimates. I compared it with 5 prior sets of estimates:
- Lynn 2012. Still the most comprehensive, includes both IQ tests and scholastic tests.
- Rindermann 2018. Only includes scholastic tests with various corrections for sampling biases.
- Becker 2019. Includes some IQ tests and scholastic tests.
- Lim 2018. Another Lynn copycat, published in The Lancet of all places.
- Woessman 2022. National basic skills.
To do the comparison, I averaged the values for all the years of data for the datasets with estimates for multiple years. I rescaled the non-IQ scale datasets to Lynn 2012. This was done by finding the overlapping countries with Lynn 2012, then rescaling the non-IQ scale dataset so that it has the same mean and SD as Lynn for that overlap. Rindermann 2018 and Becker 2019 were already on IQ scale, so this wasn’t necessary, though their scales are slightly different from Lynn 2012’s.
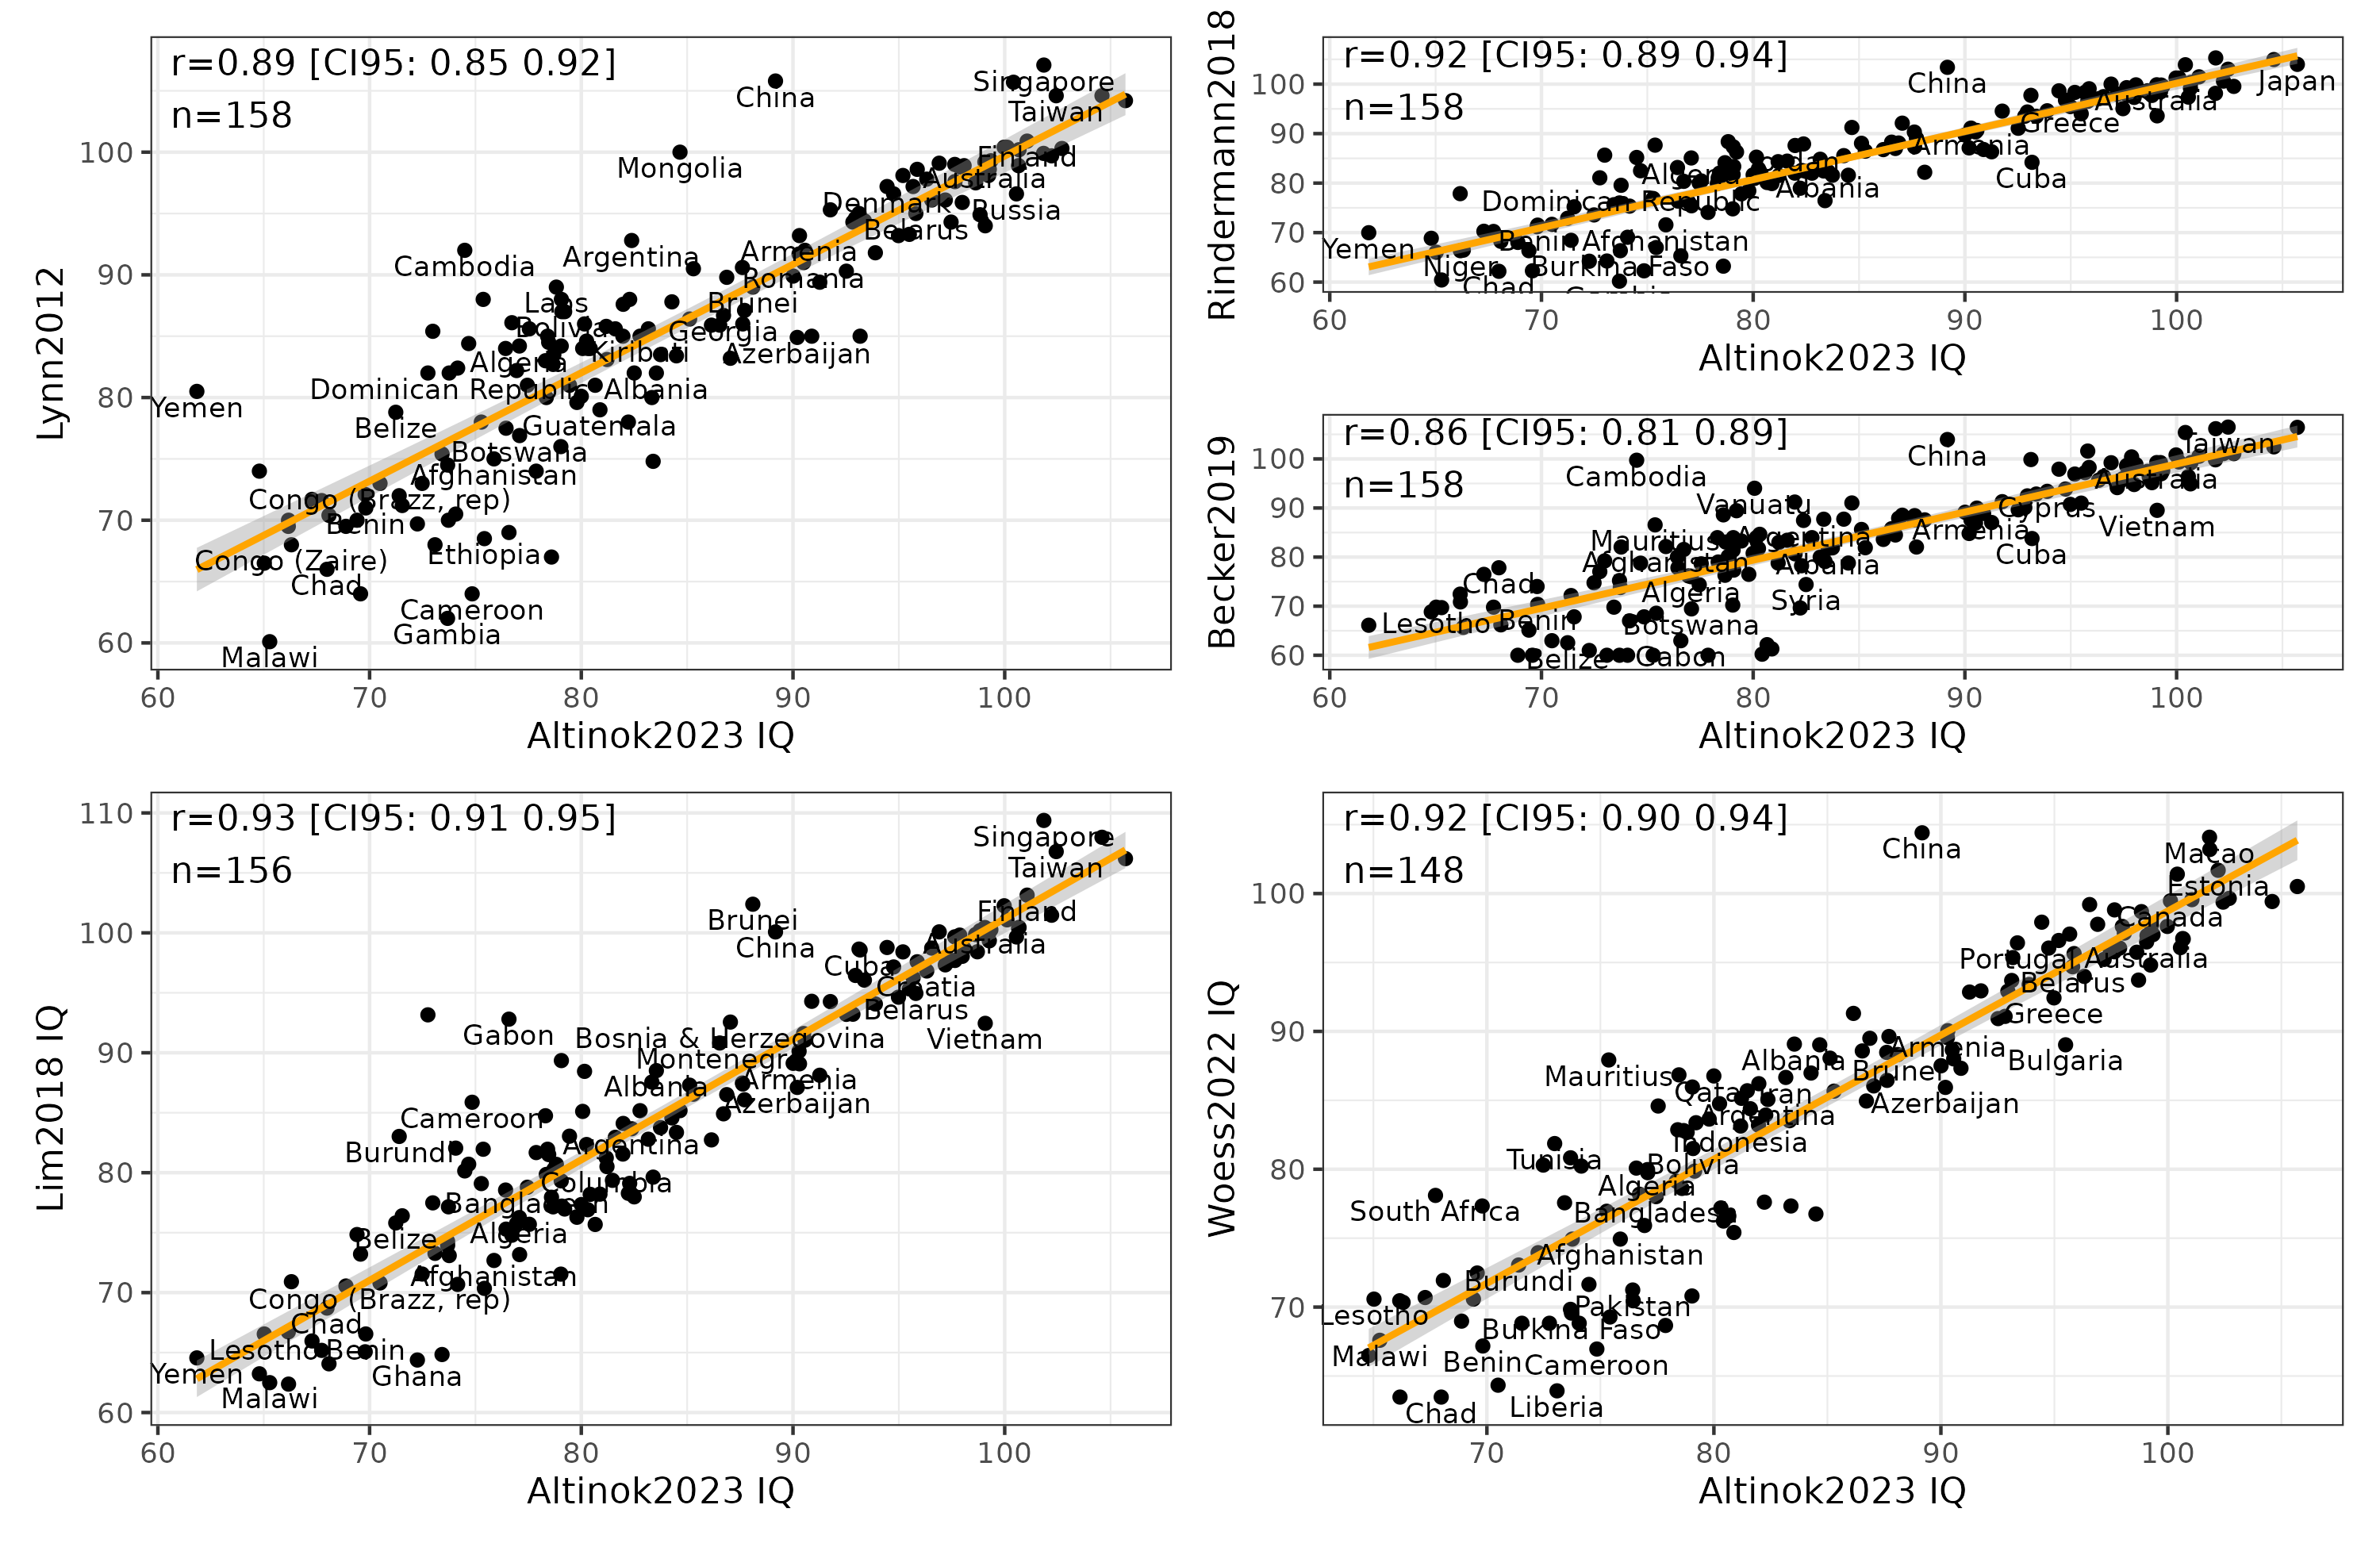
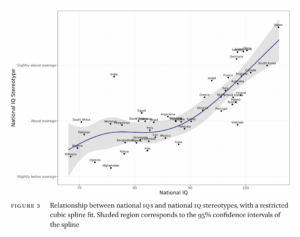
We know that all such national IQ datasets correlate very strongly, and Altinok 2023 is no exception. Its correlations with the 5 other datasets are: .89, .93, .92, .86, and .92. The main outlier of interest is again China, which has strangely aberrant IQs across datasets either over 100 or below 90! Clearly, getting to the bottom of this China discrepancy is very important as this is the country with the largest population in the world, and the current challenger for world power against USA. Fortunately, Seb Jensen recently reviewed Chinese IQ data in some detail (twice), concluding that the average should be close to 100 (97-105?). The exact value depends on judgement calls regarding certain datasets. Still, the value cannot be the sub-90 that some datasets have. I didn’t look into the details of how they arrived at such a value.
For the purposes of easy research and curiosity among the readers, I have posted the collection of datasets here on Google Sheets for anyone to reuse. It includes both the original and Lynn-scaled data. I have also added an inclusive average of values across datasets that people can use to avoid dataset-specific variance. Maybe it will also help avoid frivolous political attacks.
For those wondering about Sub-Saharan African IQs, the new dataset shows the same thing as prior datasets:
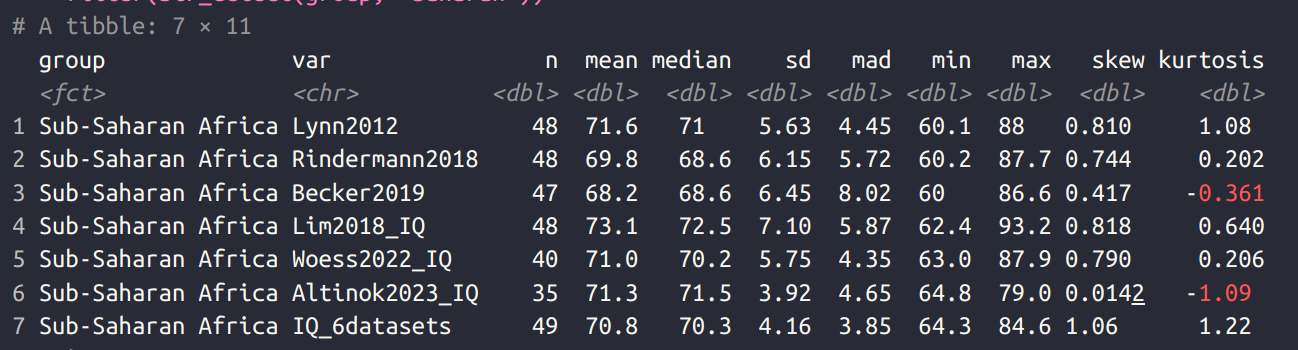
Of the 35 countries covered in Sub-Saharan Africa, their mean IQ was 71.3. This is marginally lower than the much attacked Lynn 2012 estimate which was 71.6. The new 6-dataset average is 70.8 IQ. As such, those who wish to question African IQs need to broaden their attack to include the various Lynn copycats, whether they are Asians publishing in The Lancet, or economists who talk about “national basic skills” or “test scores”.
Appendix: economists as a replication team
Economists are in general fond of repeating the work of others independently while being oblivious to prior work. There are many examples in psychometrics where someone else later reinvented essentially the same thing. As master economist Andrew Gelman noted:
A recentish example I came across was computerized adaptive testing, which economists sort of reinvented a simple version of (Falk et al 2016).
In other words, give people an average item. If they get a high value, give them an item designed to measure high values, if not, give them the opposite. Repeat a few times. This is more efficient than giving everybody every item (“fixed length tests”).