Years ago, a very flashy finding by Kahan and colleagues (2017) got popular (1200+ citations). It goes like this, you give people some matrices of fake study data like these:

So you tell people that some treatment/policy was given to two groups of people/units. The trick is that these groups are of unequal size, instead of the intuitively expected 50-50% that we usually see in randomized controlled trials. As such, one cannot just look at the counts of units that improved with treatment, one must calculate the fractions and compare those. Doing those numbers in the head is a bit obnoxious, but clearly the 223/75 (2.97 OR) is smaller than 107/21 (5.09 OR). Depending on which labels are put on, then, the subject just has to 1) realize that fractions or odds ratios are to be used, not raw counts, 2) determine which number is higher, and 3) click the right option. In the top left table (A), thus, the hypothetical cream was effective against the rash since the proportion of people who got better is higher. The labels are just for distraction and it’s a relatively simple math question. To do the study, then, you survey some people and give them a random subset of these questions, with labels chosen at random, some political, some not. If you gave them all of them, they would figure out the trick and the study probably wouldn’t find too much of interest. Before giving them these questions, you measure their numeracy IQ and ask their political leanings. Now you are ready to fit some regression models to predict whether a given person solved the trick questions. The way motivated reasoning/Bayesian priors enters the picture is that if people already think the conclusion is true (guns prevent violence, say), then they are probably less likely to double check their math, and thus more likely to make mistakes. For the control condition of the cream and rash (non-political):

We see the expected effect of numeracy increasing the chances that people get that item right. But what about the political versions?:

Here they just split the sample in 2 by political leaning (left vs. right). For the gun ban vs. violence, their plot shows that numeracy seemingly does not predict getting the trick question right unless it aligns politically. Thus, it appears both sides have about equal motivated reasoning/Bayesian priors.
So what is the issue? Their sample size is fairly reasonable, 1100 Americans fairly balanced for politics (Yougov data). But there are some replication studies. First Kahan et al published their own n=800 people direct replication in reply to some critics:

Basically you just eyeball whether the distributions look about the same in the top 3 vs. bottom 3 plots. They are reasonably similar. The last one is where the results are opposite of the person’s political priors (gun bans increased violence for leftists, and gun bans decreased violence for rightists), and in that plot the mean of the distributions is about the same, which is to say, numeracy did not predict higher chances of getting the trick question right. Their multivariate table requires some skill to interpret:

Line by line:
- LR = -0.19: conservatives worse overall (in crime decrease reference)
LR_x_crime_increase = 0.43: but this flips in crime increase — conservatives better there
LR_x_num = -0.16: the numeracy gap between cons and libs widens with numeracy (in crime decrease)
LR_x_crime_increase_x_num = 0.23: and this widening is less reversed in crime increase
I tried generating more plots based on this model summary, which gives us this overall effect:

The difference between the slopes for congruent vs. incongruent (whether the ‘real’ effect in the study was in line with politics-related expectations) show that numeracy predicts getting the trick item right less strongly when the prior is wrong. The right side just shows the difference between the plots across the range. However, if we split it by politics, we see:

The effect is only really seen for the conservatives. It appears only the conservatives have prior issues.
The difficulty of doing this forensic analysis is that Kahan et al did not publish their data. I’ve emailed Dan Kahan to ask for the raw data, and will update if I hear back from him.
Anyway, there are some 3rd party replications as well. There are two studies with public data, one by Persson et al 2021, and one by Stagnaro et al 2023. Stagnaro had 2000+ people and added 4 more variants (topics) to test generalization. Since their data is public, I was able to replicate their published results almost exactly. Stagnaro say they used OLS for binary data because “the coefficients are more easily interpretable” but then reported standardized coefficients, which are not interpretable in that way. It doesn’t usually matter much of one uses OLS or logistic regression though (OLS can produce out of bounds predictions since it doesn’t know the values cannot exceed 0-1 range). Stagnaro published this result:

They note:
Now we turn to the key test of MS2R: Does the relationship between reasoning ability and answer correctness disappear when the correct outcome is challenging to the subject’s identity? The answer here is a clear “No”: When the interaction between outcome concordance and numerical ability is added to the model, we find a precisely estimated null interaction (β = 0.002, CI = [−0.04, 0.0043], P = 0.94). Numeracy shows a highly significant positive relationship with answer correctness regardless of whether the outcome is concordant (β = 0.111, CI = [0.099, 0.317], P < 0.001) or discordant (β = 0.110, CI = [0.095, 0.307], P < 0.001), see Fig. 1A. There is also no significant three-way interaction when including the subject’s political ideology in the model (β = 0.025, CI = [−0.024, 0.061], P = 0.387), such that there is no significant interaction between outcome concordance and numerical ability for liberal Democrats (β = 0.006, P = 0.879) or conservative Republicans (β = −0.001, P = 0.999). Results are qualitatively equivalent when also including a quadratic term for numeracy.
Which is to say that they found that people are less likely to get trick items right when they conflict with the prior (usually called belief bias), but there was nothing else to report, no higher interactions. Using their data, this was my replication:

There is however a different effect in both Stagnaro and Persson’s data, leftists appear to benefit more from intelligence in getting the trick items right, but it doesn’t have to do with the topic (at least, not detectably so):

The model may say the slope interactions are definitely real (p’s < .001 and 0.003) but looking at the left plot, we see that they are clearly non-monotonic and linear modeling is dubious. If one uses a quadratic term instead, nothing is found. I think the (eternal) lesson here is to always plot the data to see if what the model is telling you makes sense. Here’s the quadratic fits:

These models beat the linear model in model comparison metrics (p’s <0.1% and 1.4%). The apparent slope interaction is because a wrong slope form is used. This quadratic item response curve is in fact the most interesting thing about these studies. It would appear that a little numeracy makes you worse at this trick question. This is a high unusual pattern for an item. I’ve analyzed 1000s of items with item response theory and I don’t recall one item with this U-pattern. My guess is that people who fill out the survey at random get around 0 numeracy score, and they get ~50% pass rate on the trick question. This creates the apparent beneficial effect of low numeracy but is really just systemic measurement error. One piece of evidence against this is that the rash condition doesn’t show this pattern, which it should if it was merely random responders causing this.
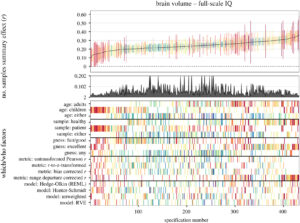
I kept torturing the data to see if I can find any specification that resulted in the ‘motivated reasoning’ pattern, but I didn’t find much support for this interaction. I also did meta-analysis of the results from the linear models, but overall they don’t find much of anything. I am not keen on giving much weight to these because we cannot verify results in the 2 Kahan et al studies without the underlying data. Looking at the Kahan plot above, the same U-shaped item response curve is seen.
For those wondering about who is better at math: Cohen’s d’s are 0.14, -0.38 (MTurk), -0.12 for rightists over leftists. Combined these add up to about 0.