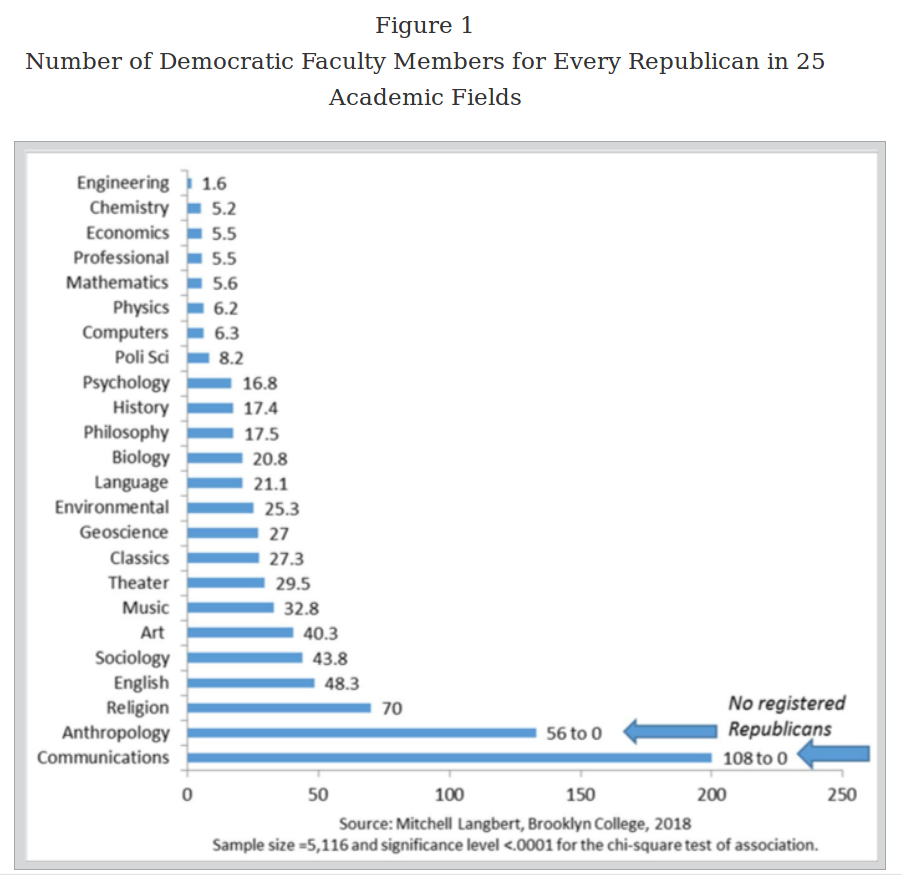
There’s a lot of evidence for left-wing dominance of academia. One study (Langbert 2018) looked at registered voters and finds quite unbelievable differences:
In this article I offer new evidence about something readers of Academic Questions already know: The political registration of full-time, Ph.D.-holding professors in top-tier liberal arts colleges is overwhelmingly Democratic. Indeed, faculty political affiliations at 39 percent of the colleges in my sample are Republican free—having zero Republicans. The political registration in most of the remaining 61 percent, with a few important exceptions, is slightly more than zero percent but nevertheless absurdly skewed against Republican affiliation and in favor of Democratic affiliation. Thus, 78.2 percent of the academic departments in my sample have either zero Republicans, or so few as to make no difference.
My sample of 8,688 tenure track, Ph.D.–holding professors from fifty-one of the sixty-six top ranked liberal arts colleges in the U.S. News 2017 report consists of 5,197, or 59.8 percent, who are registered either Republican or Democrat. The mean Democratic-to-Republican ratio (D:R) across the sample is 10.4:1, but because of an anomaly in the definition of what constitutes a liberal arts college in the U.S. News survey, I include two military colleges, West Point and Annapolis.1 If these are excluded, the D:R ratio is a whopping 12.7:1.
My guess here is that republican professors are likely to avoid registering to vote if this fact can be discovered by their colleagues, who perhaps suspect something and are likely to want to retaliate. However, this bias should not be present in anonymous surveys of professors, so can we find a similar ranking based on that? Yep, Klein and Stern (2005) reported some results:
In Spring 2003, a large-scale survey of American academics was conducted using academic association membership lists from six fields: Anthropology, Economics, History, Philosophy (political and legal), Political Science, and Sociology. This paper focuses on one question: To which political party have the candidates you’ve voted for in the past ten years mostly belonged? The question was answered by 96.4 percent of academic respondents. The results show that the faculty is heavily skewed towards voting Democratic. The most lopsided fields surveyed are Anthropology with a D to R ratio of 30.2 to 1, and Sociology with 28.0 to 1. The least lopsided is Economics with 3.0 to 1. After Economics, the least lopsided is Political Science with 6.7 to 1. The average of the six ratios by field is about 15 to 1. Our analysis and related research suggest that for the the social sciences and humanities overall, a “one-big-pool” ratio of 7 to 1 is a safe lower-bound estimate, and 8 to 1 or 9 to 1 are reasonable point estimate. Thus, the social sciences and humanities are dominated by Democrats. There is little ideological diversity. We discuss Stephen Balch’s “property rights” proposal to help remedy the situation.
The list of overlapping fields is smallish, but sufficient for our purposes. It looks like this:
| Field | Survey | Registered | Ratio |
| anthropology | 30.2 | 56 | 1.85 |
| economics | 3 | 5.5 | 1.83 |
| history | 9.5 | 17.4 | 1.83 |
| philosophy | 13.5 | 17.5 | 1.30 |
| political science | 6.7 | 8.2 | 1.22 |
| sociology | 28 | 43.8 | 1.56 |
If we look at the relative agreement, it is convincingly large at r = .98. However, we see that the registration method consistently produces larger ratios, suggesting some hiding of republicans. The average ratio is 1.60.