A friend sent me this amazing study, seems to have been previously overlooked by hereditarians.
- Bakken, T. E., Dale, A. M., Schork, N. J., & Alzheimer’s Disease Neuroimaging Initiative. (2011). A geographic cline of skull and brain morphology among individuals of European Ancestry. Human heredity, 72(1), 35-44.
Background
Human skull and brain morphology are strongly influenced by genetic factors, and skull size and shape vary worldwide. However, the relationship between specific brain morphology and genetically-determined ancestry is largely unknown.
Methods
We used two independent data sets to characterize variation in skull and brain morphology among individuals of European ancestry. The first data set is a historical sample of 1,170 male skulls with 37 shape measurements drawn from 27 European populations. The second data set includes 626 North American individuals of European ancestry participating in the Alzheimer’s Disease Neuroimaging Initiative (ADNI) with magnetic resonance imaging, height and weight, neurological diagnosis, and genome-wide single nucleotide polymorphism (SNP) data.
Results
We found that both skull and brain morphological variation exhibit a population-genetic fingerprint among individuals of European ancestry. This fingerprint shows a Northwest to Southeast gradient, is independent of body size, and involves frontotemporal cortical regions.
Conclusion
Our findings are consistent with prior evidence for gene flow in Europe due to historical population movements and indicate that genetic background should be considered in studies seeking to identify genes involved in human cortical development and neuropsychiatric disease.
Main highlights from the paper text:
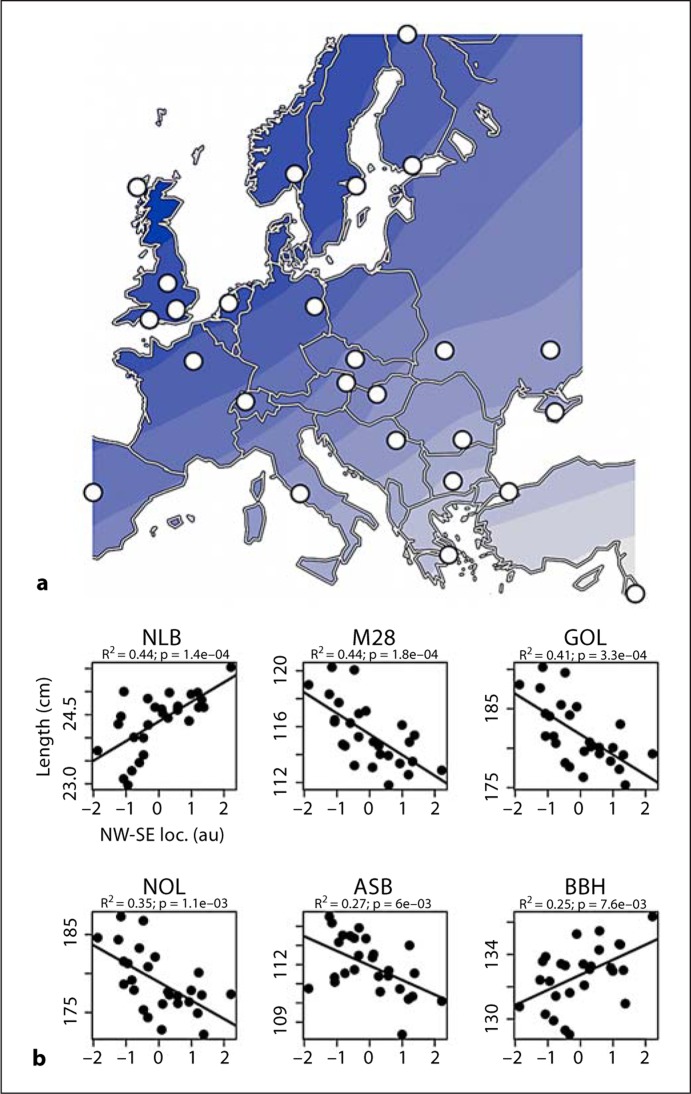
We then tested the hypothesis that skulls exhibit clinal variation along geographic axes within Europe. A directional Mantel correlogram shows a monotonic decrease in craniometric similarity with distance in two orthogonal directions, NW-SE and NE-SW (online suppl. fig. S3B), and this result motivated us to search for a geographic axis that can explain a significant fraction of the craniometric variation between populations. Redundancy analysis, a constrained version of principal components analysis (PCA), was used to find a projection that maximizes the variation of the 37 cranial measures under the condition that this projection is a linear combination of longitude and latitude. The first principal component is statistically significant (p = 0.005) and explains 12.8% of total craniometric variation, more than a third of the variation (30.5%) explained by the first component of an unconstrained PCA. Population eigenvalues for the first principal component were interpolated by ordinary kriging and plotted to create an isocline map of Europe (fig. (fig.2a).2a). Cross-validation indicated that predicted population eigenvalues were highly correlated with observed values (r = 0.88). Significantly, this map shows a clear gradient along a NW-SE axis that was not specified a priori and emerged from the redundancy analysis as the direction of maximum cranial variation. Therefore, a subset of cranial measures exhibits clinal variation along this geographic axis.

–
Intracranial and brain volumes and cortical surface area progressively increase with the amount of inferred NW European ancestry (fig. (fig.3b),3b), and these measures are approximately 5% larger in the 10% of individuals with the most NW European ancestry compared to the 10% with the most SE European ancestry. This percentage increase matches the percentage increase in cranial length and breadth observed along the same NW-SE geographic axis in the skull data set (fig. (fig.2b)2b) and cannot be attributed to a correlation with body size since we controlled for height and weight. This correlation involves specific – not global – brain morphology because hippocampal, basal ganglia, ventricular, and cerebellar volumes and average cortical thickness are not associated with NW-SE ancestry.
–
In this study, we leveraged brain imaging and genome-wide genotyping from 626 European Americans, as well as skull measurements obtained on an independent set of 1,170 individuals of European ancestry, to test the hypothesis that skull and brain morphology, like genetic background [14,15], mirror geography within Europe. We found that skull and brain morphology vary continuously across Europe as evidenced by the weak clustering between and large variation within populations and are geospatially structured. In particular, we observed a significant NW-SE gradient in morphology that is independent of body size and involves predominantly frontotemporal cortical areas.
–
The genetic basis for this geographic trend in skull and brain variation is strengthened by the observation of the trend in North American individuals of European ancestry. The environment – e.g. nutrition and prenatal healthcare – can influence skull morphometry due to developmental plasticity [12,13] and may be correlated with genetic variation across Europe. In contrast, environmental exposures may vary among European Americans, but this variation is less likely to be geographically structured based on individuals’ European ancestry. Furthermore, Ashkenazi Jewish individuals are geographically dispersed in Europe and yet are genetically quite similar and genetically intermediate between SE European and Middle Eastern populations [26,42,43,44]. This provides further support that the observed NW-SE clinal variation in brain morphology is driven by genetic more than environmental differentiation of these populations.
Finally:
It is plausible that genes responsible for cortical expansion during human evolution retain a role in brain development and contribute to normal variation in brain morphology within and between modern human populations [3,49]. Identifying these genes could contribute to our understanding of developmental abnormalities associated with neuropsychiatric diseases such as autism and schizophrenia. In this context, admixture mapping may prove to be a powerful strategy for identifying genomic regions responsible for overt brain morphology differences among individuals of European ancestry. Independent of the use of inferred ancestry for identifying genes, our results indicate that studies seeking to identify genes that influence brain morphology should consider genetic background, as it reflects historical mixing and then isolation of populations.