I am a major proponent of drug legalization, and have also been following the research on drugs’ influence on driving skills. In media discourse, it is taken for granted that driving under the influence (DUI) is bad because it causes crashes. This is usually assumed to be true for drugs at large, but especially THC (cannabis) and alcohol gets attention. Unfortunately, most of the research on the topic is non-experimental, and so open to multiple causal interpretations. I will focus on the recently published report, Drug and Alcohol Crash Risk (US Dept. of Transportation), which I found via The Washington Post.
The study is a case-control design where they try to adjust for potential correlates and causal factors both by statistical means and by data-collection means. Specifically:
The case control crash risk study reported here is the first large-scale study in the United States to include drugs other than alcohol. It was designed to estimate the risk associated with alcohol- and drug-positive driving. Virginia Beach, Virginia, was selected for this study because of the outstanding cooperation of the Virginia Beach Police Department and other local agencies with our stringent research protocol. Another reason for selection was that Virginia Beach is large enough to provide a sufficient number of crashes for meaningful analysis. Data was collected from more than 3,000 crash-involved drivers and 6,000 control drivers (not involved in crashes). Breath alcohol measurements were obtained from a total of 10,221 drivers, oral fluid samples from 9,285 drivers, and blood samples from 1,764 drivers.
Research teams responded to crashes 24 hours a day, 7 days a week over a 20-month period. In order to maximize comparability, efforts were made to match control drivers to each crash-involved driver. One week after a driver involved in a crash provided data for the study, control drivers were selected at the same location, day of week, time of day, and direction of travel as the original crash. This allowed a comparison to be made between use of alcohol and other drugs by drivers involved in a crash with drivers not in a crash, resulting in an estimation of the relative risk of crash involvement associated with alcohol or drug use. In this study, the term marijuana is used to refer to drivers who tested positive for delta-9-tetrahydrocannabinal (THC). THC is associated with the psychoactive effects of ingesting marijuana. Drivers who tested positive for inactive cannabinoids were not considered positive for marijuana. More information on the methodology of this study and other methods of estimating crash risk is presented later in this Research Note.
So, by design, they control for: location, day of week, time of day, direction of travel. It is also good that they don’t conflate inactive metabolites with THC as commonly done.
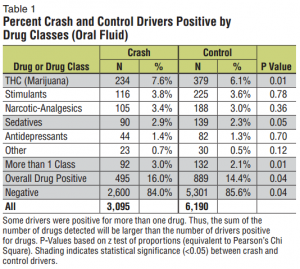
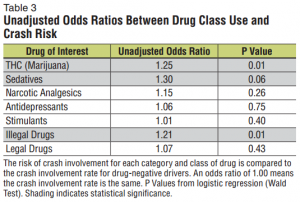
The basic results are shown in Tables 1 and 3.
The first shows the raw data, so to speak. It can be seen that drug use while driving is fairly common at about 15% both in crash drivers and normal drivers. Since their testing probably didn’t detect all possible drugs, these are underestimates (assuming that the testing does not bias it with uneven false positive/false negative rates).
Now, the authors write:
These unadjusted odds ratios must be interpreted with caution as they do not account for other factors that may contribute to increased crash risk. Other factors, such as demographic variables, have been shown to have a significant effect on crash risk. For example, male drivers have a higher crash rate than female drivers. Likewise, young drivers have a higher crash rate than older drivers. To the extent that these demographic variables are correlated with specific types of drug use, they may account for some of the increased crash risk associated with drug use.
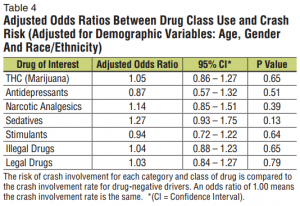
Table 4 examines the odds ratios for the same categories and classes of drugs, adjusted for the demographic variables of age, gender, and race/ethnicity. This analysis shows that the significant increased risk of crash involvement associated with THC and illegal drugs shown in Table 3 is not found after adjusting for these demographic variables. This finding suggests that these demographic variables may have co-varied with drug use and accounted for most of the increased crash risk. For example, if the THC-positive drivers were predominantly young males, their apparent crash risk may have been related to age and gender rather than use of THC.
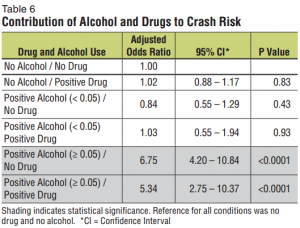
Table 4 looks like this, and for comparison, Table 6 for alcohol:
The authors do not state anything outright false. But they only mention one causal model that fits the data, the one where THC’s rule is non-causal. However, it is more proper to show both models openly:
The first model is the one discussed by the authors. Here demographic variables cause THC use and crashing, but THC use has no effect on crashing. THC use and crashing are statistically associated because they have a common cause. In the second model, demographic variables cause both THC use and crashing, and THC use also causes crashing. In both models, if one controls for demographic variables, the statistical associated of THC use and crashing disappears. Hence, controlling for demographic variables cannot distinguish between those two important models.
However, they can test the second model by controlling for THC use and seeing if demographic variables are still associated with crashing. If they are not, the second model above is falsified (assuming no false negative/adequate statistical power).
Alcohol was still associated with crashing even controlling for demographic variables, which strengthens the case for its causal effect.
How common is alcohol driving?
Incidentally, some interesting statistics on DUI for alcohol:
The differences between the two studies in the proportion of drivers found to be alcohol-positive are likely to have resulted from the concentration of Roadside Survey data collection on weekend nighttime hours, while this study included data from all days of the week and all hours of the day. For example, in the 2007 Roadside Survey the percentage of alcohol-positive weekday daytime drivers was only 1.0 percent, while on weekend nights 12.4 percent of the drivers were alcohol-positive. In this study, 1.9 percent of weekday daytime drivers were alcohol- positive, while 9.4 percent of weekend nighttime drivers were alcohol-positive.
Assuming the causal model of alcohol on crashing is correct, this must result in quite a lot of extra deaths in traffic. Another reason to fund more research into safer vehicles:
Mandatory follow-up:


