Disclaimer: Some not too structured thoughts.
It’s commonly said that correlation does not imply causation. That is true (see Gwern’s analysis), but does causation imply correlation? Specifically, if “→” means causes and “~~” means correlates with, does X→Y imply X~~Y? It may seem obvious that the answer is yes, but it is not so clear.
Before going into that, consider transitivity. Wikipedia:
In mathematics, a binary relation R over a set X is transitive if whenever an element a is related to an element b, and b is in turn related to an element c, then a is also related to c.
Is causality transitive? It seems that the answer should be yes. If A causes B, and B causes C, then A causes C. With symbols:
- A→B
- B→C
- ⊢ A→C
(the ⊢ symbol means therefore). If causality is transitive, and causality implies correlation, then we may guess that transitivity holds for correlation too. Does it? Sort of.
The transitivity of correlations
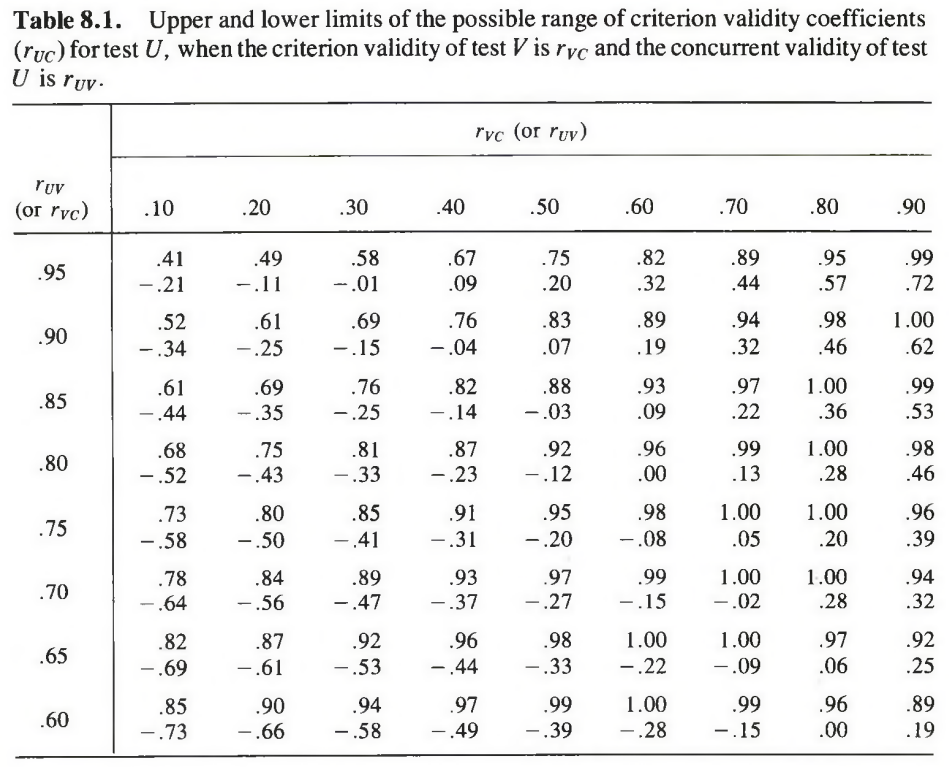
We might more precisely say that it has partial transitivity. If A~~B at 1.0, and B~~C at 1.0, then A~~C at 1.0. However, for correlations ≠ |1|, then it doesn’t hold exactly: If A~~B at 0.7, and B~~C at 0.7, does not imply that A~~C at 0.7 or at 0.72 for that matter (this is the predicted path using path model tracing rules). Instead, there is a range of possible values with 0.72 being the most likely. As usual, the Jensen gives the answer, once or multiple places in his numerous writings. The ranges are given in Jensen (1980, p. 302; Bias in Mental Testing):
[discussing of types of validity] Concurrent validity rests on the soundness of the inference that, since the first test correlates highly with the second test and the second test correlates with the criterion, the first test is also correlated with the criterion. It is essentially this question: If we know to what extent A is correlated with B, and we know to what extent B is correlated with C, how precisely can we infer to what extent A is correlated with C? The degree of risk in this inference can be best understood in terms of the range within which the actual criterion validity coefficient would fall when a new test is validated in terms of its correlation with a validated test. Call the scores on the unvalidated test U, scores on the validated test V, and measures on the criterion C. Then rVC, the correlation between V and C, is the criterion validity of test V; and rUV, the correlation between U and V, is the concurrent validity of test U. The crucial question, then, is what precisely can we infer concerning rUC , that is, the probable criterion validity of test U?
If we know rVC and rUV, the upper and lower limits of the possible range of values of rUC are given by the following formulas: [combined to one]

(I rewrote this using rxy, ryz and rxz instead)
It may come as a sad surprise to many to see how very wide is the range of possible values of rUC for any given combination of values of rVC and rUV. The ranges of rUC are shown in Table 8.1, from which it is clear that concurrent validity inspires confidence only when the two tests are very highly correlated and the one test has a quite high criterion validity. Because it is rare to find criterion validities much higher than about .50, one can easily see the risk in depending on coefficients of concurrent validity. The risk is greatly lessened, however, when the two tests are parallel forms or one is a shortened form of the other, because both tests will then have approximately the same factor composition, which means that all the abilities measured by the first test that are correlated with the criterion also exist in the second test. The two tests should thus have fairly comparable correlations with the criterion, which is a necessary inference to justify concurrent validity.
So, the next time you see someone arguing thru (multiples) steps of transitivity for correlations, beware! Given A~~B at 0.7 and B~~C at 0.7, is still possible that A~~C is 0.0!
Visually, one can think of it in terms of variance explained and overlapping circles. If the A and B circles overlap 50% (which is r≈.71) and the same for B and C, then the question of what A~~C is depends on which whether the overlap between A and B is also the area that overlaps B and C. Because the areas are about 50% each (0.72 = 0.49), both complete overlap (r = 1) and no overlap with a slight remainder are possible (slight negative correlation).
Probably, because this argument often comes up, I should make a visualization.
Back to causation
Now, how does transitivity work for causation? It turns out that it depends on the exact concept we are using. For instance, suppose that A causes higher C and C causes higher Y. Now, we would probably say that A causes higher Y. However, suppose that A also causes higher D and D causes lower Y. Does A cause higher or lower Y? We might say that it depends on the strength of the causal paths. In this way, we are talking about A’s net (main) effect on Y which may be positive, negative or null depending on the strengths of the other causal paths. One might also take the view that A both causes higher and lower Y. This view is especially tempting when the causal paths are differentiated for individuals. Suppose for half the population, A causes higher C and C causes higher Y, and for the other half A causes higher D and D causes lower Y. One might instead say that A’s effect is an interaction with whatever differentiates the two halves of the population (e.g. gender).
Update 27th January 2018
Thanks to Ron for pointing out the error in the original equation I wrote. It was a mistake on my part. I also recalculated Jensen’s table in R, given below.
