Due to lengthy discussion over at Unz concerning the good performance of some African groups in the UK, it seems worth it to review the Danish and Norwegian results. Basically, some African groups perform better on some measures than native British. The author is basically arguing that this disproves global hereditarianism. I think not.
The over-performance relative to home country IQ of some African countries is not restricted to the UK. In my studies of immigrants in Denmark and Norway, I found the same thing. It is very clear that there are strong selection effects for some countries, but not others, and that this is a large part of the reason why the home country IQ x performance in host country are not higher. If the selection effect was constant across countries, it would not affect the correlations. But because it differs between countries, it essentially creates noise in the correlations.
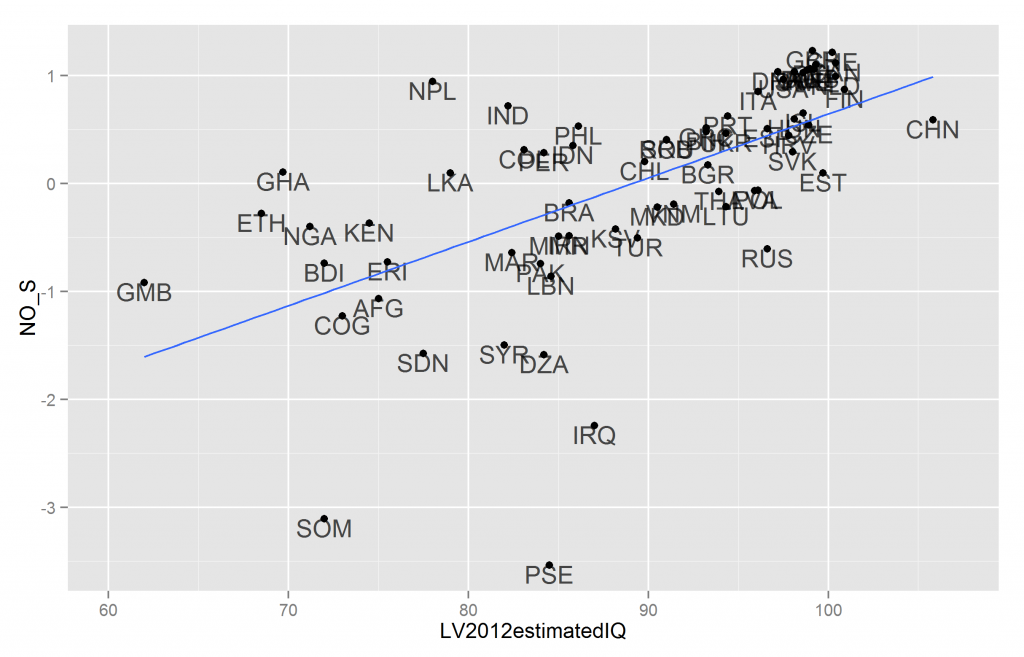
Two plots:
The codes are ISO-3 codes. SO e.g. NGA is Nigeria, GHA is Ghana, KEN = Kenya and so on. They perform fairly well compared to their home country IQ, both in Norway and Denmark. But Somalia does not and the performance of several MENAP immigrants is abysmal.
The scores on the Y axis are S factor scores for their performance in these countries. They are general factors extracted from measures of income, educational attainment, use of social benefits, crime and the like. The S scores correlate .77 between the countries. For details, see the papers concerning the data:
- Kirkegaard, E. O. W. (2014). Crime, income, educational attainment and employment among immigrant groups in Norway and Finland. Open Differential Psychology. Retrieved from http://openpsych.net/ODP/2014/10/crime-income-educational-attainment-and-employment-among-immigrant-groups-in-norway-and-finland/
- Kirkegaard, E. O. W., & Fuerst, J. (2014). Educational attainment, income, use of social benefits, crime rate and the general socioeconomic factor among 70 immigrant groups in Denmark. Open Differential Psychology. Retrieved from http://openpsych.net/ODP/2014/05/educational-attainment-income-use-of-social-benefits-crime-rate-and-the-general-socioeconomic-factor-among-71-immmigrant-groups-in-denmark/
I did not use the scores from the papers, I redid the analysis. The code is posted below for those curious. The kirkegaard package is my personal package. It is on github. The megadataset file is on OSF.
library(pacman)
p_load(kirkegaard, ggplot2)

M = read_mega("Megadataset_v2.0e.csv")

DK = M[111:135] #fetch danish data
DK = DK[miss_case(DK) <= 4, ] #keep cases with 4 or fewer missing
DK = irmi(DK, noise = F) #impute the missing
DK.S = fa(DK) #factor analyze
DK_S_scores = data.frame(DK.S = as.vector(DK.S$scores) * -1) #save scores, reversed
rownames(DK_S_scores) = rownames(DK) #add rownames

M = merge_datasets(M, DK_S_scores, 1) #merge to mega

#plot
ggplot(M, aes(LV2012estimatedIQ, DK.S)) +
  geom_point() +
  geom_text(aes(label = rownames(M)), vjust = 1, alpha = .7) +
  geom_smooth(method = "lm", se = F)
ggsave("DK_S_IQ.png")


# Norway ------------------------------------------------------------------

NO_work = cbind(M["Norway.OutOfWork.2010Q2.men"], #for work data
                M["Norway.OutOfWork.2011Q2.men"],
                M["Norway.OutOfWork.2012Q2.men"],
                M["Norway.OutOfWork.2013Q2.men"],
                M["Norway.OutOfWork.2014Q2.men"],
                M["Norway.OutOfWork.2010Q2.women"],
                M["Norway.OutOfWork.2011Q2.women"],
                M["Norway.OutOfWork.2012Q2.women"],
                M["Norway.OutOfWork.2013Q2.women"],
                M["Norway.OutOfWork.2014Q2.women"])

NO_income = cbind(M["Norway.Income.index.2009"], #for income data
                  M["Norway.Income.index.2010"],
                  M["Norway.Income.index.2011"],
                  M["Norway.Income.index.2012"])

#make DF
NO = cbind(M["NorwayViolentCrimeAdjustedOddsRatioSkardhamar2014"],
           M["NorwayLarcenyAdjustedOddsRatioSkardhamar2014"],
           M["Norway.tertiary.edu.att.bigsamples.2013"])


#get 5 year means
NO["OutOfWork.2010to2014.men"] = apply(NO_work[1:5],1,mean,na.rm=T) #get means, ignore missing
NO["OutOfWork.2010to2014.women"] = apply(NO_work[6:10],1,mean,na.rm=T) #get means, ignore missing

#get means for income and add to DF
NO["Income.index.2009to2012"] = apply(NO_income,1,mean,na.rm=T) #get means, ignore missing

plot_miss(NO) #view is data missing?

NO = NO[miss_case(NO) <= 3, ] #keep those with 3 datapoints or fewer missing
NO = irmi(NO, noise = F) #impute the missing

NO_S = fa(NO) #factor analyze
NO_S_scores = data.frame(NO_S = as.vector(NO_S$scores) * -1) #save scores, reverse
rownames(NO_S_scores) = rownames(NO) #add rownames

M = merge_datasets(M, NO_S_scores, 1) #merge with mega

#plot
ggplot(M, aes(LV2012estimatedIQ, NO_S)) +
  geom_point() +
  geom_text(aes(label = rownames(M)), vjust = 1, alpha = .7) +
  geom_smooth(method = "lm", se = F)
ggsave("NO_S_IQ.png")

sum(!is.na(M$NO_S))
sum(!is.na(M$DK.S))

cor(M$NO_S, M$DK.S, use = "pair")

