There is a lot of research on the link between crime and cognitive ability. (For criminal outcomes, see the problems in my previous post.) E.g.
We linked longitudinal Swedish total population registers to study the association of general cognitive ability (intelligence) at age 18 (the Conscript Register, 1980–1993) with the incidence proportion of violent criminal convictions (the Crime Register, 1973–2009), among all men born in Sweden 1961–1975 (N = 700,514). Using probit regression, we controlled for measured childhood socioeconomic variables, and further employed sibling comparisons (family pedigree data from the Multi-Generation Register) to adjust for shared familial characteristics.
Cognitive ability in early adulthood was inversely associated to having been convicted of a violent crime (β = −0.19, 95% CI: −0.19; −0.18), the association remained when adjusting for childhood socioeconomic factors (β = −0.18, 95% CI: −0.18; −0.17). The association was somewhat lower within half-brothers raised apart (β = −0.16, 95% CI: −0.18; −0.14), within half-brothers raised together (β = −0.13, 95% CI: (−0.15; −0.11), and lower still in full-brother pairs (β = −0.10, 95% CI: −0.11; −0.09). The attenuation among half-brothers raised together and full brothers was too strong to be attributed solely to attenuation from measurement error.

I note that the reduction in the link between siblings is in line with cognitive ability being confounded with other traits that influence crime such as self-control. This idea was also suggested by Peter Frost.
The current study contributes to this literature by examining the functional form of the IQ-offending association in a total birth cohort of Finnish males born in 1987. Criminal offending was measured with nine different indicators from official records and intelligence was measured using three subscales (verbal, mathematical, and spatial reasoning) as well as a composite measure. The results show consistent evidence of mostly linear patterns, with some indication of curvilinear associations at the very lowest and the very highest ranges of intellectual ability.
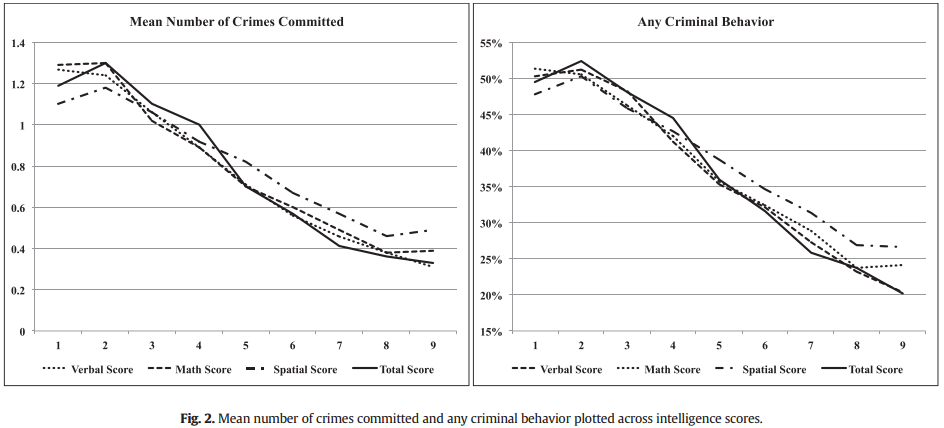
I note that this study did have crime by type and could have analyzed for a general factor, but did not. I also don’t see any numeric values for the strength of the relationships in the article, but one could derive estimates from the reported statistics, I think. E.g. their Table 1 gives the SD of number of crimes committed as 2.67. Assuming the pattern is entirely linear (close approximation), we can take the value of the highest and lowest groups and see how far they are apart in SD on both variables and divide these to get the individual-level correlation. In this case, mean crime by lowest 9-tile is 1.19 and for highest is 0.33 (found in Table A4 at the end). So for crime the d for lowest vs. highest is (1.19-0.33)/2.67=0.32. Their d for cognitive ability is about (9-1)/2.18=3.67. Then we divide and get 0.32/3.67=0.09, the estimated correlation.
Since this is too small (expected value around 0.20), there is probably some bias in these estimates. For one thing, the number of crimes does not follow a normal distribution so using means and SDs is misleading. One should use medians and MADs (robust alternatives). SDs are very sensitive to outliers because they are based on squared values (a common feature of all methods based on squared values such as OLS regression [which minimizes the mean squared error]). Because we divide by the crime SD, this makes the estimated correlation too small. As a quick test of this idea, I simulated some power low distributed data in R (rlnorm) and calculated the SD and MAD: 2.20 and 0.88 (using the default values for simulating data). We see that the MAD is much smaller. We can use this for a quick and dirty re-estimate for the above using the ratio of the SD and MAD, which is 0.88/2.20=0.40. So: 0.32/(3.67*0.40)=0.22, which is in the right ballpark, but still based on means, not medians. Based on some more playing around, it seems that using medians increases the d value by about 70% compared to medians, which would reduce the above estimate of 0.22. However, I cannot calculate how much because they do not give the medians by group. I don’t know. Maybe trying to use normal distribution statistics to estimate a correlation for obviously non-normal data is not a good idea, even if one does use the robust versions. :p
See also: Dull minds and criminal acts
The study I want done and my predictions
What I want to do is something like this:
- Get a very large dataset that includes criminal records/self-reports on different types of crimes and relevant predictors such as cognitive ability, gender, age and mental illness. In writing this post, I was specifically thinking of the dataset that Amir Sariaslan (RG, Twitter) usually works with. Self-report is better because it has less 0’s. Most crimes are not caught and punished, which means that most cells in the dataset get filled up with 0’s. These bias the correlations downwards.
- Factor analyze the criminal outcomes at the individual-level using latent correlations. Then score the cases using IRT.
- Model the relationship between the predictors and the crime scores.
- Use Jensen’s method to assess whether the predictor-outcome relationships can plausible be attributed to a general factor or other variance.
I believe in making predictions before seeing the data, preferably numeric predictions. I wish to make the following public predictions in case someone does such a study.
- There will be a general crime factor (GCF?) at the individual-level just as there was at the aggregate level in my prior S factor study of London boroughs (~districts).
- The Jensen coefficients with cognitive ability, gender and heritability will be positive, i.e. the crimes that load stronger on GCF will have stronger relationships to the predictors. I don’t know about the age predictor. For mental illness I think it will depend on the type of mental illness. E.g. ASPD will show the effect, but perhaps not major (unipolar) depression.
- Violent crimes will have stronger loadings than non-violent crime.
- The distribution of GCF scores will follow a power law distribution.
- There will be clear population differences in the parameters of the power law fit by origin/ethnic groups in such a way as to influence the central tendency. Groups interest include native Swedes (and/or other Scandinavians/Nordics), Muslim immigrants, EU-immigrants; country of origin groups too if one has enough data to look at these.
- GCF will be positively associated with the extremism of religious beliefs among Muslims (cultural conflict theory). For more on the general religiousness factor, see this prior post.