I have only been able to find one fairly detailed dataset of immigrant performance in the Netherlands (covered in this study). It found the usual things, but with much uncertainty because the numbers were old (fewer immigrants back then → sampling error), covered a single year only (sampling error) and there was only one kind of outcome, crime.
It has been a while since I looked for Dutch data. Today I took a very quick view because I’m going to try to purchase some detailed data to work with. On their website I found Annual Report on Integration 2016, so presumably there is one for every year. It’s in English and there’s a more comprehensive Dutch version too. Unfortunately, it does not cover more countries. [We also have one like that in Denmark, Indvandrere i Danmark 2016 (Immigrants in Denmark).] The report has a number of interesting figures, which unfortunately only cover a few select countries of origin. Here they are:


Comments
Some comments, James Thompson style:
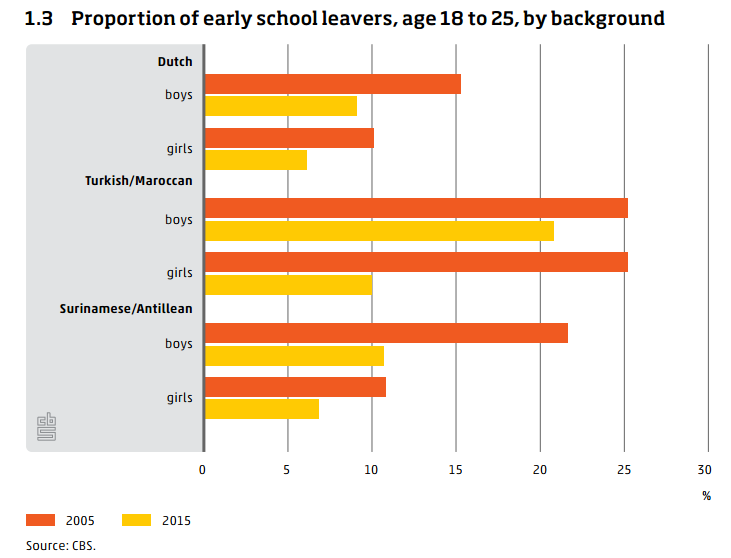
- There was a large improvement in school outcomes for Latin American (Suriname/Antillean) and Muslim (Turkish/Moroccan) girls (figure 1.3). Early school leavers was reduced by 60% among the Muslim girls!
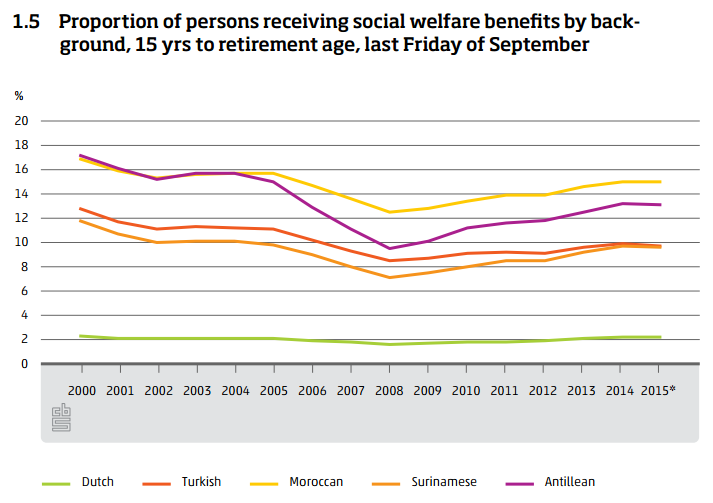
- However, these huge improvements were not reflected in the labor statistics (table 1.5), but there was has been some progress there too: 17% to 14% for the Latin Americans and 12% to 10% for the Muslims, for the use of welfare statistic.
- The income statistics (figure 1.6) has a fairly low value for Bulgarians. But note that these data are not adjusted for age. East Europeans often come as cheap labor for low level work, but work their their way up as they age. The new Muslim groups from Somalia, Iran, Iraq and Afghanistan also have low incomes.
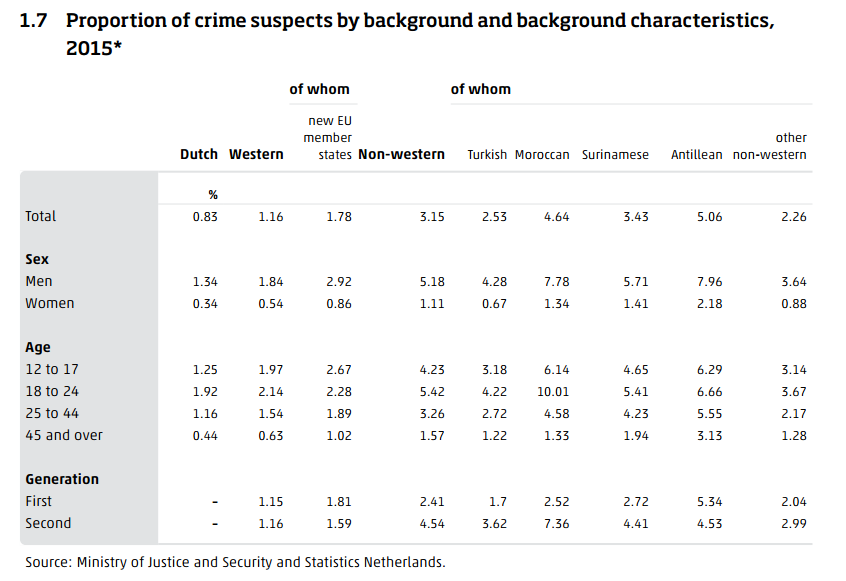
- Crime statistics in table 1.7 are not adjusted for sex, but they are adjusted for age. They show very large relative rates in relation to the Dutch. This was also found in my study. The numbers are for suspects of crime, however, so one could claim police bias against them — police are biased against them and spend too much time with the wrong suspects that the courts later acquit. Or one could claim court bias in their favor — police have the right targets, but the courts set extra high evidence requirements. Both are equally consistent with these data. Second generation are more criminal than the first. But these are not adjusted for age and obviously the second general are younger.
- Health (table 1.8): Muslims do not appear to age well. The health gaps become larger with age. Alternatively, these reflect the fact that the older immigrants spent a larger fraction of their lives in their origin countries, and also their early lives.
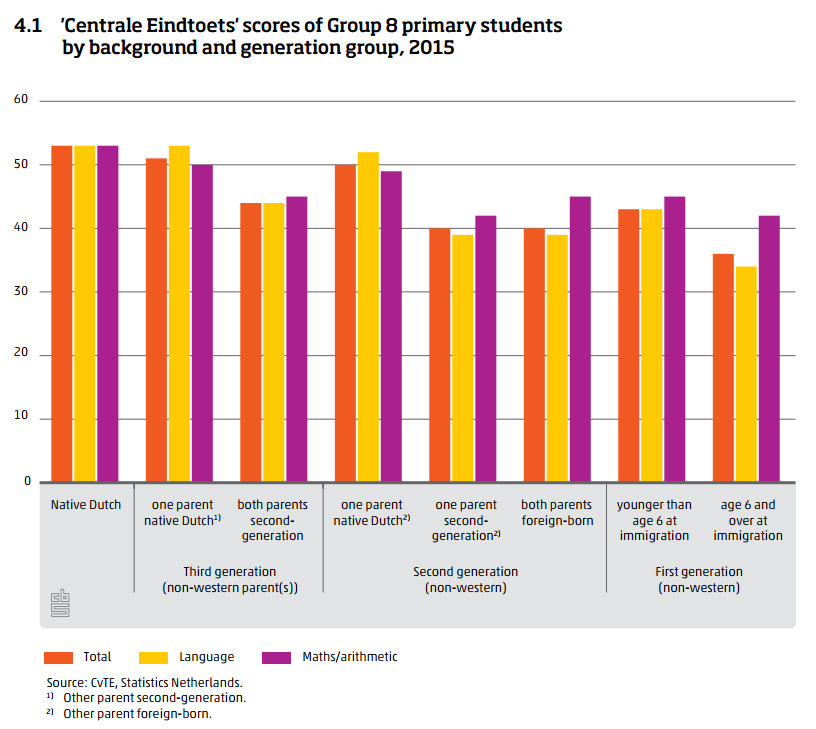
- School scores (figure 4.1): these are interesting, but unfortunately, not very detailed. We have previously used some CITO scores, so perhaps these are the same. I googled this test and a few names of Dutch provinces, and using the Google special search, Google supplied me with a dataset of test scores and matching data from what appears to be 7,100 Dutch schools. Wow! The column ‘gemeente’ (town/municipal) has about 400 unique values, these match up the municipals, of which there are 393.