One can find quite a lot of popular articles on the topic:
- https://newrepublic.com/article/139700/democrats-party-science-not-really
- http://reason.com/reasontv/2016/07/15/are-republicans-or-democrats-more-anti-s
- https://www.theguardian.com/environment/climate-consensus-97-per-cent/2016/apr/28/can-the-republican-party-solve-its-science-denial-problem
- http://www.pewinternet.org/2016/10/04/the-politics-of-climate/
- http://www.rollingstone.com/politics/features/why-republicans-still-reject-the-science-of-global-warming-w448023
- http://www.politico.com/magazine/story/2014/06/democrats-have-a-problem-with-science-too-107270
- https://www.city-journal.org/html/real-war-science-14782.html
- http://www.motherjones.com/environment/2014/09/left-science-gmo-vaccines
with wildly diverging conclusions. So what is true? It at these times that we want to take a look at the raw data ourselves. Fortunately, The Audacious Epigone did some legwork for us:
| Item | Rep% | Dem% | Rep. Adv. %points | Field |
| Astrology is not scientific | 72.7 | 61.3 | 11.4 | Astronomy |
| Father, not mother, determines a child’s sex | 76.2 | 69.4 | 6.8 | Genetics |
| Continental drift has and continues to occur | 86.5 | 90.2 | -3.7 | Geology |
| The earth revolves around the sun | 81.1 | 76.4 | 4.7 | Astronomy |
| Electrons are smaller than atoms | 70.7 | 68.7 | 2 | Physics |
| Humans evolved from other animals | 39.9 | 57.8 | -17.9 | Biology |
| Understands the need for control groups in testing | 82.3 | 80.3 | 2 | General |
| The earth’s core is very hot | 95.3 | 93.3 | 2 | Geology |
| Lasers are not made by condensing sound waves | 73.2 | 61.1 | 12.1 | Physics |
| Demonstrates a basic understanding of probability | 92.5 | 86.1 | 6.4 | Math |
| Demonstrates a modestly more advanced understanding of probability | 80.6 | 76 | 4.6 | Math |
| Not all radioactivity is man-made | 87.3 | 77 | 10.3 | Physics |
| It takes the earth one year to rotate around the sun | 78 | 74.1 | 3.9 | Astronomy |
| Antibiotics do not kill viruses | 65 | 51.2 | 13.8 | Medicine |
| Respondent does not refuse to eat genetically modified foods (2006) | 72.6 | 61.4 | 11.2 | Genetics |
| Genetics play a substantial role in determining personality (2004) | 25.1 | 26 | -0.9 | Behavioral genetics |
| Not all radioactivity is fatal to humans (2000) | 76 | 67.2 | 8.8 | Physics |
| The greenhouse effect is caused by a hole in the earth’s atmosphere (2000) | 38.7 | 42.7 | -4 | Climate science |
| The use of coal and oil contributes to the greenhouse effect (2000) | 68.5 | 74.8 | -6.3 | Climate science |
| Polar ice caps have shrunk over the last 25 years (2006, 2010) | 93.4 | 91.8 | 1.6 | Climate science |
| The north pole is on a sheet of ice (2006, 2010) | 57.6 | 67.7 | -10.1 | Climate science |
| Demonstrates a basic understanding of nanotechnology (2006, 2008, 2010) | 86.5 | 88.4 | -1.9 | Nano science |
| Demonstrates a modestly more advanced understanding of nanotechnology (2006, 2008, 2010) | 77.4 | 79.3 | -1.9 | Nano science |
| It is not perpetually dark at the south pole (2006, 2010) | 89 | 86.2 | 2.8 | Geology? |
| Not all artificial chemicals cause cancer (2000) | 53.9 | 51.5 | 2.4 | Medicine |
| Understands that non-GMO tomatoes still have genetic material (2010) | 73.4 | 64.6 | 8.8 | Genetics |
The side with the most gets the boldface. He does a crude count and finds a score of 18-8. The data is based on various waves of GSS, so it should be quite good in terms of sampling.
Since my tweet with these is popular on Twitter
it seems like a good idea that I should say a few critical words on the method.
First, not all items are present in all waves, some are present in only a single wave. This means that we cannot calculate a full correlation matrix directly. We could estimate it based on the observed correlations + some assumptions (see our method in the Argentina Admixture project). Without a full correlation matrix, it’s not easy to calculate scores at the person-level across all waves. Perhaps one should just adopt a simple scoring model: give 1 point for every correct answer, then divide by the number of items. Do this for all waves, and aggregate. Slightly more sophisticated is weighing the items by their difficulty: it counts as more to get a hard item right than an easy item. Note that this is essentially what IRT does (along with other things), so we are just mimicking a proper IRT analysis.
Second, we should take into account the size of the gaps on the items (a continuous measure), not just which side has superiority (a dichotomous measure). It’s possible that one side just a lot of items right with minor advantages (e.g. 1-3%), and the other side got the remainder with a substantial advantage (>10%). It can be done on the above data simply by summing the advantages for one side, and taking the mean. Using the Republicans, the number turns out to be 2.65%points, i.e. across the items, Republicans get an average of 2.65%points more correct. Quite small. It’s not easy to estimate a confidence interval using this method, so I don’t know how certain we are about this small advantage.
Third, is that we should not assume that all items measure the construct of interest, scientific knowledge, with equal accuracy (akin to a factor loading, discrimination in IRT terms). Unfortunately, estimating the item discriminations requires a full correlation matrix.
Fourth, the item sampling is questionable; many areas of science were not covered (e.g. linguistics, sociology, musicology, chemistry). Given that there are patterns in which kinds of science are denied by each side, one can sample items in such a way to make any side/group superior. This is the same issue as with sex differences in cognitive ability, where spatial and chronometric tests are not often used, but shows advantages for men. In a perfect scenario, we would sample items at random from all possible items pertaining to scientific knowledge. In the real world, it’s not even easy to delimit what constitutes scientific knowledge, and it’s not clear how we should sample items. Do all bona fide fields count equally for the purpose of sampling? How do we decide on what is a field and what is a subfield etc.? It’s not an easy task! However, along with a few others, we are working on a new public domain scientific knowledge test with very broad sampling of items from the sciences. The plan is then to give this to a large broad sample and see what we get. Furthermore, akin to the ICAR5, we want to create briefer versions based on the full test performance. The currently popular tests tend to oversample physics and astronomy, which may have some effect on the results, especially for sex differences.
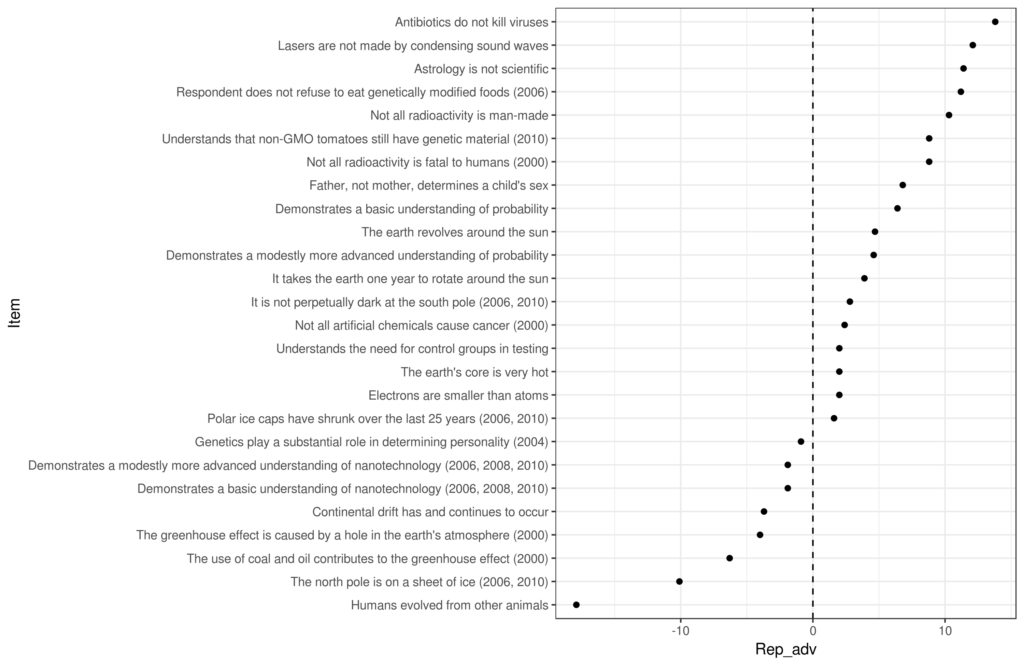
Ok, so I did a little extra: http://rpubs.com/EmilOWK/GSS_science_simple_2017
Here’s the basic plot, sorted by Republican advantage
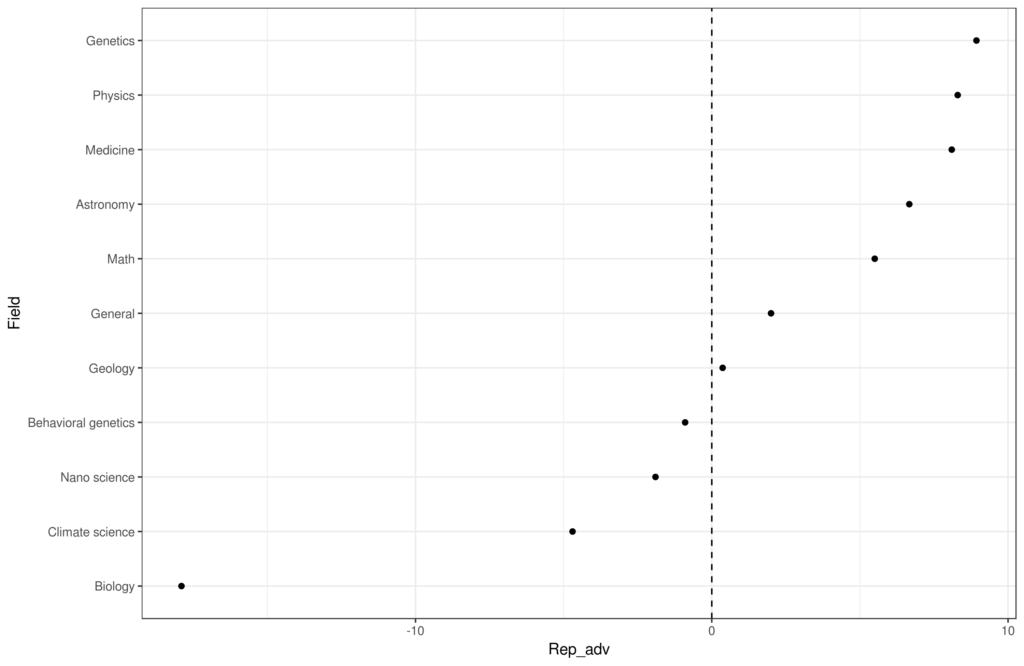
Then I coded the fields, and aggregated:
Note: the original version of The Audacious Epigone’s post had an error, which has now been fixed. The above results are from the fixed version. The fix relates to the scoring on the item with greenhouse gas and ozone layer.


