- Mehta, C. M., Malins, J. G., Noble, K. G., & Gruen, J. R. (2017). Cortical area and subcortical volume mediate the effect of parental education and adverse experiences on cognitive performance in youth. bioRxiv, 160424.
Remember “poverty shrinks the brain from birth”? From birth! Fast acting that poverty, actually before birth too. Anyway, Kimberly Noble is back with another noble attempt:
Early adversity and socioeconomic disadvantage are risk factors associated with diminished cognitive outcomes during development. Recent studies also provide evidence that upbringings characterized by stressful experiences and markers of disadvantage during childhood, such as lower parental education or household income, are associated with variation in brain structure. Although disadvantage often confers adversity, these are distinct risk factors whose differential influences on neurodevelopment and neurocognitive outcomes are not well characterized. We examined pathways linking parental education, adverse experiences, brain structure, and cognitive performances through an analysis of 1,413 typically-developing youth, ages 8 through 21, in the Philadelphia Neurodevelopmental Cohort. Parental education and adverse experiences had unique associations with cortical surface area and subcortical volume as well as cognitive performance across several domains. Associations between parental education and several cognitive tasks were explained, in part, by variation in cortical surface area. In contrast, associations between adversity and cognitive tasks were explained primarily by variation in subcortical volume. A composite neurodevelopmental factor derived from principal component analysis of cortical thickness, cortical surface area, and subcortical volume mediated independent associations between both parental education and adverse experiences with reading, geometric reasoning, verbal reasoning, attention, and emotional differentiation tasks. Our analysis provides novel evidence that socioeconomic disadvantage and adversity influence neurodevelopmental pathways associated with cognitive outcomes through independent mechanisms.
Sounds benign? Discrimination and parental education causes is associated with brain size metrics and cognitive test scores. She’s mining the MRI subsample of the PNC (aka. TCP) new insights. Authors conclude:
Our results do not necessarily imply causal relationships between PE, AE, brain structure, and cognitive skills. First, PE is a distal marker for environmental factors such as nutrition, toxins, lack of caregiver support, learning impairments such as dyslexia or attention disorders that are linked to genetics, and fewer opportunities for cognitive enrichment that were not assessed in the present sample [ 1 , 2 ]. Similarly, it is unlikely that (a) all types of AE have equal effects on neurocognitive development and (b) all individuals accurately report whether they have undergone an AE. Further investigations incorporating more complete descriptions of adverse experiences may provide greater insight into their influences on neurocognitive development in relation to SES.
Our study contributes to a growing literature on the role played by brain structure and physiology in explaining associations between environmental factors and cognition among youth [ 3 , 46 ]. If disadvantage and adversity have unique implications for neurocognitive development, as our results suggest, then remediation is likely to be more effective at improving educational outcomes when targeted to specific risk profiles. Devising targeted early intervention strategies would help achieve the public policy goal of reducing effects of socioeconomic disparities on academic achievement among youth [47].
Sounds perfectly normal, only a bare mention of genetic confounding (sort of) in a previous sentence, and some references to “genetic ancestry” as a covariate. What do the results show?
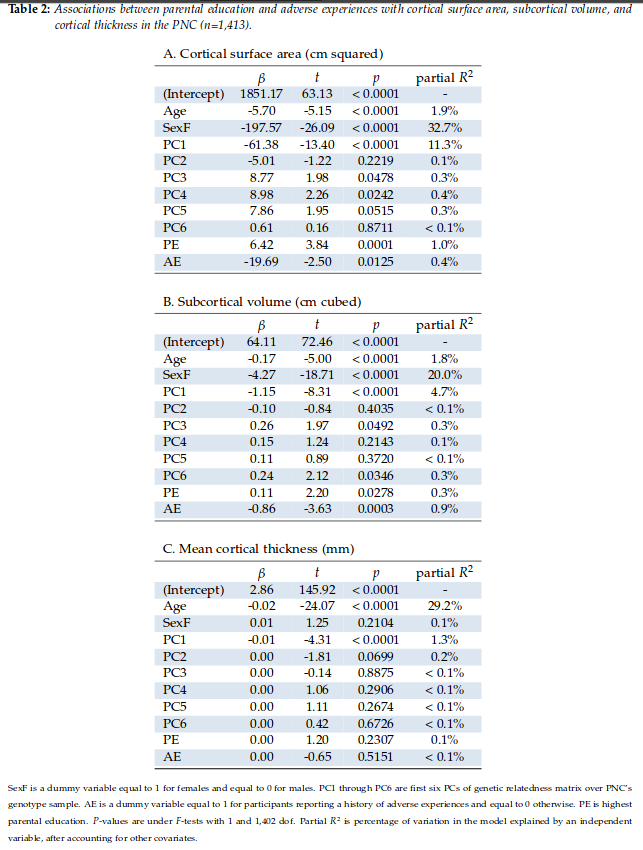
Alright, so the PC1-6 are genetic ancestry covariates. Along with sex, PC1 sure does predict a lot of variance in first 2 brain measures and has negative coefficients. But what does it mean? Tell me what does it mean. Well, the authors are nice enough to report the distributions of the ancestry components in their supplementary materials. Looks like this:
Right, so looking at PC1, we see that populations called AFR-1KG and AA-PNC have really high values for this and not so much the other populations. Reading more around, we realize these are both African groups, so PC1 essentially measures Africanness in the genomic space. So, it means that authors are nice enough to hide the inconvenient finding that African ancestry predicts smaller brains, controlling for adverse events and parental education. In terms of relative effect sizes, African ancestry was 11.3/0.4=28 times more important than adverse events for predicting cortical surface area, and 5.2 times more important for predicting subcortical volume.


