- Dworak, E. M., Revelle, W., & Condon, D. M. (2023). Looking for Flynn effects in a recent online US adult sample: Examining shifts within the SAPA Project. Intelligence, 98, 101734.
Compared to European countries, research is limited regarding if the Flynn effect, or its reversal, is a current phenomenon in the United States. Though recent research on the United States suggests that a Flynn effect could still be present, or partially present, among child and adolescent samples, few studies have explored differences of cognitive ability scores among US adults. Thirteen years of cross-sectional data from a subsample of adults (n = 394,378) were obtained from the Synthetic Aperture Personality Assessment Project (SAPA Project) to examine if cognitive ability scores changed within the United States from 2006 to 2018. Responses to an overlapping set of 35 (collected 2006–2018) and 60 (collected 2011–2018) items from the open-source multiple choice intelligence assessment International Cognitive Ability Resource (ICAR) were used to examine the trends in standardized average composite cognitive ability scores and domain scores of matrix reasoning, letter and number series, verbal reasoning, and three-dimensional rotation. Composite ability scores from 35 items and domain scores (matrix reasoning; letter and number series) showed a pattern consistent with a reversed Flynn effect from 2006 to 2018 when stratified across age, education, or gender. Slopes for verbal reasoning scores, however, failed to meet or exceed an annual threshold of |0.02| SD. A reversed Flynn effect was also present from 2011 to 2018 for composite ability scores from 60 items across age, education, and gender. Despite declining scores across age and demographics in other domains of cognitive ability, three-dimensional rotation scores showed evidence of a Flynn effect with the largest slopes occurring across age stratified regressions.
I already tweeted about this problem, but apparently the study got very popular so it’s worth writing about it too. In fact, even IFLS wrote about it — the meme becomes reality:

Here’s the main plot that people are talking about:
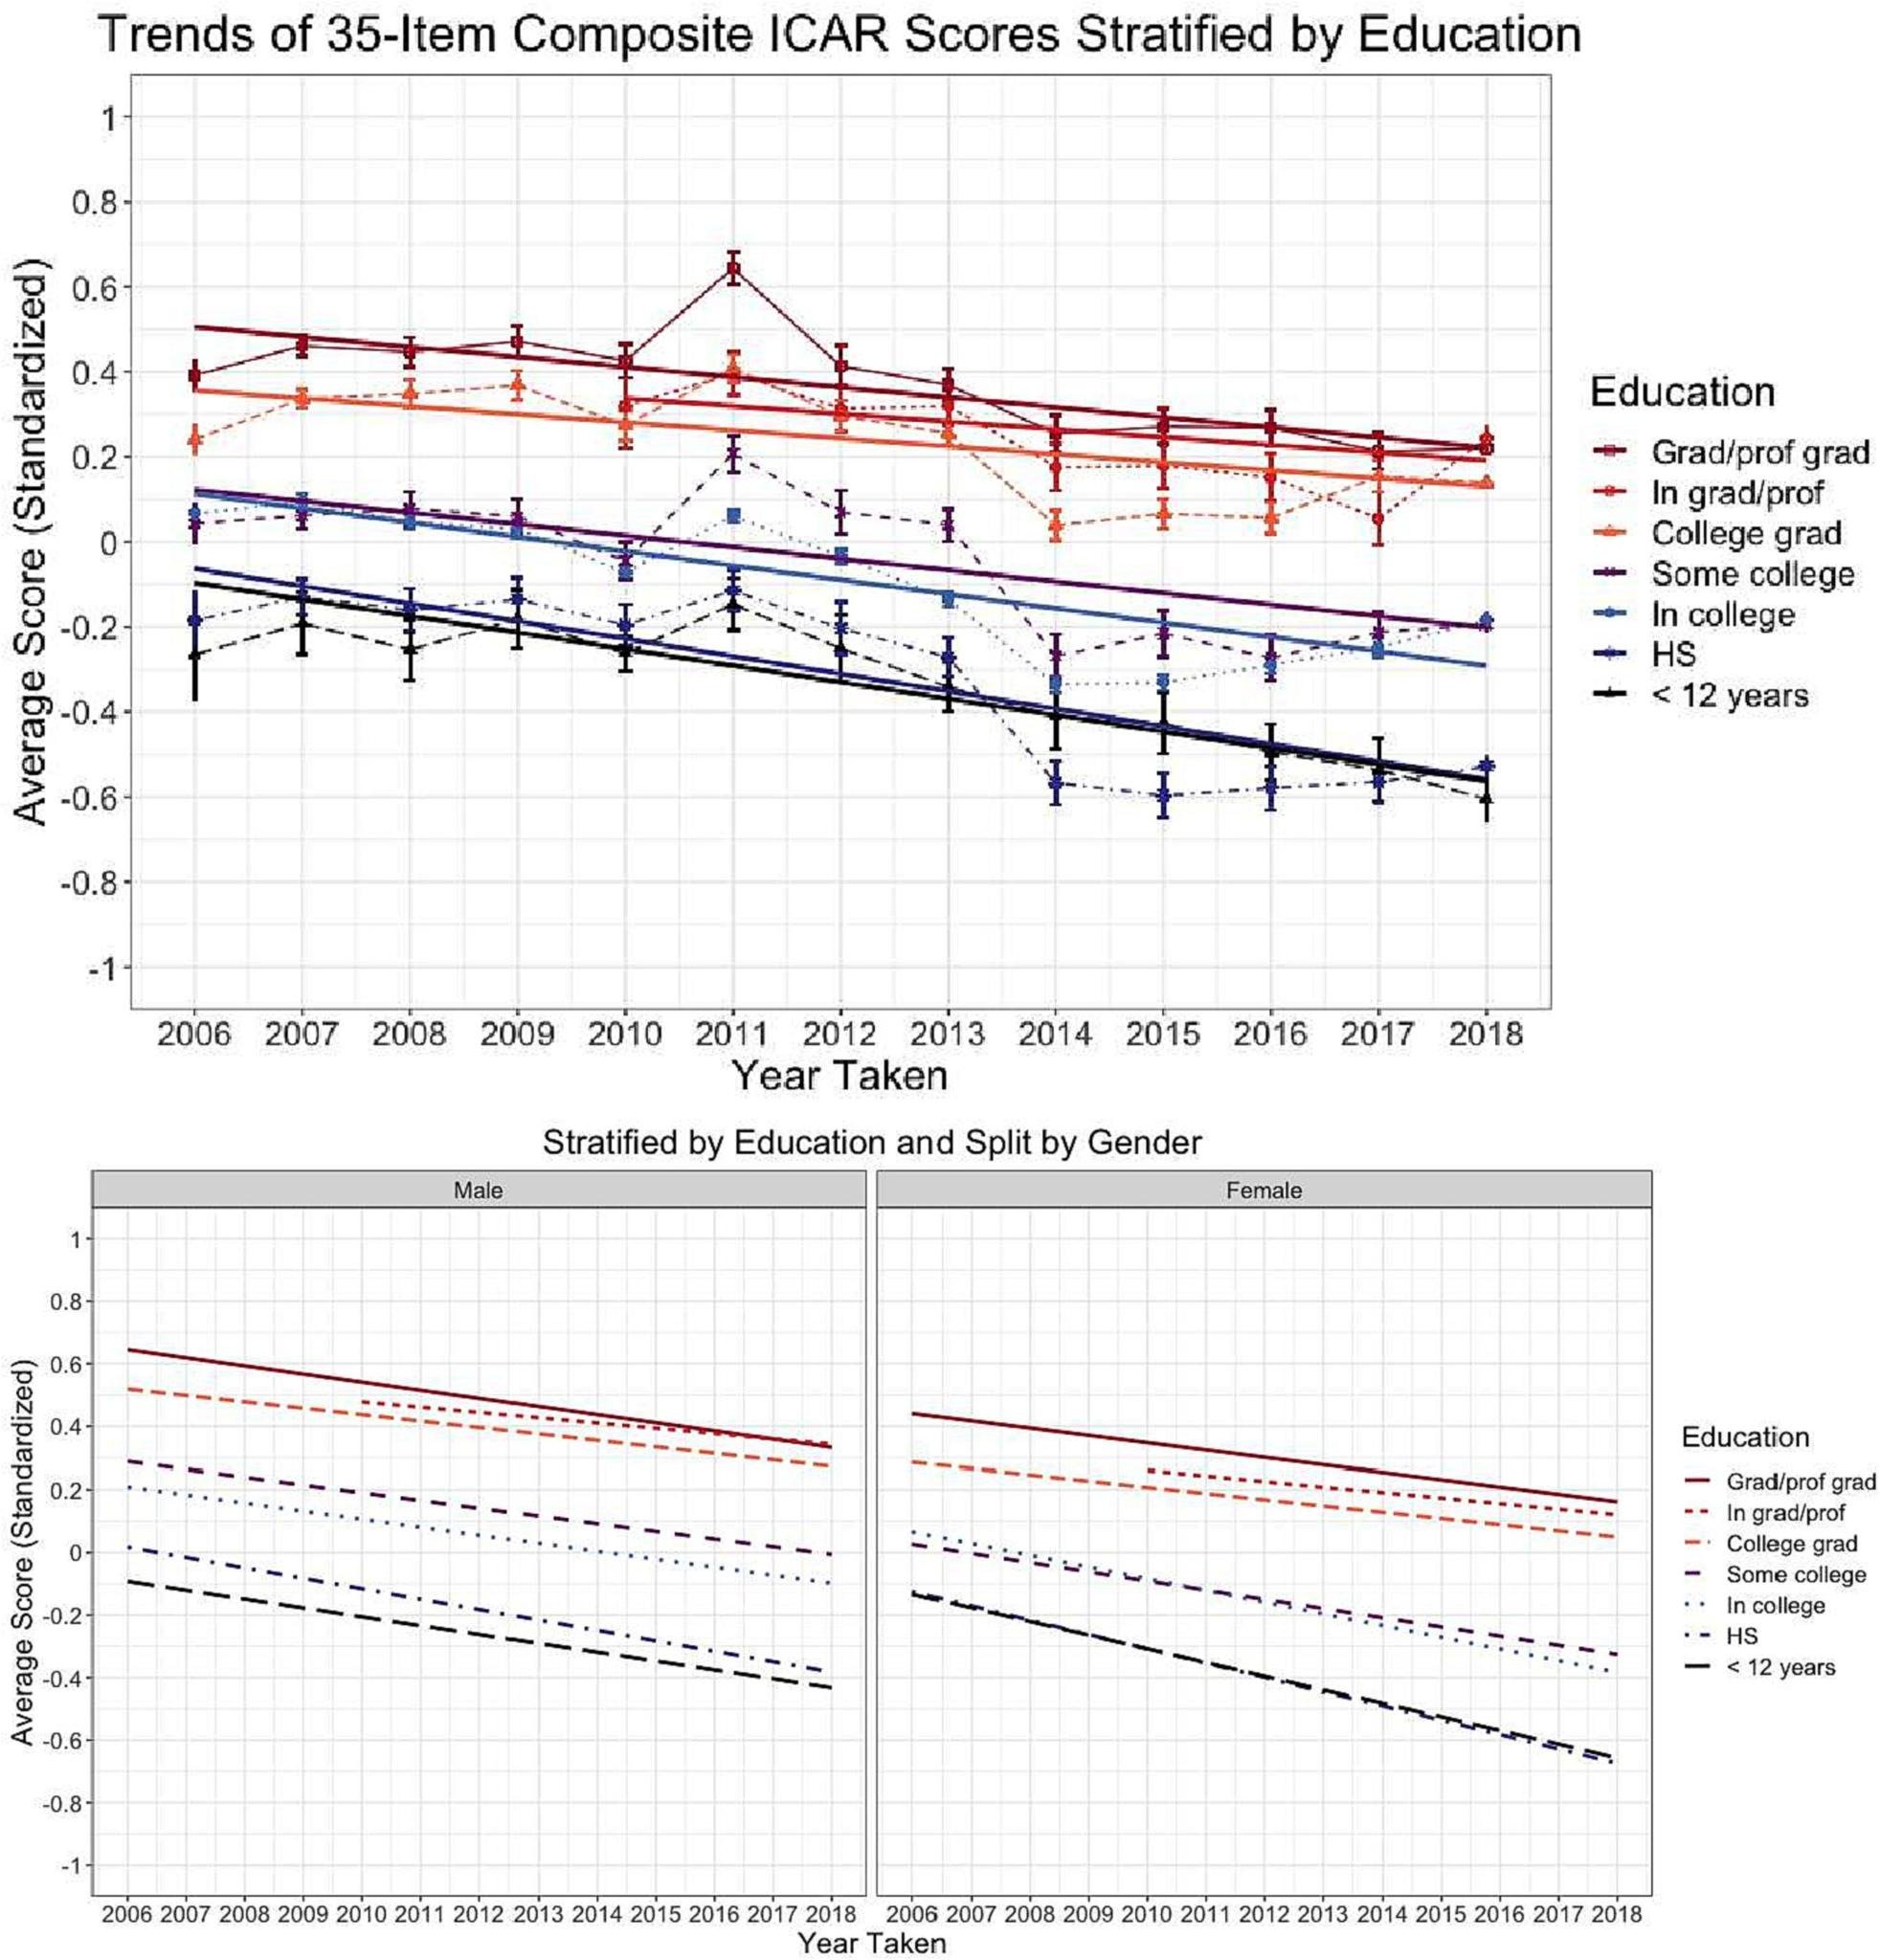
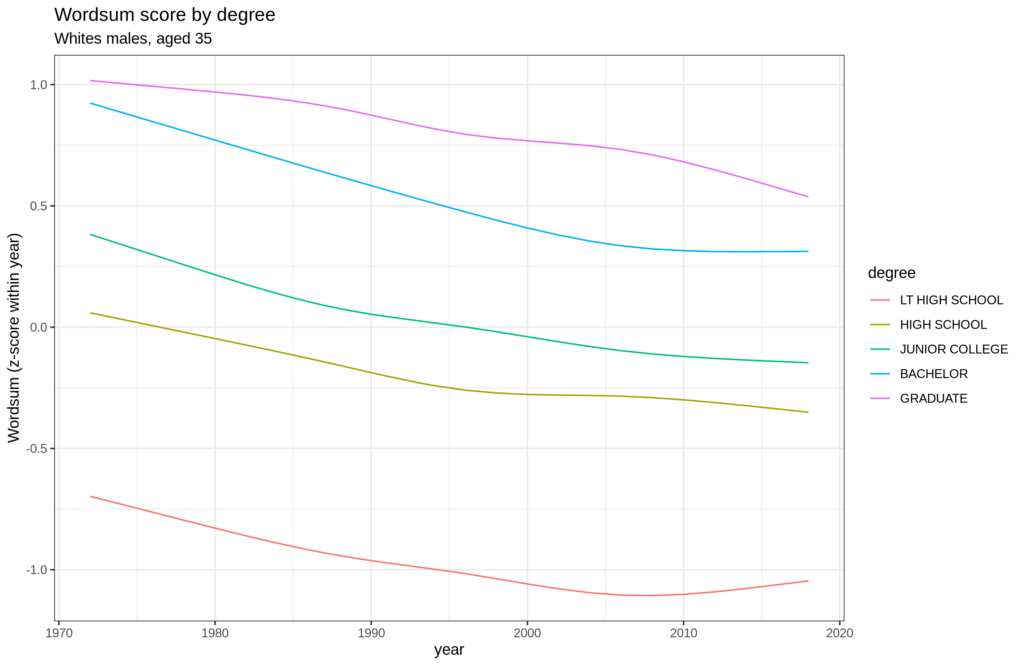
So, the scores on ICAR, a public domain intelligence test, are declining within every educational group. So they must be declining overall right? No. That’s a fallacy akin to Simpson’s paradox. The problem here is that the educational groups’ composition are changing over time. Everybody is finishing more degrees, this moves people upwards in the system, decreasing the mean score of each group. If we continued this to the end, then 100% of the population would have graduate degrees and their IQ mean would be 100, and the other groups would decrease to below 100 IQ and finally disappear entirely. In 2021, I showed this pattern can also be seen in the Wordsum test using the GSS:
So the study needs to not plot the changes by education. There isn’t such a plot in the paper, but the supplementary tables include the regression model:
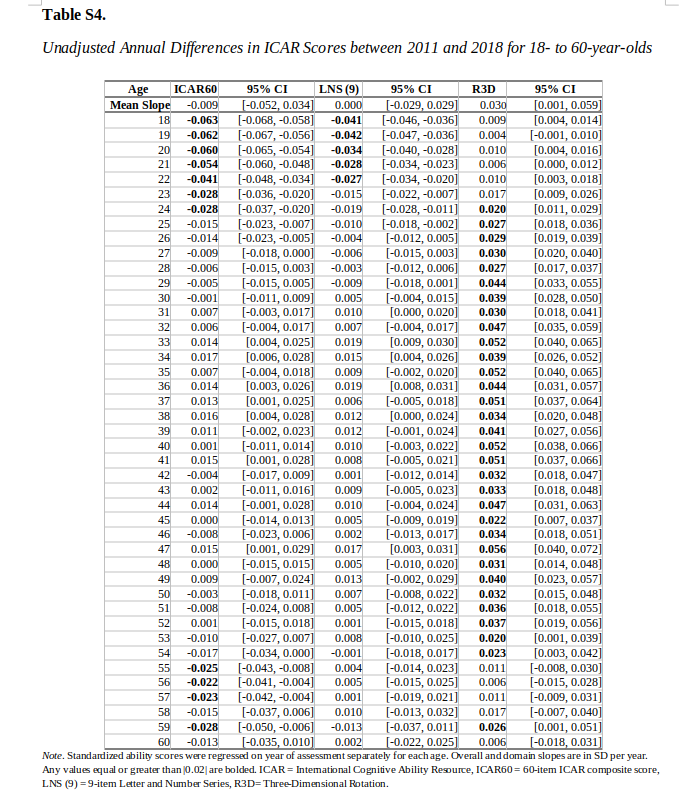
Most of the values are now p > .05 (not beyond chance) despite the massive sample size. There is some decline to be seen for people aged 24 and below, and some for 55 and above. And that’s looking at the total scores, the best measure of g — general intelligence. Interestingly, their spatial test (R3D column) shows steady gains, who knows why that is. People getting more patient in the age of Tiktok? It’s not entirely absurd:
- Protzko, J. (2020). Kids These Days! Increasing delay of gratification ability over the past 50 years in children. Intelligence, 80, 101451.
Have children’s ability to delay gratification decreased since the past? We analyze the past 50 years of data on the Marshmallow test of delay of gratification; where children must wait to get two preferred treats of their choosing; if they cannot wait, they only get one. Here we provide comprehensive evidence on whether children’s ability to delay gratification has truly been decreasing, as theories of technology or a culture of instant gratification have predicted. Before analyzing the data, we polled 260 experts in cognitive development, 84% of who believed children are getting worse or are no different than those of the past. Contrary to this prediction, we show delay of gratification times are increasing over the past 50 years, corresponding to a fifth of a standard deviation increase in ability per decade. This mirrors the magnitude of secular gains in IQ seen over decades.
The reason why patience is important for the spatial tests is that these take quite a bit of time to solve compared to the other items. Here’s an example:
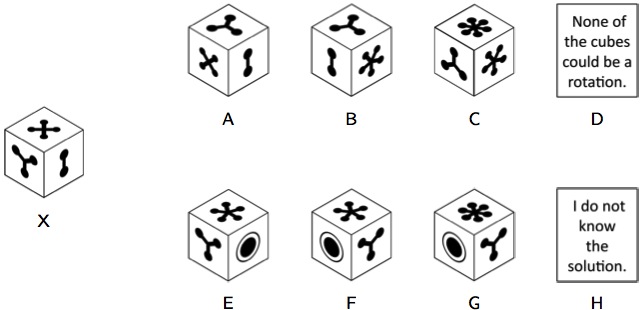
You have to rotate the cube on the left and figure out which, if any, of the cubes on the right it could be. Try! It takes a while. I’ve tried using these items in survey research but they cost too much because they take too long to administer. It’s more efficient to measure intelligence by giving people 5-10 vocabulary or general knowledge questions rather than one spatial 3D spatial rotation question.
The second problem with inferring any secular declines in intelligence scores from the new study is that it is entirely based on online volunteers:
Using a set of public-domain cognitive ability measures, the present study aims to investigate the evidence for differences in cognitive ability scores in the United States between 2006 and 2018. We used 13 years of cross-sectional data from the Synthetic Aperture Personality Assessment Project (SAPA Project; Condon and Revelle, 2016; Revelle et al., 2017), a free web-based survey, to test if there was a Flynn effect for adult participants. Starting in 2006, 35 ability items, that would become part of the International Cognitive Ability Resource (ICAR; Condon and Revelle, 2014, Condon and Revelle, 2016; Dworak, Revelle, Doebler, and Condon, 2021; Revelle, Dworak, and Condon, 2020), were administered. These items were used to form a composite cognitive ability score or domain scores for matrix reasoning (11 items), letter and number series (8 items), and verbal reasoning (16 items). Starting in 2011 an additional item for letter and number series and 24 three-dimensional rotation items began to be administered, with the original items, to allow for a 60-item composite score. Unlike previous Flynn effect studies, participants were disproportionately female identifying (65.03%) and between the ages of 18 and 90.
It’s this website https://www.sapa-project.org/ where you can start their super survey:
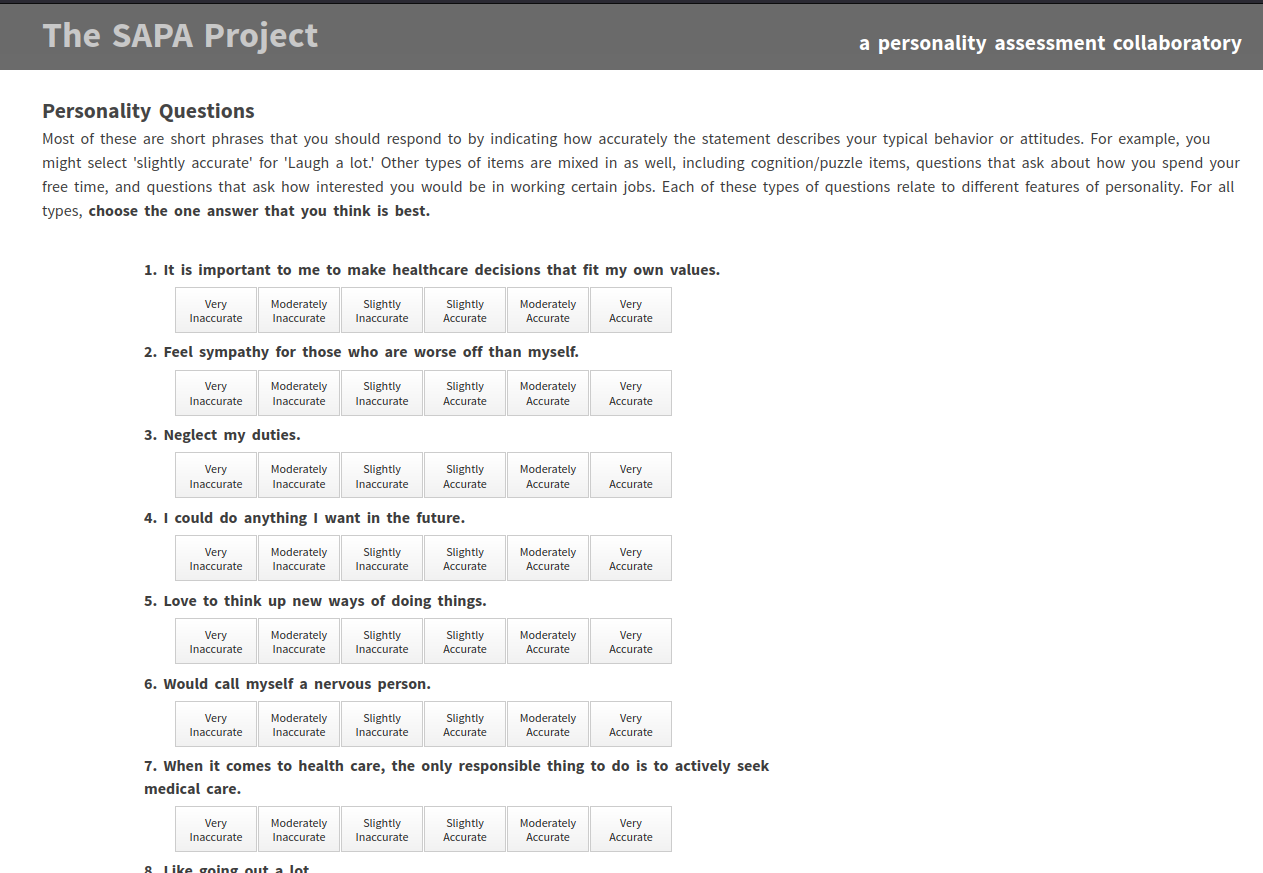
But aren’t all of these personality questions? Where did they get intelligence from? Actually, the genius of their approach is to administer items completely at random to each person. This results in all items being given together some of the time without missing data bias, thus giving you a sparse but unbiased correlation matrix. It’s a kind of planned missing data design, and when analyzed using specialized methods, can work for most things with structural equation modeling (SEM). Bill Revelle has many slides talking about this approach, as he’s the brain behind it (I think). Their intelligence test items are mixed in at random too, so when I scrolled down a bit there’s some:
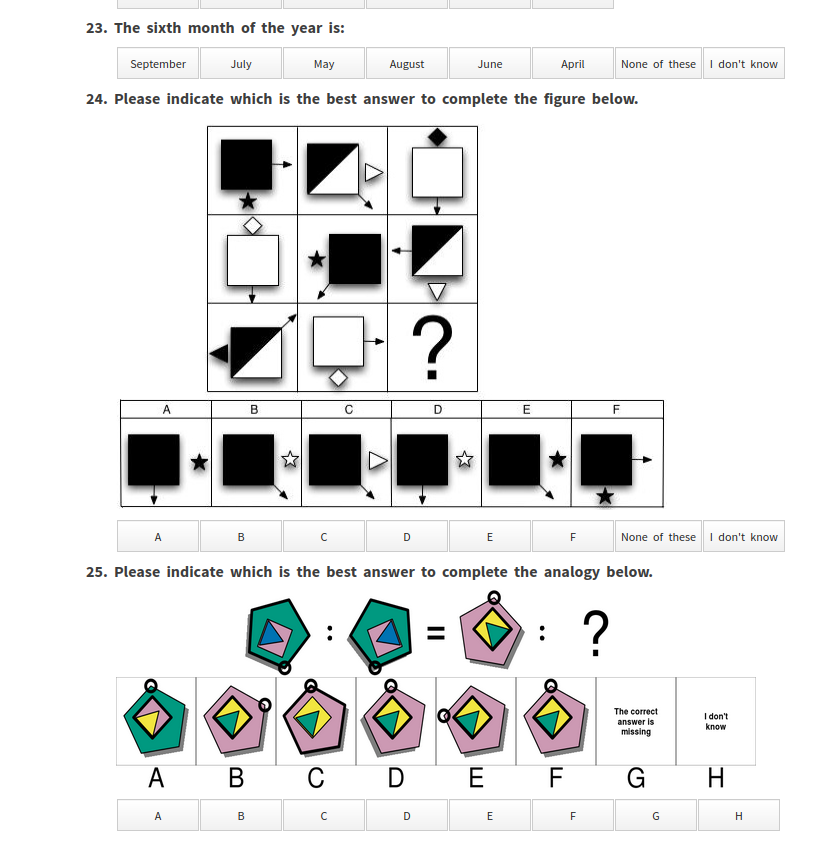
23 is a general knowledge item, 24 is a figure matrix item, and 25 is a figure analogy type item. If you kept answering their test for a while, you will be exposed to a lot of different item types, and the website will eventually tell you your scores on intelligence, personality, values and a lot of other stuff. But you need a bit of patience to get so far.
The third problem with the study is that there’s no control for race/ethnicity. Obviously, the West is changing to become less European, primarily due to Hispanic immigration. As Hispanic IQ is about 93, this causes a lowering over time in the cohorts where these people are, which will be mainly in the younger groups. This decline can then be offset by any Flynn effects, or patience effects (on the spatial test). So really, with these kinds of data one cannot really tell what is happening. This is an English language website, so as more and more people speak English, they will be increasingly taking this test. They analyzed only data from the USA, so these English as 2nd language people don’t bias the data, but immigration to USA does confound their findings.
The authors discuss the changing distribution of education, but seems to have missed the implication of this for their findings:
As the present study explored the differences in scores across levels of educational attainment and the highest level of education has increased across the testing period of the SAPA Project sample, our results suggest the causal hypothesis that exposure to education accounts for the direction and strength of the Flynn effect (Bratsberg and Rogeberg, 2018; Pietschnig and Voracek, 2015) was not observed within this sample. Rather, exposure to education may only be protective for certain age groups. Not only did the present study find that the steepest negative slopes of composite or domain scores occurred for individuals with less than a 4-year college degree, the largest differences for age stratified regressions after controlling for educational attainment were exhibited for those between the ages of 18 and 22. While these findings complement previous research with 18- to 20-year-old conscripts (Bratsberg and Rogeberg, 2018; Dutton and Lynn, 2013; Sundet et al., 2004; Teasdale and Owen, 2008) and a subsample of 18-year-old study participants within United States (Platt et al., 2019), exposure to education has not been able to explain the differential gains and declines across fluid and crystallized IQ scores observed in previous research (Pietschnig and Voracek, 2015). However, it could be the case that our results indicate a change of quality or content of education and test-taking skills within this large United States sample. As scores were lower for more recent participants across all levels of education, this might suggest that either the caliber of education has decreased across this study’s sample and/or that there has been a shift in the perceived value of certain cognitive skills (Clark et al., 2016).
For those interested in declines in IQ scores, there’s two these meta-analyses, by now a bit dated:
- Woodley of Menie, M. A., Peñaherrera-Aguirre, M., Fernandes, H. B. F., & Figueredo, A.-J. (2018). What causes the anti-Flynn effect? A data synthesis and analysis of predictors. Evolutionary Behavioral Sciences, 12(4), 276–295. https://doi.org/10.1037/ebs0000106
- Dutton, E., van der Linden, D., & Lynn, R. (2016). The negative Flynn Effect: A systematic literature review. Intelligence, 59, 163-169.
There’s many more studies published now, so it’s time for someone to do a new meta-analysis. Exercise left to the reader.