Most method people agree that most researchers are bad at statistics, naturally. A typical paper to show this is:
-
Lyu, X. K., Xu, Y., Zhao, X. F., Zuo, X. N., & Hu, C. P. (2020). Beyond psychology: prevalence of p value and confidence interval misinterpretation across different fields. Journal of Pacific Rim Psychology, 14.
P values and confidence intervals (CIs) are the most widely used statistical indices in scientific literature. Several surveys have revealed that these two indices are generally misunderstood. However, existing surveys on this subject fall under psychology and biomedical research, and data from other disciplines are rare. Moreover, the confidence of researchers when constructing judgments remains unclear. To fill this research gap, we surveyed 1,479 researchers and students from different fields in China. Results reveal that for significant (i.e., p < .05, CI does not include zero) and non-significant (i.e., p > .05, CI includes zero) conditions, most respondents, regardless of academic degrees, research fields and stages of career, could not interpret p values and CIs accurately. Moreover, the majority were confident about their (inaccurate) judgements (see osf.io/mcu9q/ for raw data, materials, and supplementary analyses). Therefore, as misinterpretations of p values and CIs prevail in the whole scientific community, there is a need for better statistical training in science.
Which has this main table:
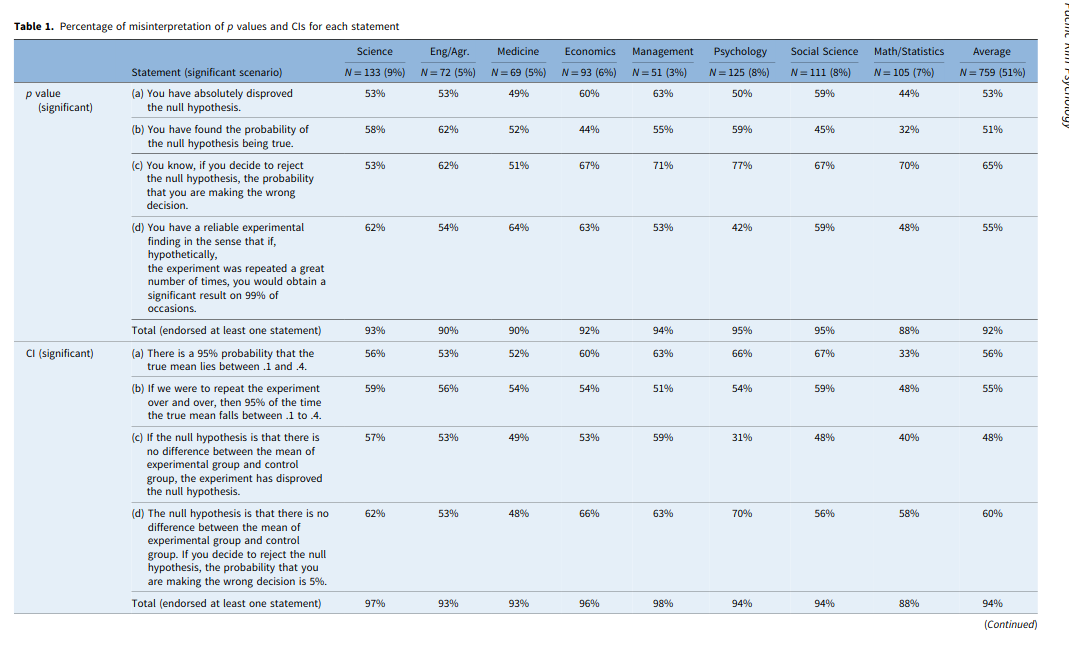
I am okay with these, except for CI-a. This is a correct inference. Now, this comes back to the usual Bayesianism vs. Frequentism debate, like one can find in this widely read paper:
-
Morey, R. D., Hoekstra, R., Rouder, J. N., Lee, M. D., & Wagenmakers, E. J. (2016). The fallacy of placing confidence in confidence intervals. Psychonomic bulletin & review, 23(1), 103-123.
The main argument for this is this one:
For instance, with respect to 95% confidence intervals, Masson and Loftus (2003) state that “in the absence of any other information, there is a 95% probability that the obtained confidence interval includes the population mean.” G.Cumming (2014) writes that “[w]e can be 95% confident that our interval includes [the parameter] and can think of the lower and upper limits as likely lower and upper bounds for[the parameter].”These interpretations of confidence intervals are not correct. We call the mistake these authors have made the “Fundamental Confidence Fallacy” (FCF) because it seems to flow naturally from the definition of the confidence interval:
Fallacy 1 (The Fundamental Confidence Fallacy) If the probability that a random interval contains the true value is X%, then the plausibility or probability that a particular observed interval contains the true value is also X%; or, alternatively, we can have X% confidence that the observed interval contains the true value.
The reasoning behind the Fundamental Confidence Fallacy seems plausible: on a given sample, we could get anyone of the possible confidence intervals. If 95% of the possible confidence intervals contain the true value, without any other information it seems reasonable to say that we have 95% certainty that we obtained one of the confidence intervals that contain the true value. This interpretation is suggested by the name “confidence interval” itself: the word“confident”, in lay use, is closely related to concepts of plausibility and belief. The name “confidence interval” — rather than, for instance, the more accurate “coverage procedure”— encourages the Fundamental Confidence Fallacy. The key confusion underlying the FCF is the confusion of what is known before observing the data — that the CI, whatever it will be, has a fixed chance of containing the true value — with what is known after observing the data. Frequentist CI theory says nothing at all about the probability that a particular, observed confidence interval contains the true value; it is either 0 (if the interval does not contain the parameter) or 1 (if the interval does contain the true value).
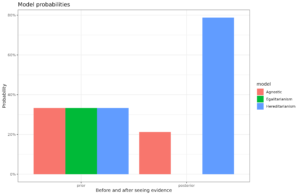
The authors of this paper are typical die-hard Bayesians. Their argument is just that CIs are based on the wrong theory. And then they will quote you some stuff from Fisher, and Neyman–Pearson from the 1930s. These kind of authors then go on to suggest we use Bayesian theory to derive Credibility Intervals AKA Credibility Regions (CRs, to have another acronym). This post provides a good example calculation of this. After going through the math and doing simulations, the post ends up with:
95% Confidence Interval: [90, 113]
95% Credible Region: [90, 113]The above derivation is one reason why the frequentist confidence interval and the Bayesian credible region are so often confused. In many simple problems, they correspond exactly. But we must be clear that even though the two are numerically equivalent, their interpretation is very different. [their emphasis]
Now the reader is maybe wondering: wait, these people go through all this trouble, and then come up with the exactly the same numbers?! That’s because for typical data situations, confidence intervals and credibility regions based on flat priors are the same thing. There is no difference in the result, just the derivation details are different. Since the derivation details do not matter for practical scientists, one can simply treat confidence intervals as Bayesian credibility regions with flat priors. The use of flat priors avoids debates about whose prior is better. This may violate their sensibilities about statistical-philosophical theory, but it works fine in practice. I’m all about practice.
For those who want a comparison: The debate between factor analysis (FA) and principal component analysis (PCA) is apt. PCA is based on complete different theory, and does not with mathematical necessity produce the same result as FA methods. However, in practice, they produce basically the same results for most purposes. A sensible practical scientist will disregard the irrelevant theoretical stuff about calculations of these results. I submit that the same is true for confidence intervals. One cannot really interpret probability certainty estimates from any statistical model as being some ‘ground truth’ context-independent value, whether Bayesian or Frequentist based. All of these calculations are based on a bunch of assumptions and choices in analysis which may be largely arbitrary. Disturbingly, often, variation in these decisions leads to massively different results. A prudent scientist interprets statistical certainty estimates as being just that, estimates based on various assumptions and decisions that are not to be taken too seriously. Whenever I read a confidence interval in some paper, let’s say it produces r = .30 [95CI: .20 to .40]. I don’t think to myself: “The correlation has a 95% probability of being .20 to .40”, I think: “Well, given these choices in analyzing the data, one could get this estimate of certainty, and based on that the true value should be around .20 to .40, but let’s see if some other people analyze the same data, or repeat the experiment”.
To be sure, one can easily come up with weird data situations where CIs and CRs don’t agree. These are typically extremely unlike anything a normal scientist would see. In reply to a tweet of mine about this topic, Twitter person Kmutter Mutter comes up with a typical example (arguing against me):
1/* Nonsense. Think about a model of failure after some time t: p(t|param)=exp(param – t) for t>param, and 0 for t<param, where param is the least possible time of failure.
2/* Assume that we run an experiment with this model several times and we get 3 measured times of failure, let’s say: 10s, 12s, 15s. Param is the minimal time of failure, so we know for sure that it must be less or equal to 10.
3/* By computing the sampling distribution from the unbiased estimator, we get 95%CI from 10.2 to 12.2. But we know that the estimated param cannot be in this interval! And this has nothing to do with Bayesian fetishism. It’s not philosophy, it’s math.
Naturally, it is super contrived. This kind of data is very unusual, and n=3 is a big red flag that we should not take anything very seriously from this, no matter what theory it is based on. A more detailed weird example of this can be found in this great answer on CrossValidated. It is true, if you find yourself in some very odd data situation like the above, you probably need to think harder about it, and may need a Bayesian solution, or some frequentist hack solution. Ideally, you would collect more data! More data beats better methods. But most of the time, you will be fine with interpreting CIs as CRs.