Someone emails me:
Hello Mr. Kirkegaard,
This is a question I emailed to Richard Lynn about data in regression analysis in his book Intelligence that did not make sense to me. [Lynn is busy]. I thought maybe you could answer this question since he cannot, which is why I am forwarding the email I sent him to you, because I don’t feel like rewriting the same question again.Anon
———- Forwarded message ———
From: Anon
Date: Sat, May 9, 2020 at 4:21 AM
Subject: Question about negative fitted values in regression analysis data table in ‘Intelligence’ in the chapter ‘Educational and Cognitive Attainment’
To: Richard Lynn <lynnr540@aol.com>Hello Professor Lynn,
I just read the third chapter of Intelligence, Educational and Cognitive Attainment. The regression analysis data table about the correlation of IQ to tertiary education, table 3.6, on pages 52-61, contained some negative fitted values, and that confused me. My understanding is the fitted values are average percent of people in countries of similar IQ to the country listed, who go to tertiary education. For example (on page 52):
Country IQ Tertiary actual value Tertiary residual value Tertiary Fitted value Afghanistan 75
1
-12.1
13.1
The fitted value means that 13.1% of people in countries with IQs similar to Afghanistan’s go to tertiary education. As I said, there are some countries in your data table that have negative fitted values, for example (on page 53):
Country IQ Tertiary actual value Tertiary residual value Tertiary fitted value Cameroon 64
8
14.5
-6.5
There are eleven countries you listed as having negative fitted values for tertiary schooling, the others are Central African Republic, Chad, Dominica, Gambia, Guinea, Haiti, Lesotho, Malawi, St Lucia and Sao Tome and Principe.The reason this is confusing to me is that fitted values represent the percent of people in countries with similar IQs to the country listed who go to tertiary education, and it seems impossible to me for the average percent of people in countries with similar IQs going to tertiary school to be below 0. I would have thought only the residual values could be negative, because the residual values are what state the difference between the percent of people in the country going to tertiary education and the percent of people in countries of similar IQ going to tertiary education, and if a smaller percent of the country go to tertiary education than the average percent of countries of similar IQ go to tertiary education, then obviously the residual will be negative to explain it, like it does in Afghanistan, its negative residual means that 12.1% fewer people go to tertiary education there than in countries of similar IQ. Fitted values being negative does not make sense to me because for an actual representation of people performing an activity it is not possible to have fewer than zero people doing it. And there seems no reason to artificially give fitted values negative values since residual values are the values to explain the difference between the one country and countries of similar IQ in tertiary percentage.Are these negative fitted values typos or are they supposed to be negative? If they are supposed to be negative, how does that work?Anon
The answer is simple. OLS (ordinary least squares) does not know that the outcome variable cannot go below 0%. It assumes it is a continuous variable with theoretically infinite range, and draws a best fitting line to forecast values whether or not these are considered sensible by humans (below 0 or over 100%). One will have to use a more advanced method if one wants to avoid this kind of issue. Typically here, one would use some kind of logistic-like function. If you repeat the model fit in Excel, you will find the same result for countries with very low IQs. A quick and dirty solution is to simply set negative predicted values to 0.Something like one of these:-Emil
Emil,
‘One will have to use a more advanced method if one wants to avoid this kind of issue.’ Could you explain to me or else direct me to a source explaining a specific method for avoiding negative results? I would prefer to see what the actual average value of percentages for very low IQ countries is in regression analysis than the artificially constructed negative numbers because I am trying to present the data to people as evidence for the importance of IQ and intelligence for differences in life outcomes between people, and when I show them the data as written with the negative fitted values it gives them an excuse to dismiss the data as gibberish.
Anon
I had already given a link, but, OK, seeing that this is a common enough issue (https://www.google.com/search?q=%22bounded%22+%22OLS%22), let’s cover it here in detail. I made a quick demonstration in R, here’s the notebook https://rpubs.com/EmilOWK/bounded_regression_Lynn with details.
Lynn’s plot looks like this:

So it’s just straight OLS. We see the fitted line is below 0, x intercept is at 67 or so. The outcome is a percentage variable, i.e., bounded to 0-100%. Hence, if one used this model to forecast educational enrollment in IQ 60 country (supposing we find or create a new one), then we would get an impossible negative value of about -13%. OK, so maybe Lynn isn’t super interested in doing this kind of forecasting, he just wanted to show there is a strong pattern, and he was lazy or statistically incompetent with the model chosen. Not too surprising considering he was 82 years old when writing this book. The hack solution here is just to set the negative values to 0, and sometimes this is good enough.
But if it is not good enough, what can we do? Well, I took a copy of his data from the book, then fit a bunch of more advanced models to the data, shown below:
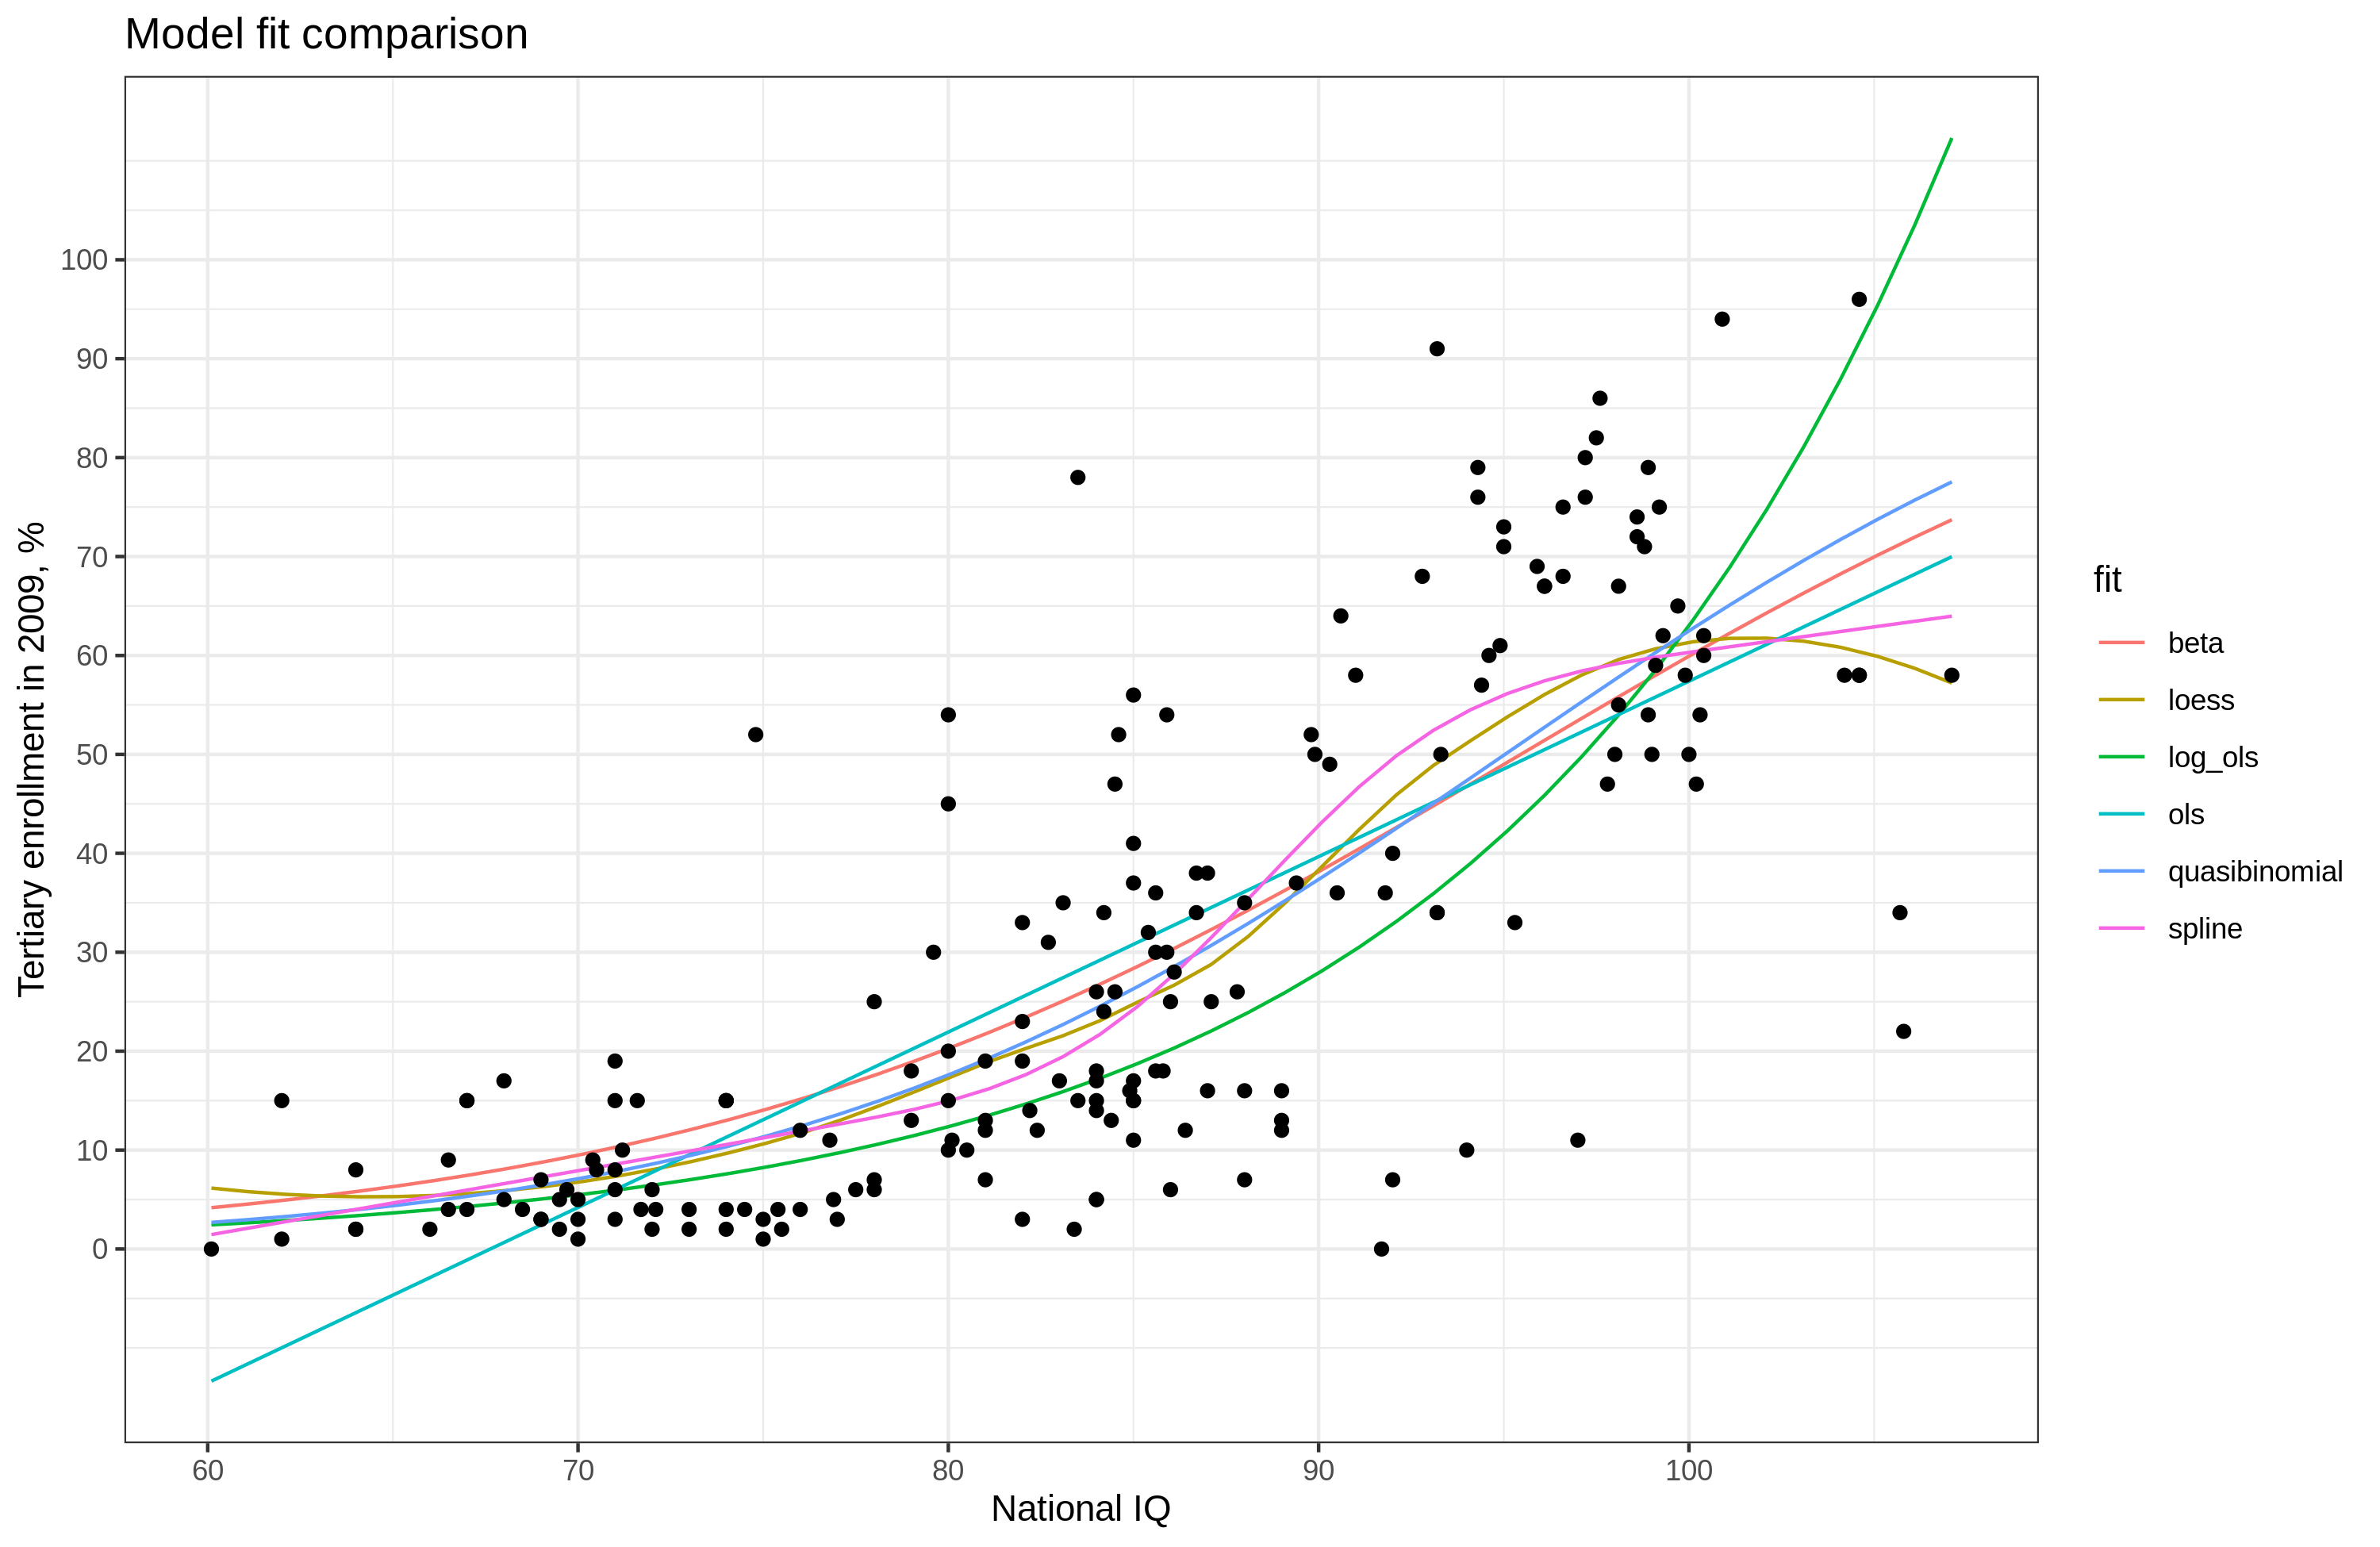
OK, so here we compare 6 approaches to fitting the data. The easiest stuff to use is loess (local regression, only works with few variables, old school), splines (works with anything in GLM, I used the one in rms package), log conversion (assumes exponential model basically), beta regression and quasibinomial are the most appropriate, since they are based on proportion outcome data. Nothing however worked so easily as the splines, which is why they are my first choice in dealing with nonlinear patterns. The models: ols, log_ols, spline, and loess do not understand that the outcome has boundaries, but may or may not produce results within the boundaries. In this case, spline and loess are both OK, but loess has downwards trend at the end due to East Asian countries at the high IQ end, while the spline does not have this (it depends on the settings, I used the defaults for rcs() and you have to read the book for the package for details because the author does not believe in properly informative documentation for whatever reason). The models ols and log_old both produce impossible results (the latter produces >100 at high end).