There are 1000s of tests, scales, and assessments that have been made in the social sciences and in life in general. Sometimes, these are far too long. Take, for instance, the 560+ yes/no questions long MMPI-2 scale for measuring psychopathology (mental illness), or the 300 item long IPIP big five personality test. Clearly, for most practical purposes, these tests are too long. You can’t just put them in your survey and expect people to finish, and if you send them to a relative, they are more likely to groan than to tell you their results.
So how does one abbreviate a scale anyway? It’s a big topic. Years ago, I read a very interesting blogpost by Tal Yarkoni on this (also an academic paper). In his follow-up post, he made the startling observation that:
Suppose you have two completely uncorrelated items, and you decide to administer them together as a single scale by simply summing up their scores. For example, let’s say you have an item assessing shoelace-tying ability, and another assessing how well people like the color blue, and you decide to create a shoelace-tying-and-blue-preferring measure. Now, this measure is clearly nonsensical, in that it’s unlikely to predict anything you’d ever care about. More important for our purposes, its internal consistency would be zero, because its items are (by hypothesis) uncorrelated, so it’s not measuring anything coherent. But that doesn’t mean the measure is unreliable! So long as the constituent items are each individually measured reliably, the true reliability of the total score could potentially be quite high, and even perfect. In other words, if I can measure your shoelace-tying ability and your blueness-liking with perfect reliability, then by definition, I can measure any linear combination of those two things with perfect reliability as well. The result wouldn’t mean anything, and the measure would have no validity, but from a reliability standpoint, it’d be impeccable.
In other words, in terms of efficiency, Cronbach’s alpha is actually your enemy. It is a measure of redundancy, which has some relationship to reliability (getting consistent results when measuring twice). Unfortunately, alpha is the most widely used metric (because default in most software) and the one people usually abbreviate scales using. The result is that researchers develop scales that basically ask the same thing over and over, because this way, of course, the responses to the different items will be highly consistent, giving a nice alpha value that helps getting the papers published. It also means you might spend 5 minutes asking 30 questions to only measure one trait marginally better than if you had spent 30 seconds, and spent the other 4.5 minutes measuring something else. Yarkoni’s dream scenario is that researchers drop this idea. Instead, they should find a collection of, say, 100 questions that don’t seem to have anything much in common, but which can be scored in many ways to measure different traits.
But back to scale abbreviation. There are smarter methods around. Instead of trying to make short scales that are really highly internally consistent, we could try to make short scales that are maximally correlated with the full scale’s score. We could alternatively also try to make sure the scale reliably measures the full range of whatever we are trying to measure (e.g. extroversion, language ability, depression). One way to approach this is to compute the IRT-based reliability. This is better than the alpha approach because IRT-based reliability is the estimated reliability of the test across the full range, not just whether you managed to pick e.g. 10 items that are very highly correlated with each other, but are also far too easy. On this note, consider this 2016 study.
- Schroeders, U., Wilhelm, O., & Olaru, G. (2016). Meta-heuristics in short scale construction: Ant colony optimization and genetic algorithm. PloS one, 11(11), e0167110.
The advent of large-scale assessment, but also the more frequent use of longitudinal and multivariate approaches to measurement in psychological, educational, and sociological research, caused an increased demand for psychometrically sound short scales. Shortening scales economizes on valuable administration time, but might result in inadequate measures because reducing an item set could: a) change the internal structure of the measure, b) result in poorer reliability and measurement precision, c) deliver measures that cannot effectively discriminate between persons on the intended ability spectrum, and d) reduce test-criterion relations. Different approaches to abbreviate measures fare differently with respect to the above-mentioned problems. Therefore, we compare the quality and efficiency of three item selection strategies to derive short scales from an existing long version: a Stepwise COnfirmatory Factor Analytical approach (SCOFA) that maximizes factor loadings and two metaheuristics, specifically an Ant Colony Optimization (ACO) with a tailored user-defined optimization function and a Genetic Algorithm (GA) with an unspecific cost-reduction function. SCOFA compiled short versions were highly reliable, but had poor validity. In contrast, both metaheuristics outperformed SCOFA and produced efficient and psychometrically sound short versions (unidimensional, reliable, sensitive, and valid). We discuss under which circumstances ACO and GA produce equivalent results and provide recommendations for conditions in which it is advisable to use a metaheuristic with an unspecific out-of-the-box optimization function.
There are two key plots:

S15, S20 etc. is the simplest approach of picking the X items with the highest factor loadings. This is in the same direction as maximizing alpha. The trouble is that in pools of items, often there are correlations between item parameters. Specifically, in ability tests, the easier items tend to have higher loadings. Thus, if one maximizes item loadings, one will get a very internally consistent scale that’s very good at measuring people who are 1 standard deviation below the mean, and not very good at measuring people in the middle of the distribution or on the right tail. The more complex methods (A = ant colony, G = genetic algorithm) make it possible to select for multiple things at the same time and find a better abbreviation.
Their second plot shows that this matters a lot:

Here they tested their abbreviated scales by correlating them with external variables. As can be seen, the max loading approach heavily distorts the correlations, making the short scale much worse than it has to be. For instance, instead of correlating at 0.32 with reading speed (right column, full test), the 15-item abbreviated scale based on maximizing loadings only correlates at 0.22 (0.32 – 0.10). However, the two other algorithms produced correlations of 0.30 and 0.29. Almost as good as the full scale! One can even induce biases, as apparently maximizing loadings resulted in the test correlating more strongly with German as a native language (they are abbreviating a vocabulary test).
Great, so can you just take their code and use it for your own purposes, right? Well, sort of. The links are characteristically broken, but if you look around on the internet, you can find the code of this paper here, and a deleted R package here. Sad!
What to do? I decided to write a new function myself (competing standards aside), so that it is readily available, and so that I understand everything. Here I will showcase it for you. First, let’s simulate some test data:
- n = 1000 subjects
- p = 100 items of varying factor loading and difficulty
- a correlation of -0.50 between loading and difficulty (similar to what I found in real data)
- we want to abbreviate it to 25 items (75% shorter)
I implemented 4 abbreviation methods:
- max loading: pick the X items with the highest loadings.
- step forward: start with 3 items based on highest loadings (IRT cannot be done with fewer), then add items step by step until reaching X items; choose items by which produces the best scale in some metric(s).
- step backward: same as above, but start with all items, then step by step remove them until reaching X items, while maintaining highest metric.
- genetic algorithm: start with a population of item sets of the target size, then keep the top x% of them based on model metrics, the selected item sets then reproduce the next generation, to which you add some random mutations; repeat this process until you no longer see any improvements.
Based on this, here’s the results for maximizing the reliability and correlation of the abbreviated scale with the full scale:
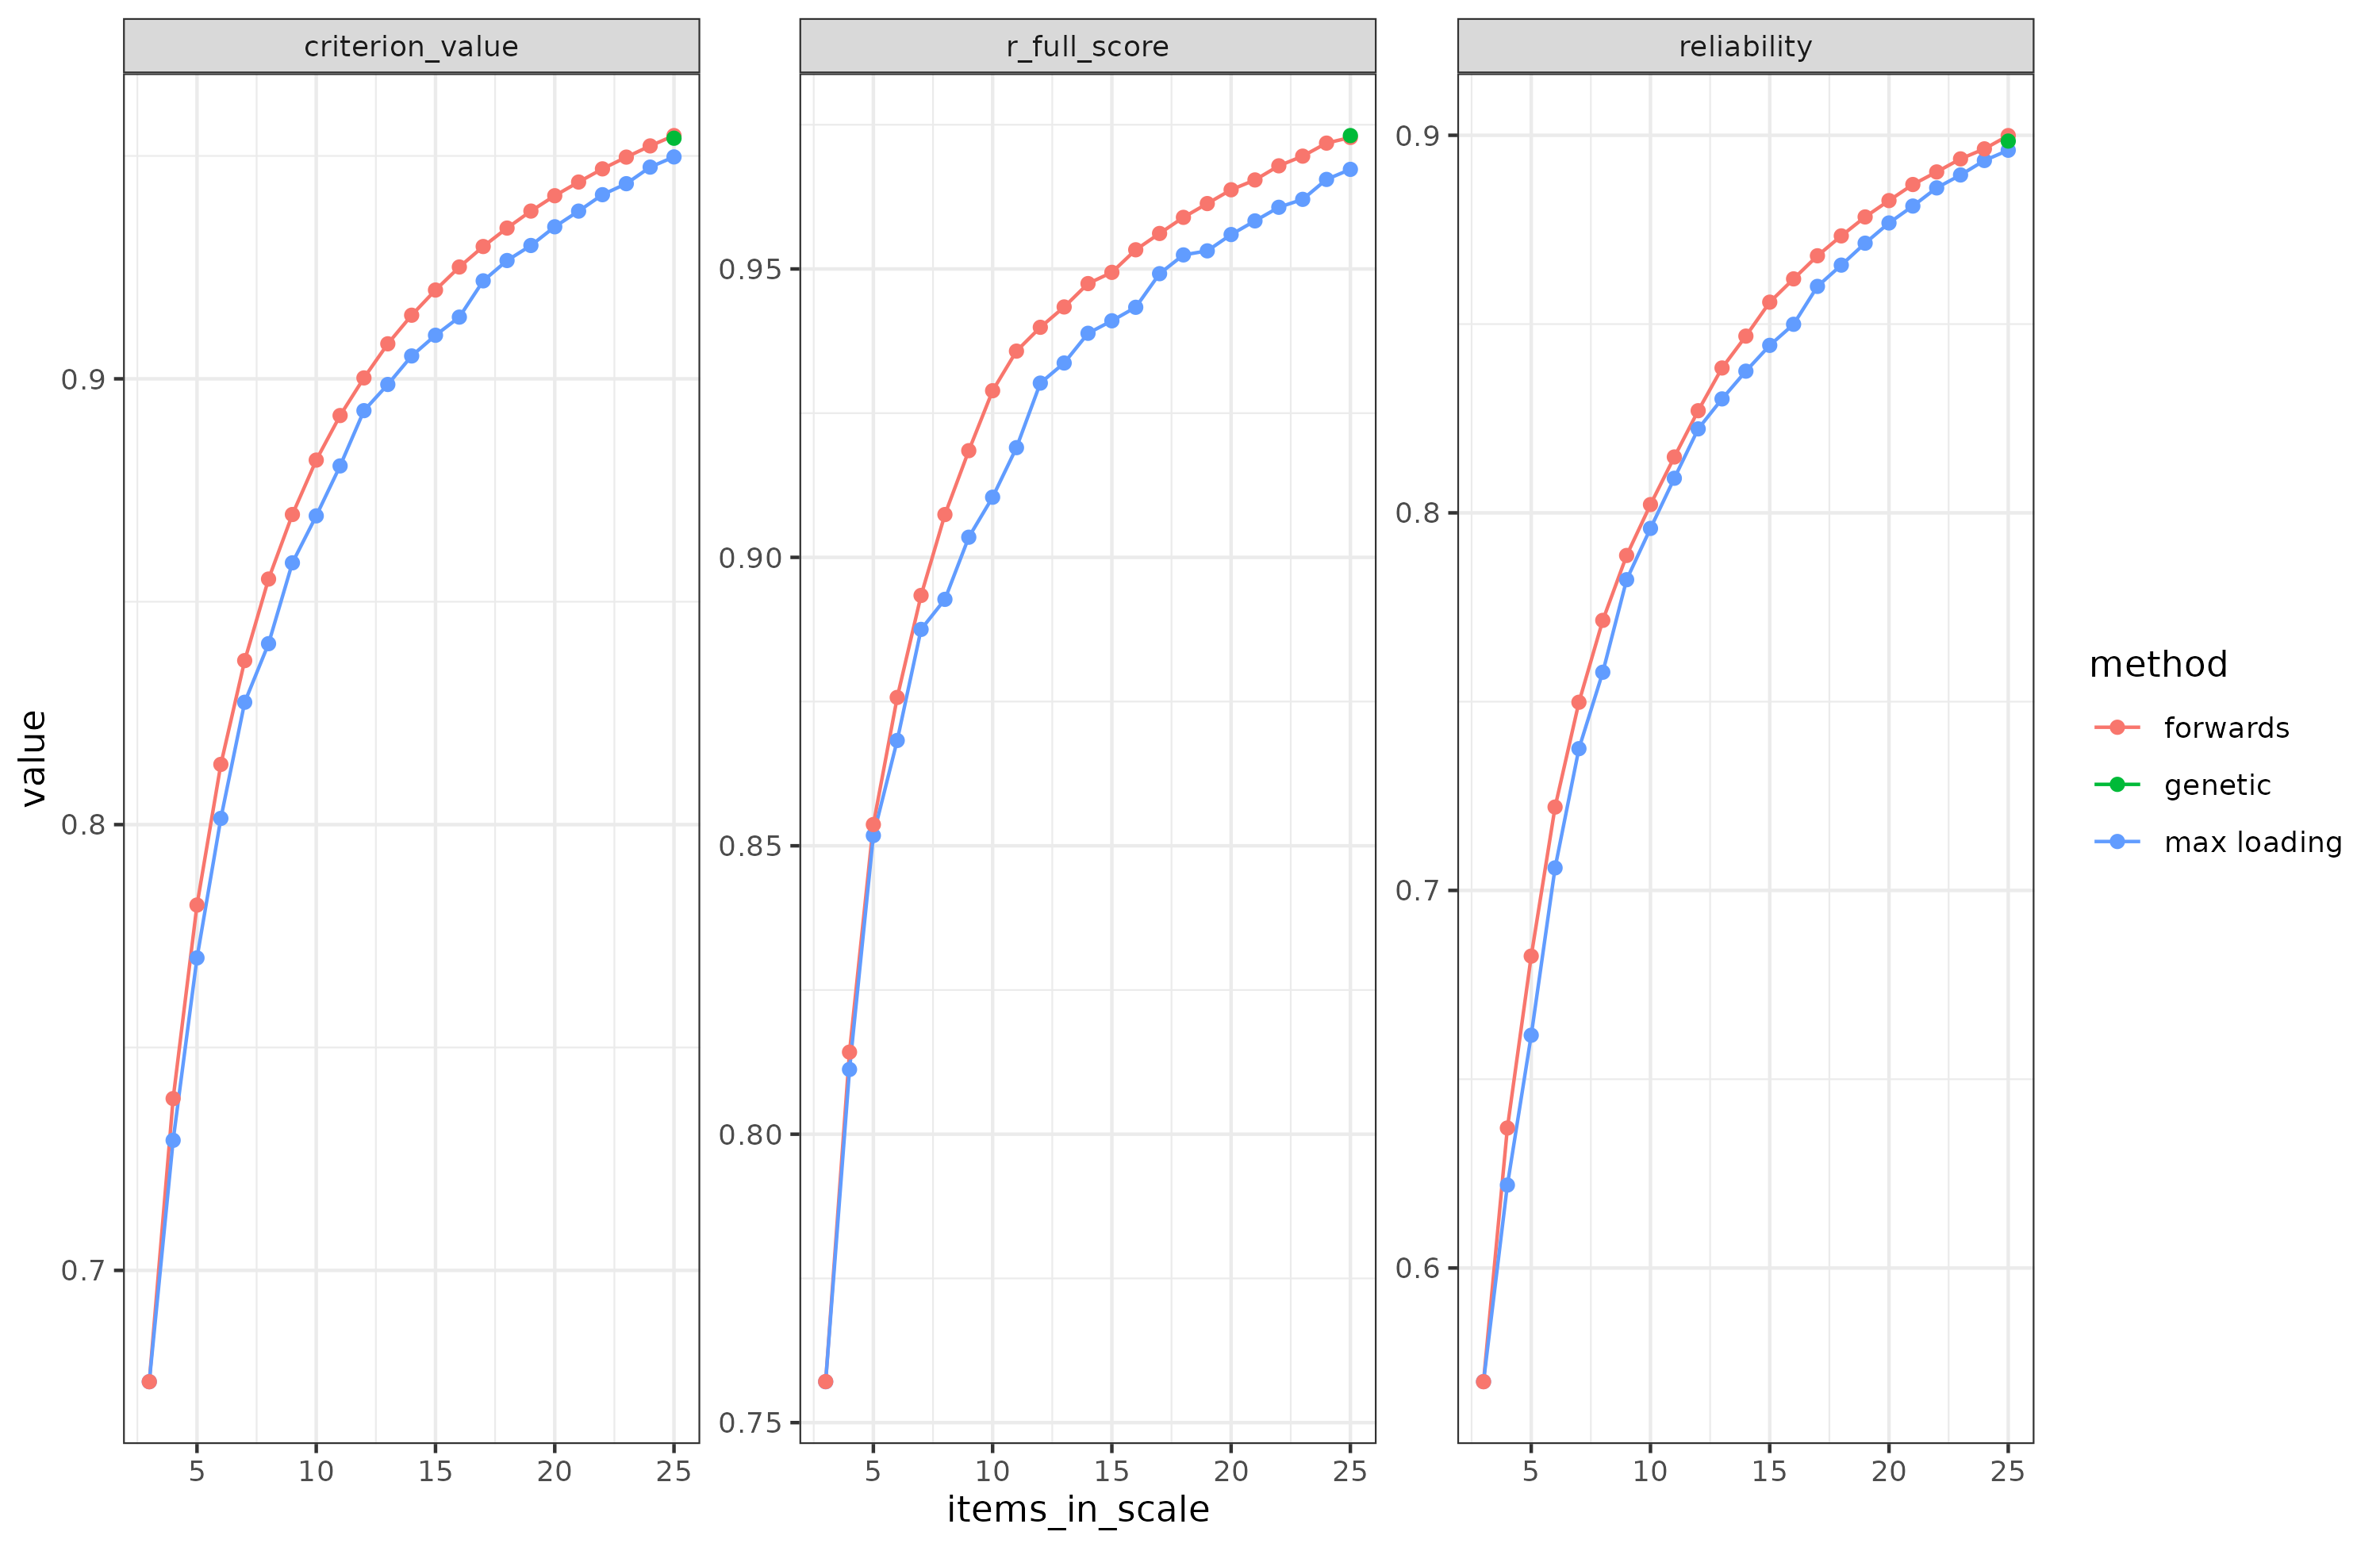
Since the genetic algorithm only has the target size number of items, there is no line. The green dot shows the final model. Criterion value is the average of reliability and full scale correlation (scaled appropriately).
Looking at the above, we see that forward selection beats max loading approach for both reliability and correlation with full scale score. This is because max loadings method picks the easier, higher loading items, so it neglects to properly measure the entire distribution. In theory, the forward algorithm will get stuck in any local optimum along the way. After it has picked an item, it cannot unpick it. So if the optimal solution doesn’t contain any of the items forward selection picked up on the way, it can’t get rid of them again. In theory, then, the genetic algorithm should be better able to avoid such local optima, but it can still get stuck. In this simulation test, though, the genetic algorithm couldn’t do any better than forward selection. It did, however, take a lot more time. Even with multi-threading, these were the run times:
- max loading: 6.233 secs
- forward: 312.748 secs
- genetic: 1425.203 secs
Clearly, the max loading algorithm has its place. It runs at a small fraction of the time of the other approaches. I’ve tinkered with this approach in two ways to see if I could retain the speed yet get the same results as the slower methods. I came up with two variants. First, one can group items into difficulty groups and select the same number of items from each group based on their factor loading. This ensures representation from each group, but may result in some items with mediocre loadings being picked if one is not careful about the grouping. Second, one could residualize the loadings based on the difficulties, and use the residualized loadings for selection. Doing so should also remove the general tendency to pick too easy items. I tried both approaches in the same simulation and they work. They are only marginally inferior to the forward and genetic algorithms. Forward selection gets us to reliability = 0.900 and a correlation to full scale of 0.973, while the max loading variants gets us 0.900 and 0.971.
What about finding the optimal model too?
Above, we assumed we know some true model of the data (a simple 1-dimensional model), but what if we don’t know the true model? There’s a plethora of methods for doing various kinds of exploratory factor analysis, on items and subscales, and then deciding on the ‘right’ number of factors and their structure. However, in a new paper, Schroeders and team is back with yet another animal-inspired algorithm proposed to automate this part of the analysis too:
- Schroeders, U., Scharf, F., & Olaru, G. (2024). Model specification searches in structural equation modeling using Bee Swarm Optimization. Educational and Psychological Measurement, 84(1), 40-61.
Metaheuristics are optimization algorithms that efficiently solve a variety of complex combinatorial problems. In psychological research, metaheuristics have been applied in short-scale construction and model specification search. In the present study, we propose a bee swarm optimization (BSO) algorithm to explore the structure underlying a psychological measurement instrument. The algorithm assigns items to an unknown number of nested factors in a confirmatory bifactor model, while simultaneously selecting items for the final scale. To achieve this, the algorithm follows the biological template of bees’ foraging behavior: Scout bees explore new food sources, whereas onlooker bees search in the vicinity of previously explored, promising food sources. Analogously, scout bees in BSO introduce major changes to a model specification (e.g., adding or removing a specific factor), whereas onlooker bees only make minor changes (e.g., adding an item to a factor or swapping items between specific factors). Through this division of labor in an artificial bee colony, the algorithm aims to strike a balance between two opposing strategies diversification (or exploration) versus intensification (or exploitation). We demonstrate the usefulness of the algorithm to find the underlying structure in two empirical data sets (Holzinger–Swineford and short dark triad questionnaire, SDQ3). Furthermore, we illustrate the influence of relevant hyperparameters such as the number of bees in the hive, the percentage of scouts to onlookers, and the number of top solutions to be followed. Finally, useful applications of the new algorithm are discussed, as well as limitations and possible future research opportunities.
They turned the bees loose on analyzing the factor structure of a questionnaire designed to measure the dark triad (narcissism, Machiavellianism, psychopathy). Supposedly, the items measure the ‘general darkness’ factor as well as three sub-dimensions. This structure is perfect for a bi-factor solution (or hierarchical), but do the items really measure what they were intended to do?

Bee optimization indicated that several other possible models fit the data better than the intended one. In fact, each seed of the algorithm produced a different optimal model configuration! This is due to the nondeterministic nature of the algorithm. Judging by the usual model fit parameters, who is to say which one is best? Here it should be said that these kinds of methods are extremely flexible and thus will overfit the data quite a bit. Their proper evaluation thus requires cross-validation, and preferably an unrelated test dataset to assess out-of-dataset generalization.
My reason for bringing this up is that in the current AI frenzy, there’s a lot of focus on getting the LLMs to do stuff, but they are generally hacky and suck at math, and tend to just make stuff up. For the purpose of writing some of the code for this article, I had to ask GPT4 about 10 times to fix a function it made me, even after I gave it the right approach. Still, eventually, it did make the right model. But how annoying is it that the AI can’t so far just test the code it gives you before confidently claiming it works, then apologizing, then giving you a new wrong version, and repeating this process a few more times? Still, I guess maybe it was still faster than writing that part myself.
For those who want to try out the functions, they are in my R package on Github.