I’ve written many times about the current dysgenic selection in humans, where evolution seems to be going the wrong way according to our preferences. Specifically, after the industrial revolution, the fertility rate and number of surviving children seems to have become larger for the lower classes than the higher classes. As social status is highly correlated with intelligence (r = .65 or so), this has also reversed the selection for intelligence. Previously, it had been positive as judged from the social status proxy. Details on this Survival of the Richest before the industrial revolution can be found in Gregory Clark’s Farewell to Alms:
And it is not only in Europe this can be seen, here are some Japanese data on Samurai:
And China, as proxied by Qing dynasty:
The Samurai and Qing are both elite groups and they did enjoy elevated fertility rates, though the data are not as good as those for Europe.
The book does not seem to have a plot that shows the reversal, but one table shows that it had reversed by the 1890s in England:
Notice here the lower fertility of the relatively elite professional class compared to the others.
This next table with a simpler rich-poor division shows the contrast, but does not show when it began as the modern data are from around 2000:
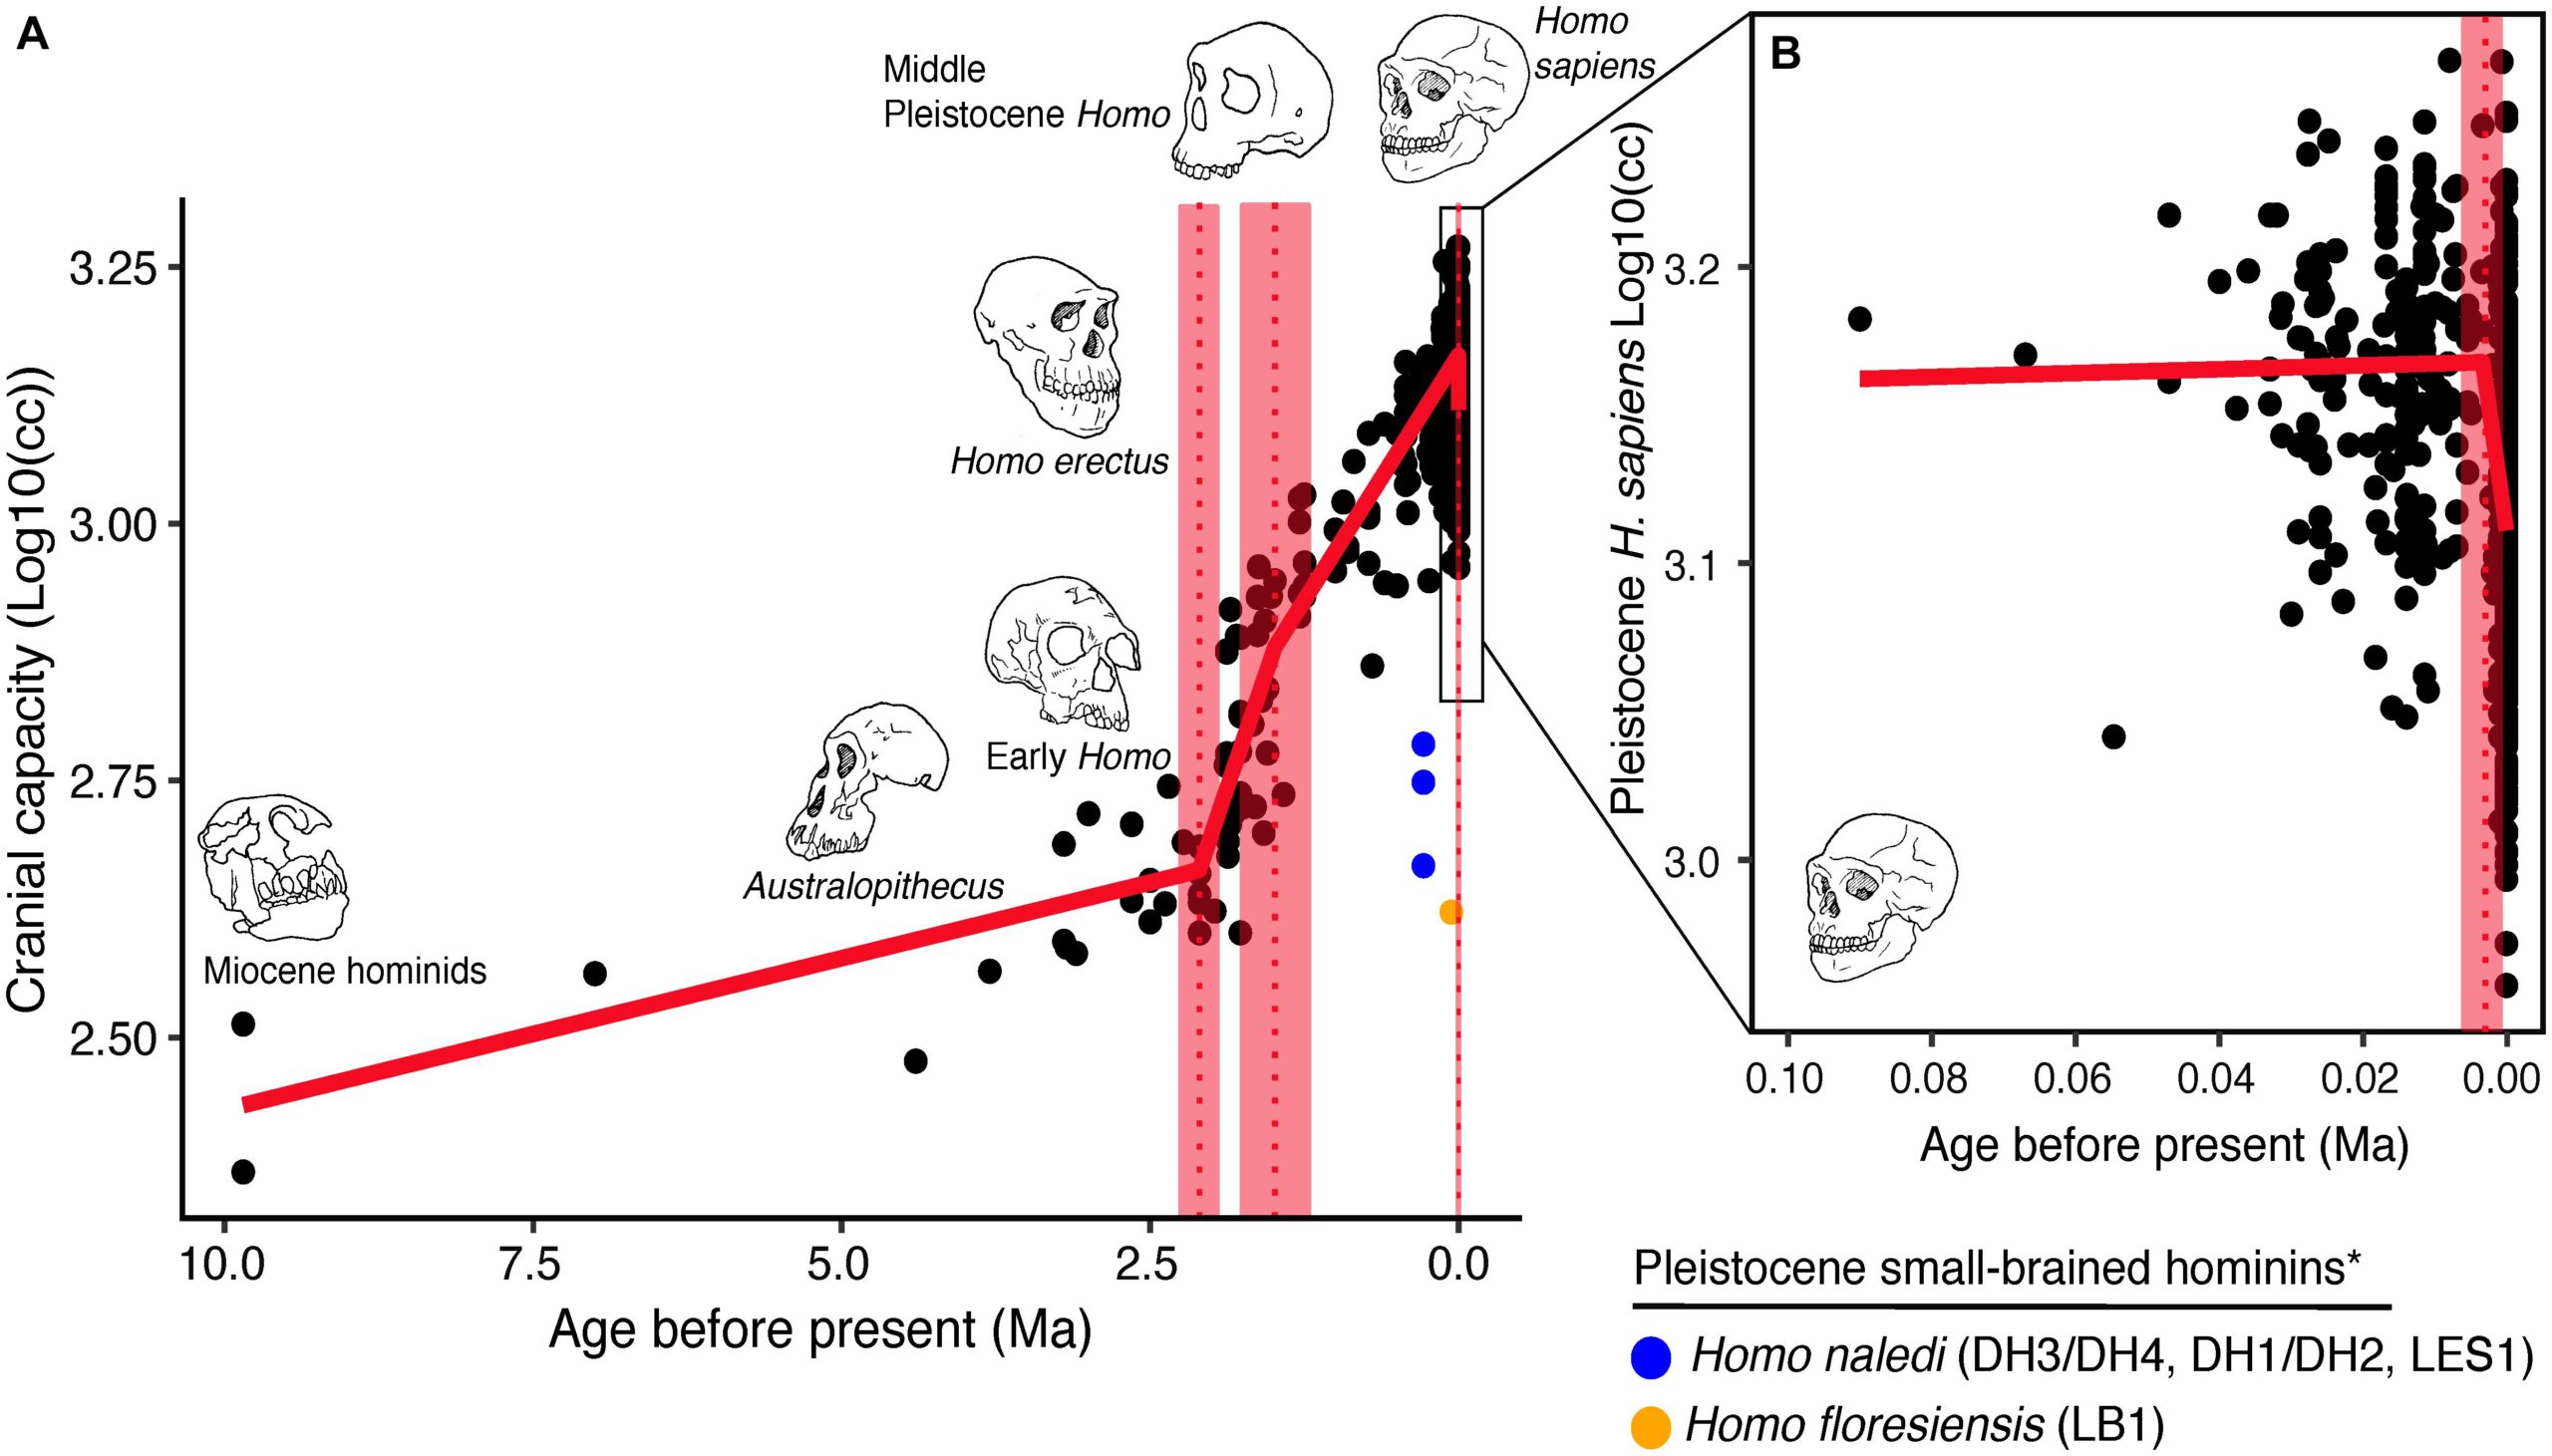
But humans did evolve larger brains over time, so clearly, the selection for intelligence must have been positive for a long time. We can track this ancient selection in multiple ways. First, based on cranium measures, we can see they increase in size, thus holding a larger brain.
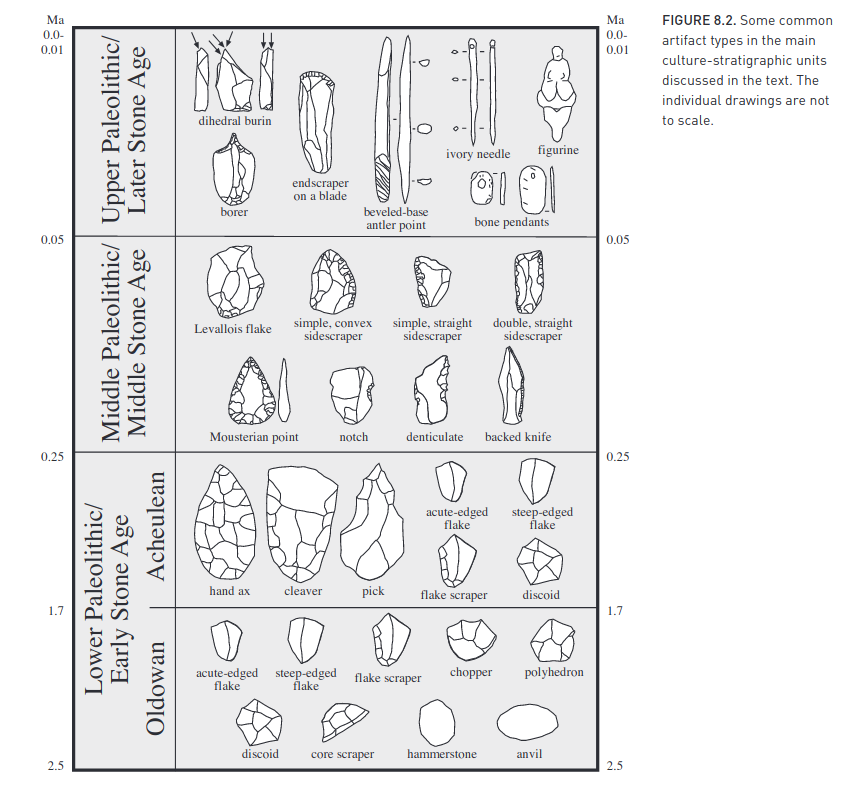
Second, based on artifacts left behind which greatly increase in complexity over time:
But there’s also a third option: we can directly track the genetics of intelligence. While we do not have models that allow us to compare species for intelligence based on genetics (yet!), we do have models that allow the comparison of humans. In the last decade or so, archaeologists have teamed up with geneticists to obtain and sequence old bones for DNA. This has led to 1000s of ancient genomes that are available for analysis. That is what this recent paper did for many phenotypes of interest based on the available genetic models:
- Kuijpers, Y., Domínguez-Andrés, J., Bakker, O. B., Gupta, M. K., Grasshoff, M., Xu, C. J., … & Li, Y. (2022). Evolutionary Trajectories of Complex Traits in European Populations of Modern Humans. Frontiers in genetics, 699.
Humans have a great diversity in phenotypes, influenced by genetic, environmental, nutritional, cultural, and social factors. Understanding the historical trends of physiological traits can shed light on human physiology, as well as elucidate the factors that influence human diseases. Here we built genome-wide polygenic scores for heritable traits, including height, body mass index, lipoprotein concentrations, cardiovascular disease, and intelligence, using summary statistics of genome-wide association studies in Europeans. Subsequently, we applied these scores to the genomes of ancient European populations. Our results revealed that after the Neolithic, European populations experienced an increase in height and intelligence scores, decreased their skin pigmentation, while the risk for coronary artery disease increased through a genetic trajectory favoring low HDL concentrations. These results are a reflection of the continuous evolutionary processes in humans and highlight the impact that the Neolithic revolution had on our lifestyle and health.
Their method is to download the David Reich compilation of ancient genomes as well as the 1000 genomes collection of modern genomes, which is used for comparison:
Ancient DNA genotype data was downloaded from version 37.2 of the published aDNA genotype database, compiled by and available on the David Reich Lab website. The ancient DNA samples consisted of pseudo-haploid genotype data. This was due to the low genotyping coverage. Samples with variant missingness above 96 percent were filtered out using Plink version 1.9 (Purcell et al., 2007). This was done in order to remove outliers with extremely low coverage. Only samples within Europe were used for this study; these samples were selected based on their geographic location, which is latitude (within 35 and 70 degrees north) and longitude (within 10 degrees west and 40 degrees east). Samples without a carbon-dated age were also filtered out. We also selected 250 European samples from the 1,000 genomes to project phase 3. Only variants present in both the ancient samples and the modern samples were retained. This resulted in a dataset of 827 ancient samples and 250 modern samples containing 1,233,013 variants. The total number of filtered SNPs for each trait shown in our main findings is provided in Supplementary Table S3 (column N).
Note the European-only approach! The version they used was also far out of date. The current version is 50.0 (“V50.0: New data release: Oct 10 2021”). Due to their triple selection, they ended up with only 827 ancients, but the total dataset is up to 6442 ancients, so this study is already far out of date! Nevertheless, let’s look at their findings:
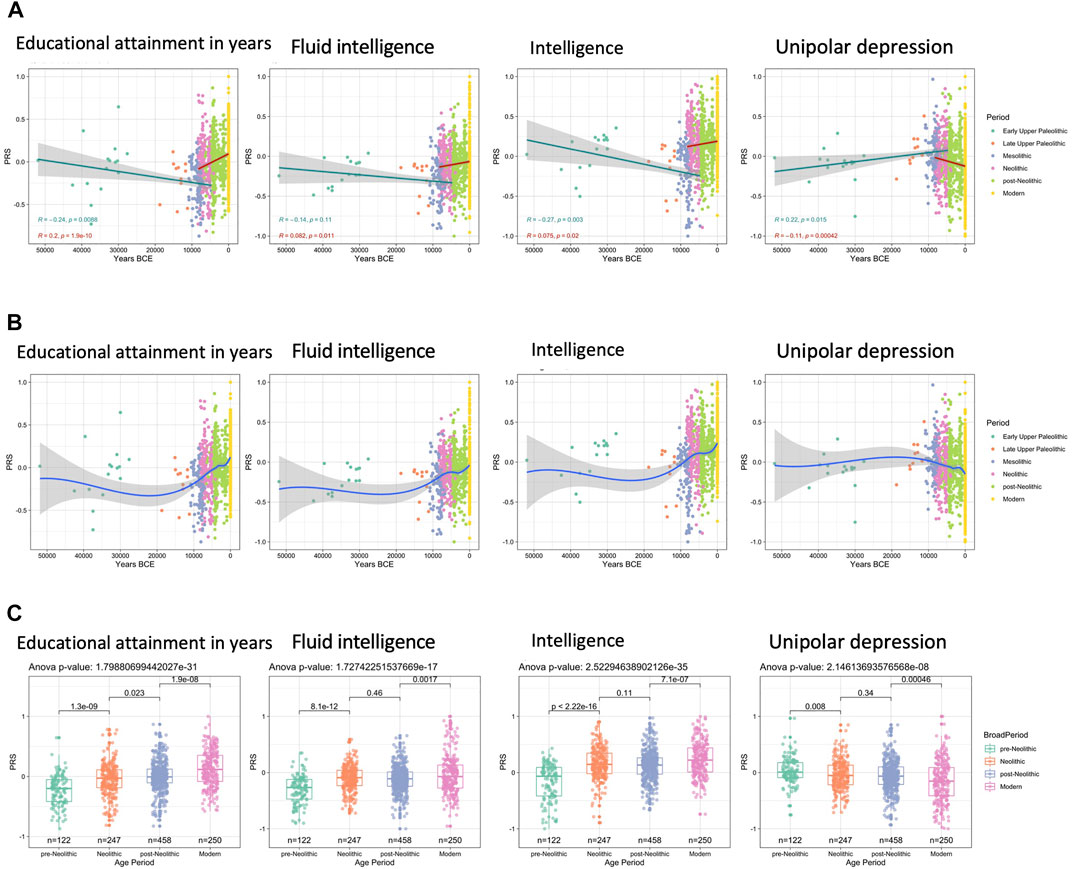
For some reason, they prefer to show results 3 ways: First, piecewise regression by period. This allows them to posit and easily test different slopes (selection strengths) for different periods, but may be unrealistic. Second, smoothing fit, which allows any slopes at any time. Probably the best approach. Third, comparison of means. Whatever the method, we see that height polygenic scores have been relatively constant in the period -50k to -10k, but showed strong selection from about 5000 years ago to the present. However, since we have very few very old genomes, it is possible this analysis missed something going on. Note also that polygenic scores are less valid the more genetically distant the populations, so one might question the exact validity of the 50k year old genomes. This is the same discussion about differential LD decay, GWAS ascertainment bias etc. that exist for comparison of different modern racial groups’ scores.
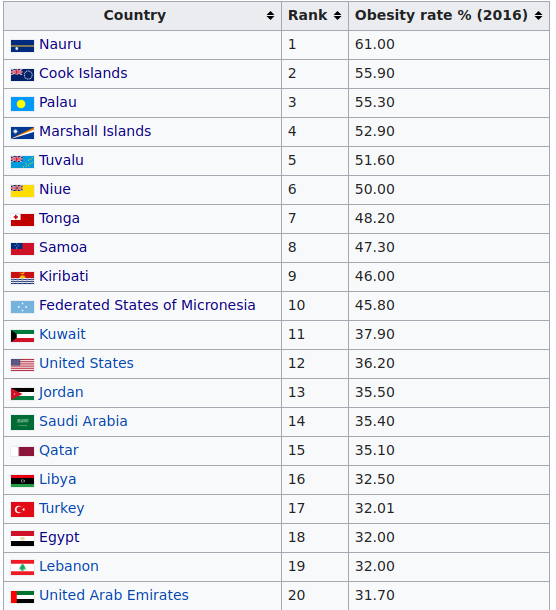
This next figure shows the results for other mostly physical traits. The genetic of obesity or heavy body-shape seems to have declined. I would guess this has something to do with the change to farming as food source versus hunting. Since hunting success is fairly random, it is necessary to bulk up energy storage to buffer against dry spells. This is the same explanation I hypothesize for the extreme obesity levels seen in Polynesian peoples. If we look at the world top 20 of obesity, the first 10 countries are all Polynesian islands:
Of the remaining 10 countries, 9 are MENAP, and one is USA. I don’t have a particular theory about USA, but it has something to do with Anglo genetics or culture, because the other Anglos are also much elevated: New Zealand #22, Australia #27, UK #36. This is far far above the other European groups, even though they are very closely related to Anglo-Saxons who settled England: Denmark #111, Germany #79, Netherlands #99, France #87, Belgium #81.
Back to the ancients:
Here we see the findings of most interest, those for intelligence and education. We see a successful replication of Woodley et al’s 2017 paper finding ancient eugenics. There is a steady selection upwards within Europe that seems to have run for at least 10000 years. Depression seems to be on a downwards trend, though it is unclear why that would be the case.
I can also reveal here that we have been scooped! Some years ago, I carried out the same study for ancients using the version of the Reich database. I even posted the R notebook on Rpubs.com in 2019, and tweeted the idea in 2018. I found the same upwards selection. The difference to my study is that I wanted to do some extra validation using pseudo-polygenic scores, i.e., random polygenic scores. This allows one to compute a randomization p value for the selection seen. Since I never got around to completing this (sorry Michael), we didn’t do this study the first. Second, we also looked at the non-European samples, which is interesting because they also show ancient race gaps and latitude correlations, just like the modern data do, but adds extra complexity and probably makes the study almost impossible to publish. However, I am still happy this study was published first because: 1) The authors help us push the Overton window for polygenic scores and examination of group differences, in this case, temporal ones. 2) They used an outdated dataset version and only European samples, so their study is already outdated. In fact, it gets a bit more interesting. Here is the files in my old project directory:
This is the file version we used back in our 2019 unpublished (unwritten) study. 37.2. Now remember back to the version in the paper published? That’s right, 37.2 too. Did they actually just copy some of our unpublished work, even using the same data version? Or perhaps it is a coincidence that they are using the same outdated dataset! Who can say.


