Age heaping is a fascinating method. I blogged about it back in 2015, hoping that someone would take up the idea of fusing this literature from historical economics with modern intelligence research. Alas, that never happened. Lesson learned: if you have a good research idea, do it yourself or it won’t happen. Recently I wrote about African IQs without relying on modern IQ data, using modern other data to impute it with. I found that imputing it this way didn’t really provide that accurate results, with a mean imputed sub-Saharan African IQ of 73, SD of 7, and a range of 60 to 83! The value that Noah Carl had derived using this method just happened to be a low value because using the Worldbank dataset produces relatively low imputed means.
And now comes Peter Frost, commenting on these posts: Comparing an incomparable? I don’t agree at all with his general thrust of argument, but his passage was inspiring:
Noah Carl (2022) has reopened the debate by inferring mean IQ from harmonized test scores and GDP per capita. Sub-Saharan Africa looks somewhat better on the first measure and somewhat worse on the second. Both measures correlate roughly with mean IQ, but the correlation isn’t strong enough to tell us whether the mean is 62, 75, or 82. Moreover, the first measure suffers from the same problem that plagues IQ tests: Africa is just starting to experience the secular increase in mean IQ that the West experienced during the 20th century, i.e., the Flynn effect. By how much should we increase the estimate of mean African IQ to adjust for Africa being at an earlier stage of the Flynn effect?
It’s not true. The Flynn effect has been ongoing in Africa just as everywhere else. That’s why between country IQ gaps based on relatively old data are about the same size as modern data, i.e., the Flynn effect speed is about the same. That itself is curious and also seen in subgroups inside western countries. But we can even compute an African mean IQ without modern IQ data and without imputing it based on modern data, namely, by computing it based on old age heaping data. The data are public, so you can download them too here.
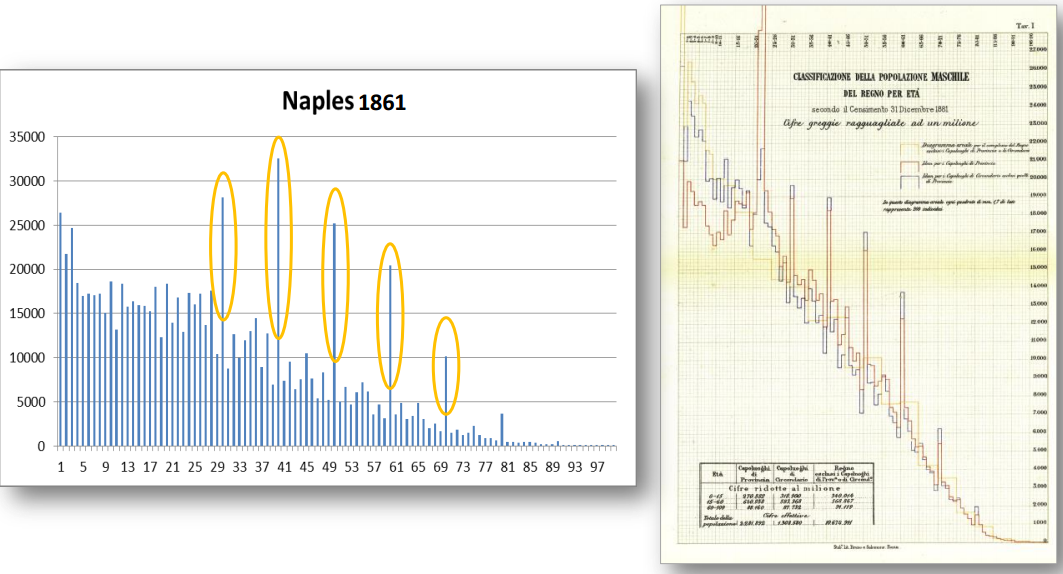
Converting age heaping data across many decades into IQs is not trivial. Age heaping scores (specifically, the ABCC index) can be seen as an approximation of which proportion of a population of the population can correctly compute and report their age. In other words, psychometrically speaking, it is a pass rate of a single item with low difficulty. In modern societies, even young children can state their age accurately, they don’t round to nearest 5 or 10. This is important because the use of a proportion allows one to model the data using beta regression. More on this later.
Why can one not just use a simple method? Because of the ceiling issue:
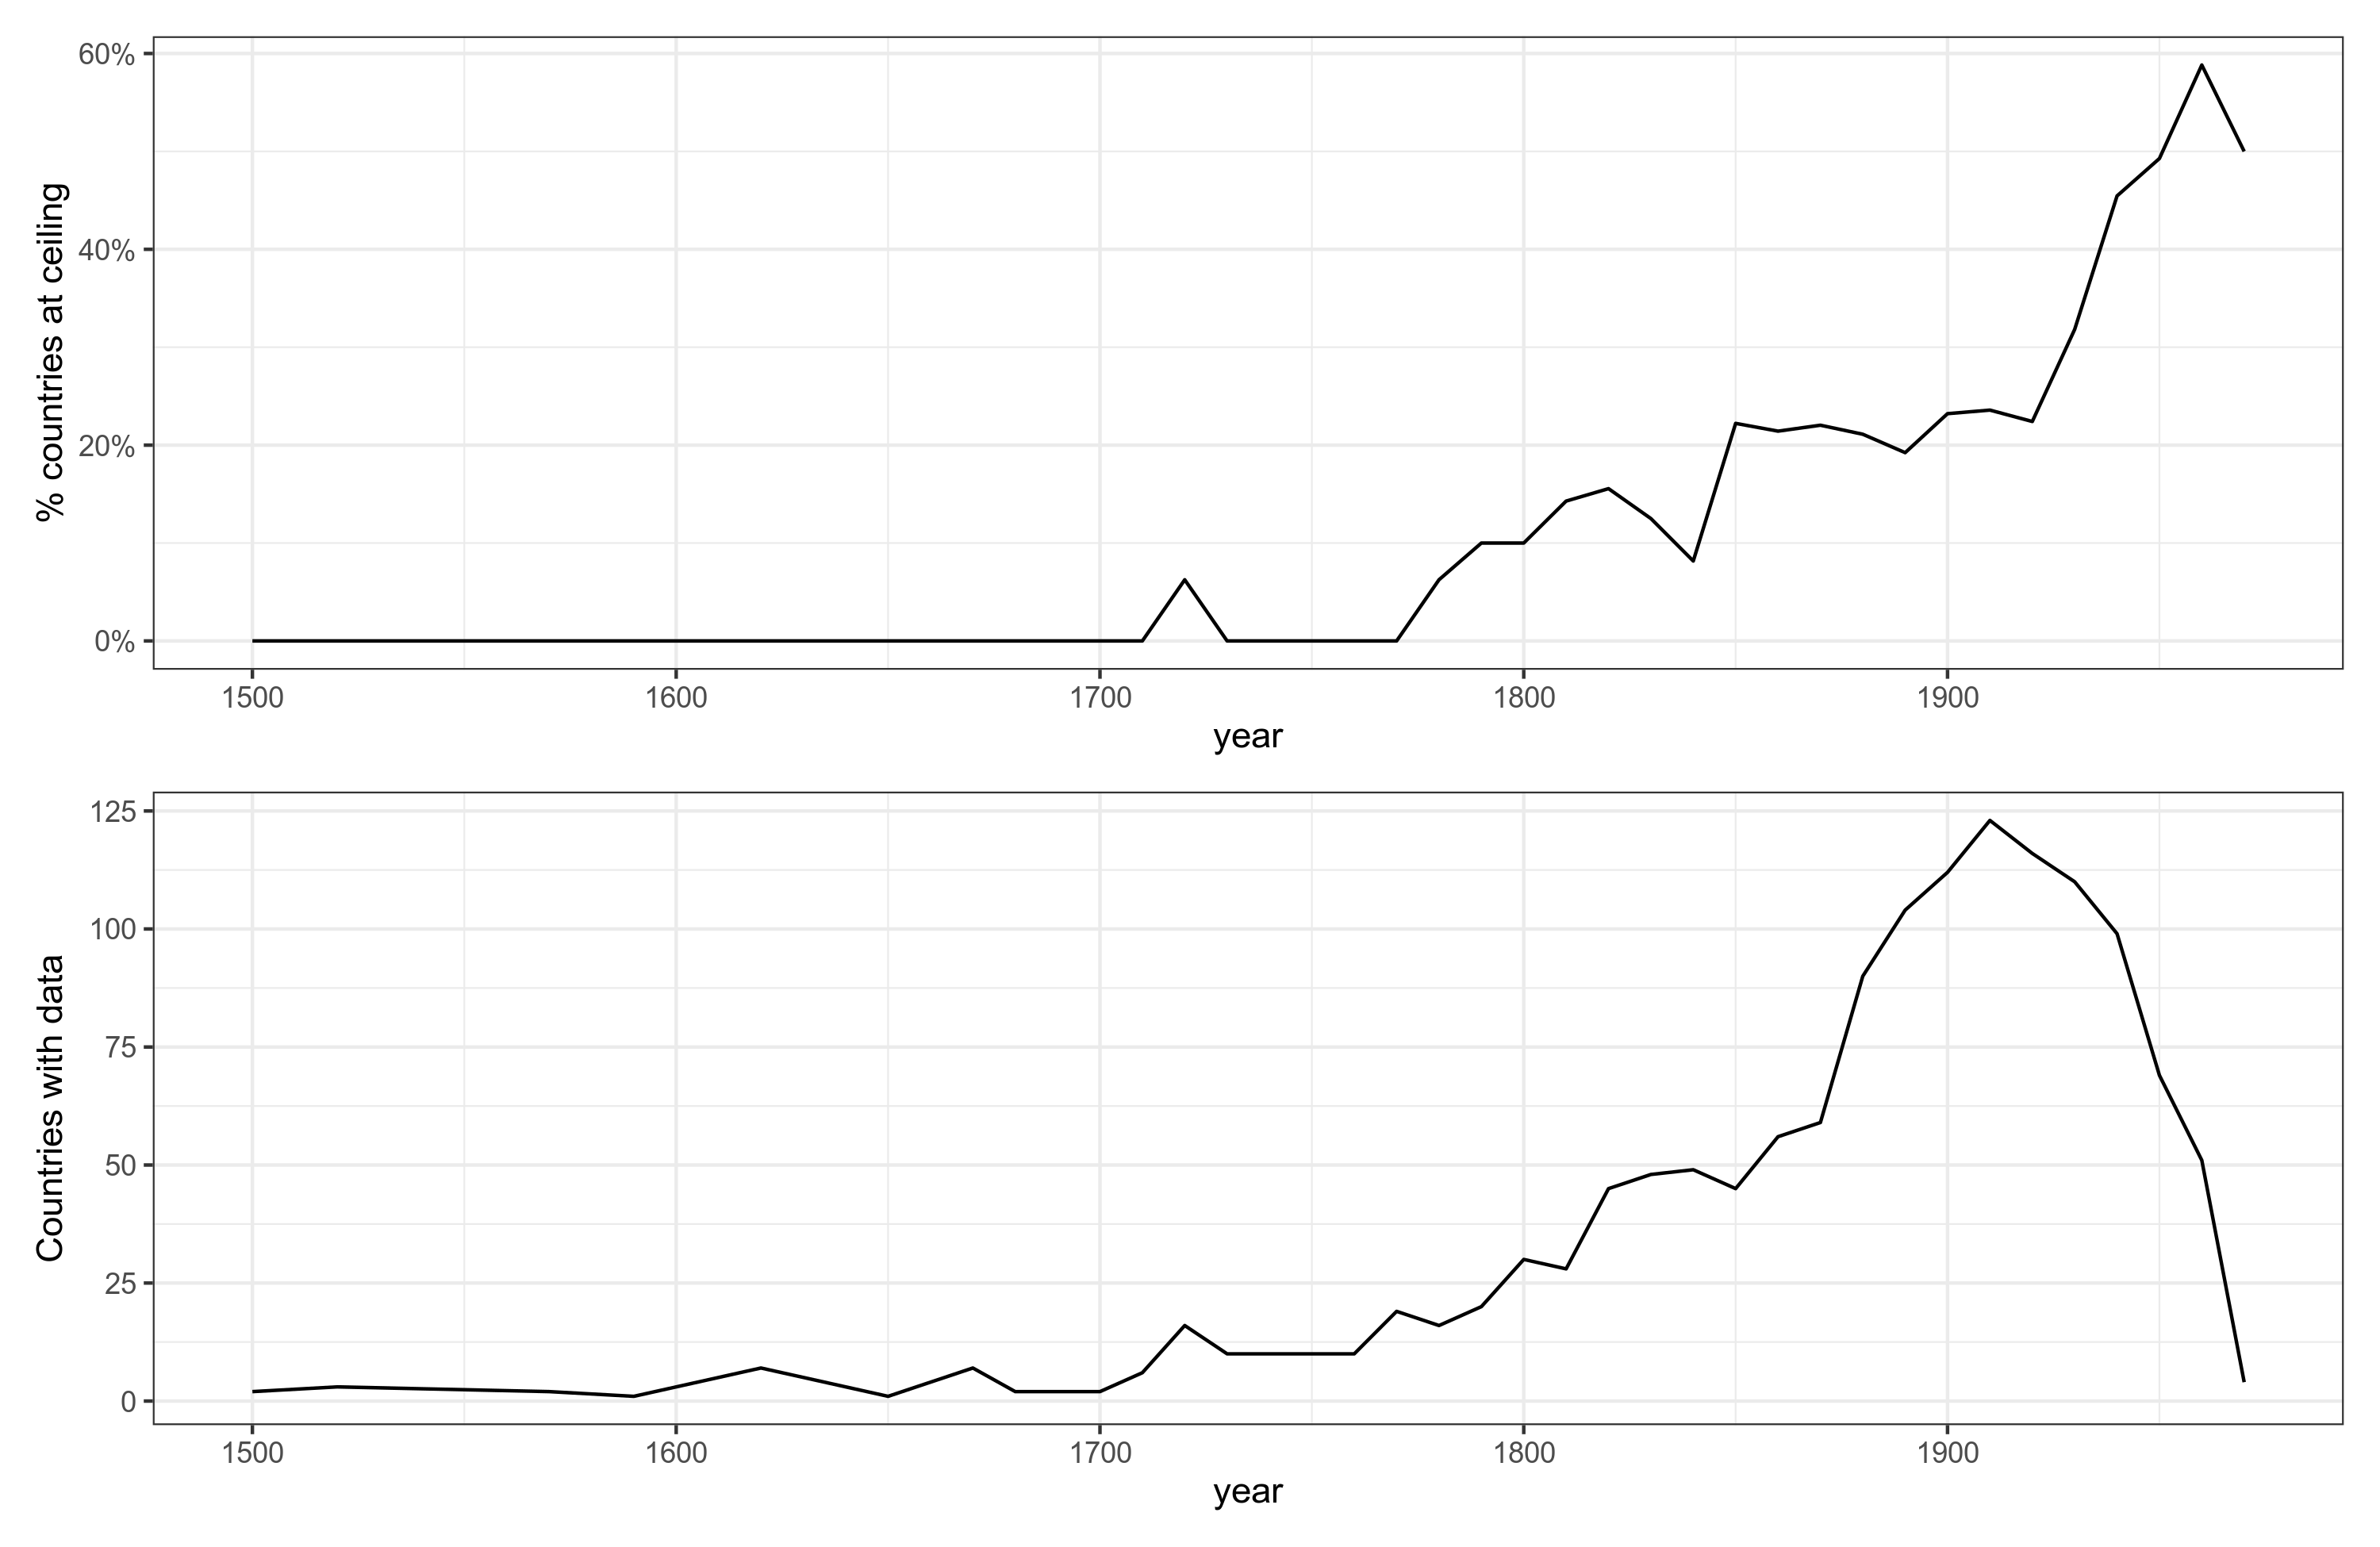
So, the later years have more ceiling issues, but also have more data, especially in the early 1900s. Why are ceiling effects an issue? Here’s the 1910 z-scored age heaping data compared with Rindermann’s national IQs:
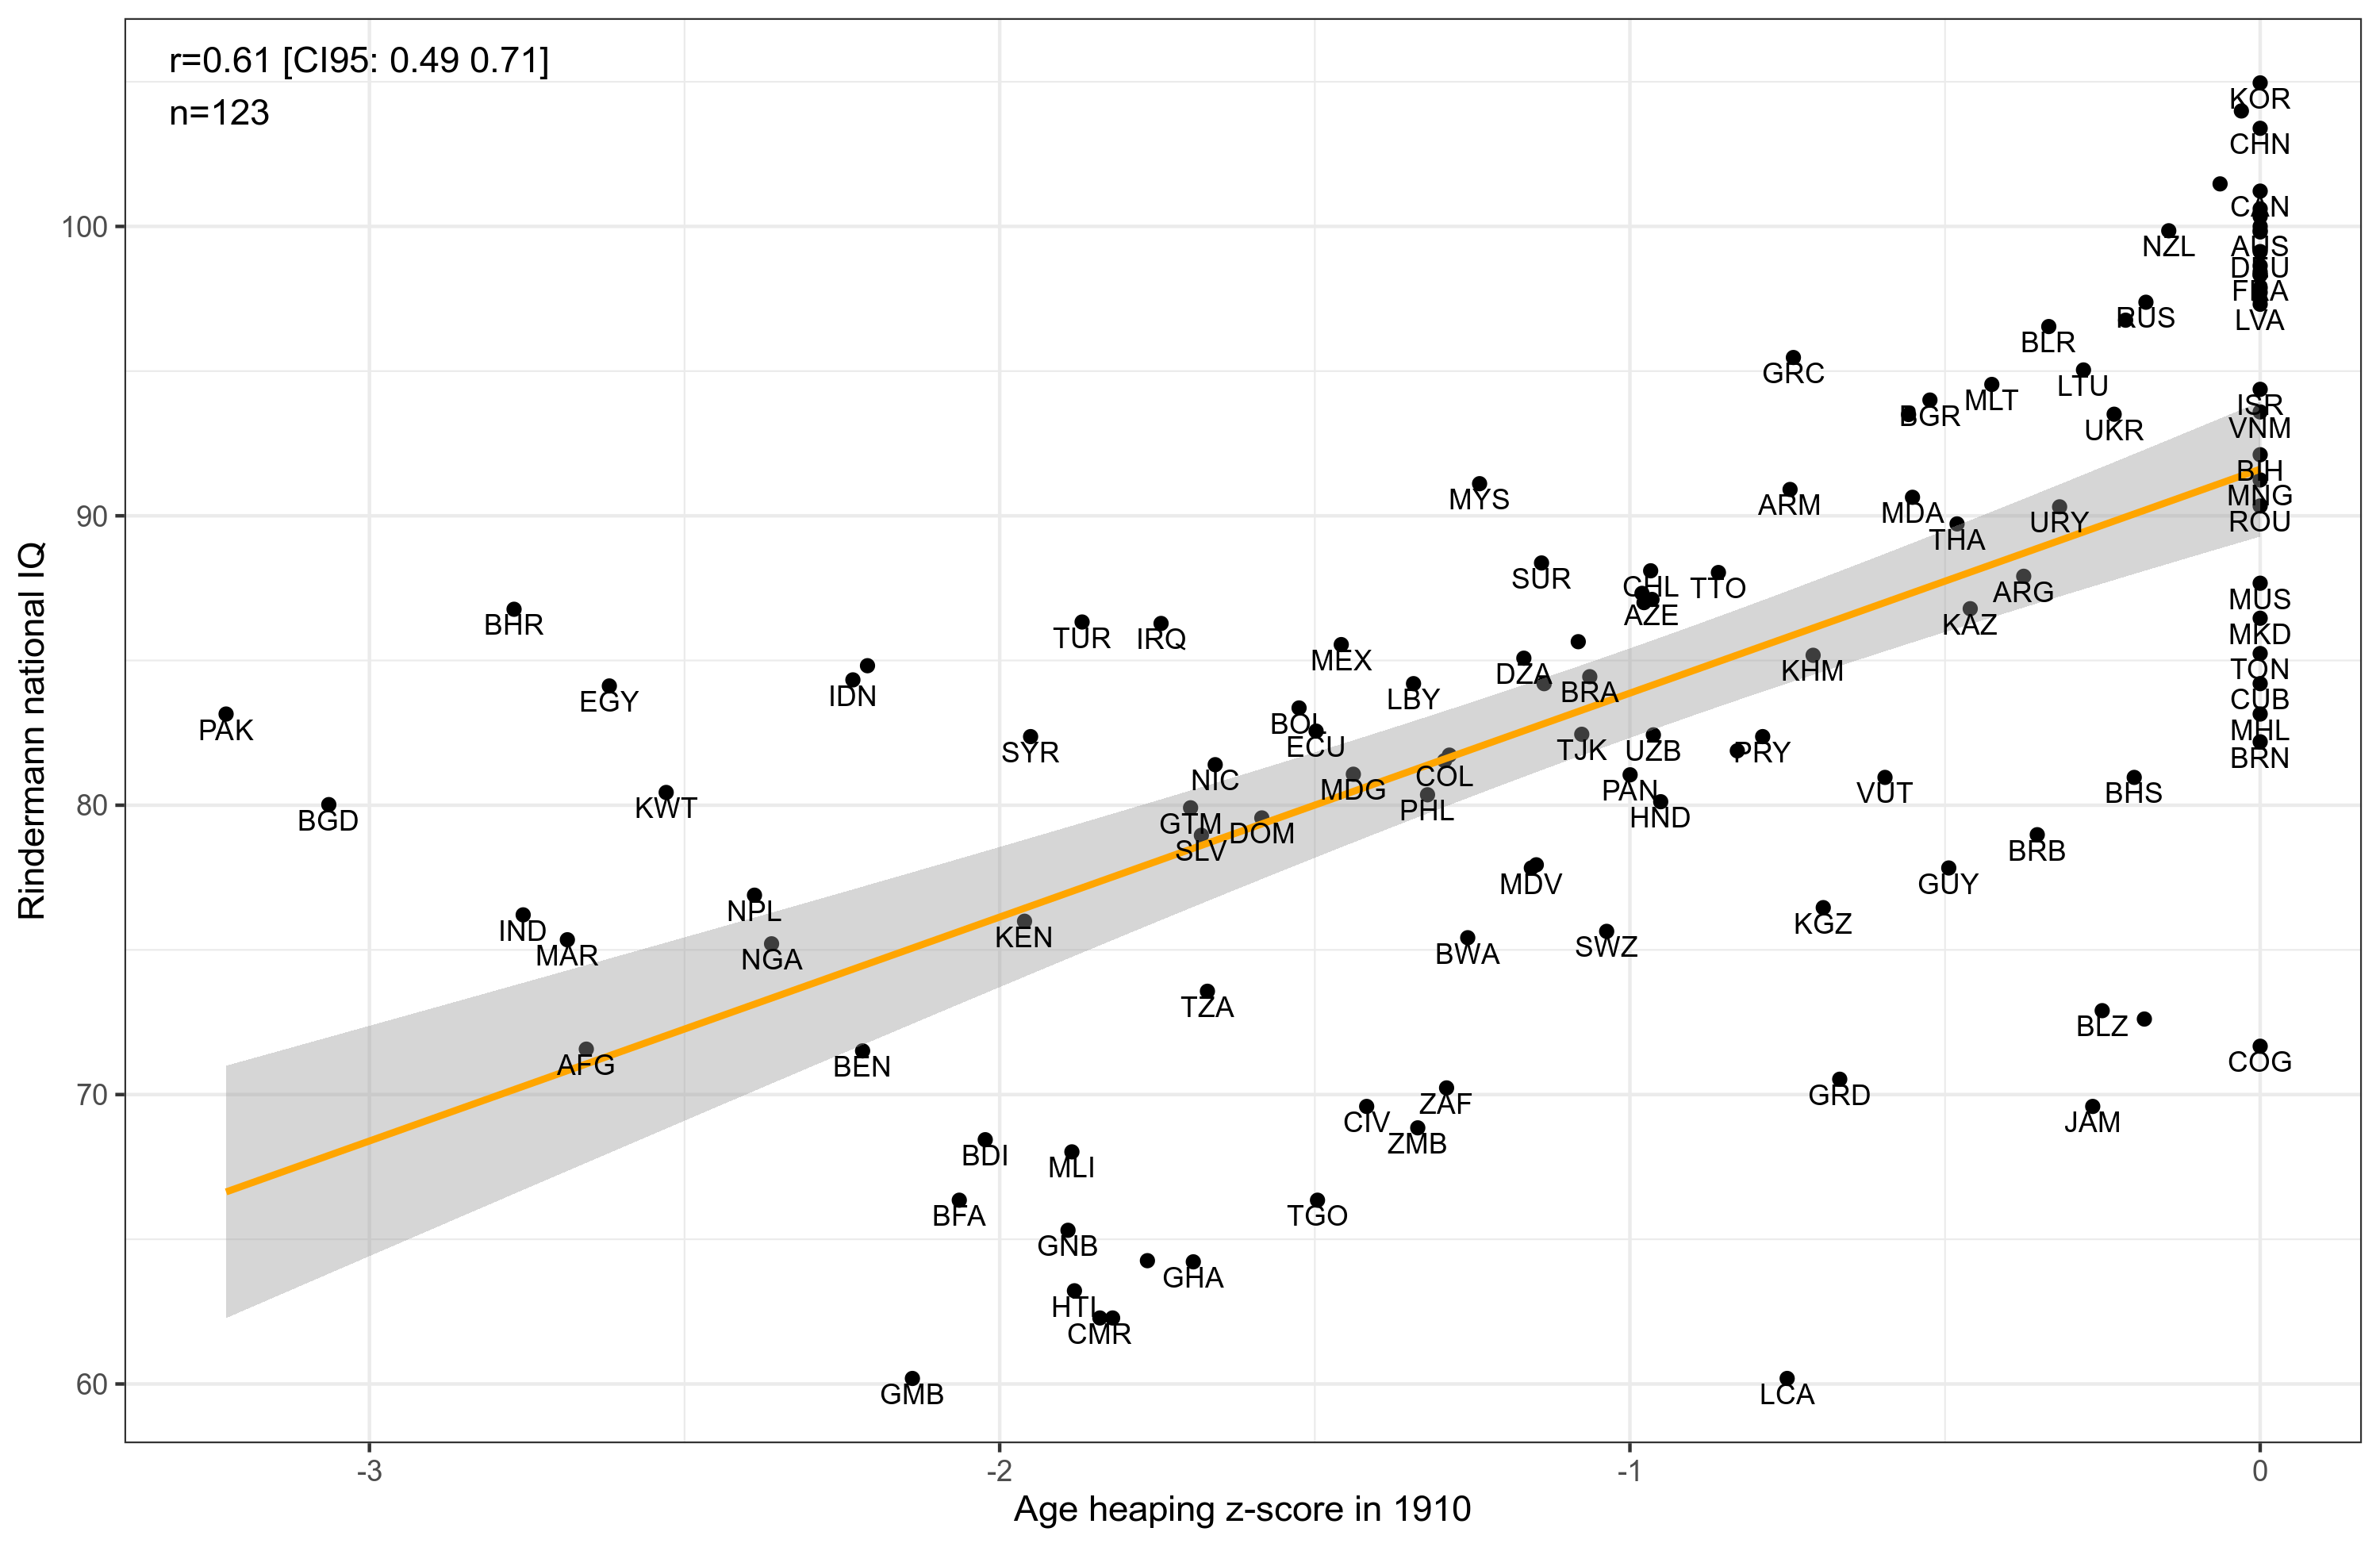
You see the issue. There’s a lot of countries at z = 0, i.e. at pass rate of about 100%. But it gets more complicated. To average the various years of age heaping data, one has to put them on the same scale. The scale to use is the z-score scale, which we get from using the inverse normal transformation from the pass rate that (that’s why it’s important it’s a pass rate, approximately). Then, because different countries provide data in each year, we choose an index country that is present in many years and which didn’t change so much (we hope). Argentina is the country with the most data. Unfortunately, it had a large demographic change (for the worse), so I used the country with the second most data, France. Then, for each year, we transform the data to z-score, then subtract a value so that France = 0. After this, we can average the years of data. This method works well when there are no ceiling issues in the data. When there is a ceiling, averaging the data produces errors because all the countries at the ceiling are then assumed to be equal IQ. As you can see in the plot above, this results in South Korea (KOR) and Brunei (BRN) being given the same score, despite some 20 IQ gap between them! A big issue! One can mostly avoid this issue by limiting the years to years without so much ceiling effects, which means looking at the yearly plot from before and making a hard choice. It gets worse even yet. Some of the countries are only present in the later years, especially the countries we most care about. As such, we can’t just throw away the 1900s data that suffers from ceiling issues. Thus, long story short, this is why we don’t just rely on z-score conversions but have to use beta regression. It’s a type of regression model that works with continuous data that is bounded by 0 and 1. That is, it is the continuous version of logistic regression type models that also work with 0 and 1 bounded data, but which can only be 0 or 1 (i.e. discrete). As our data are a proportion, this is the right fit.
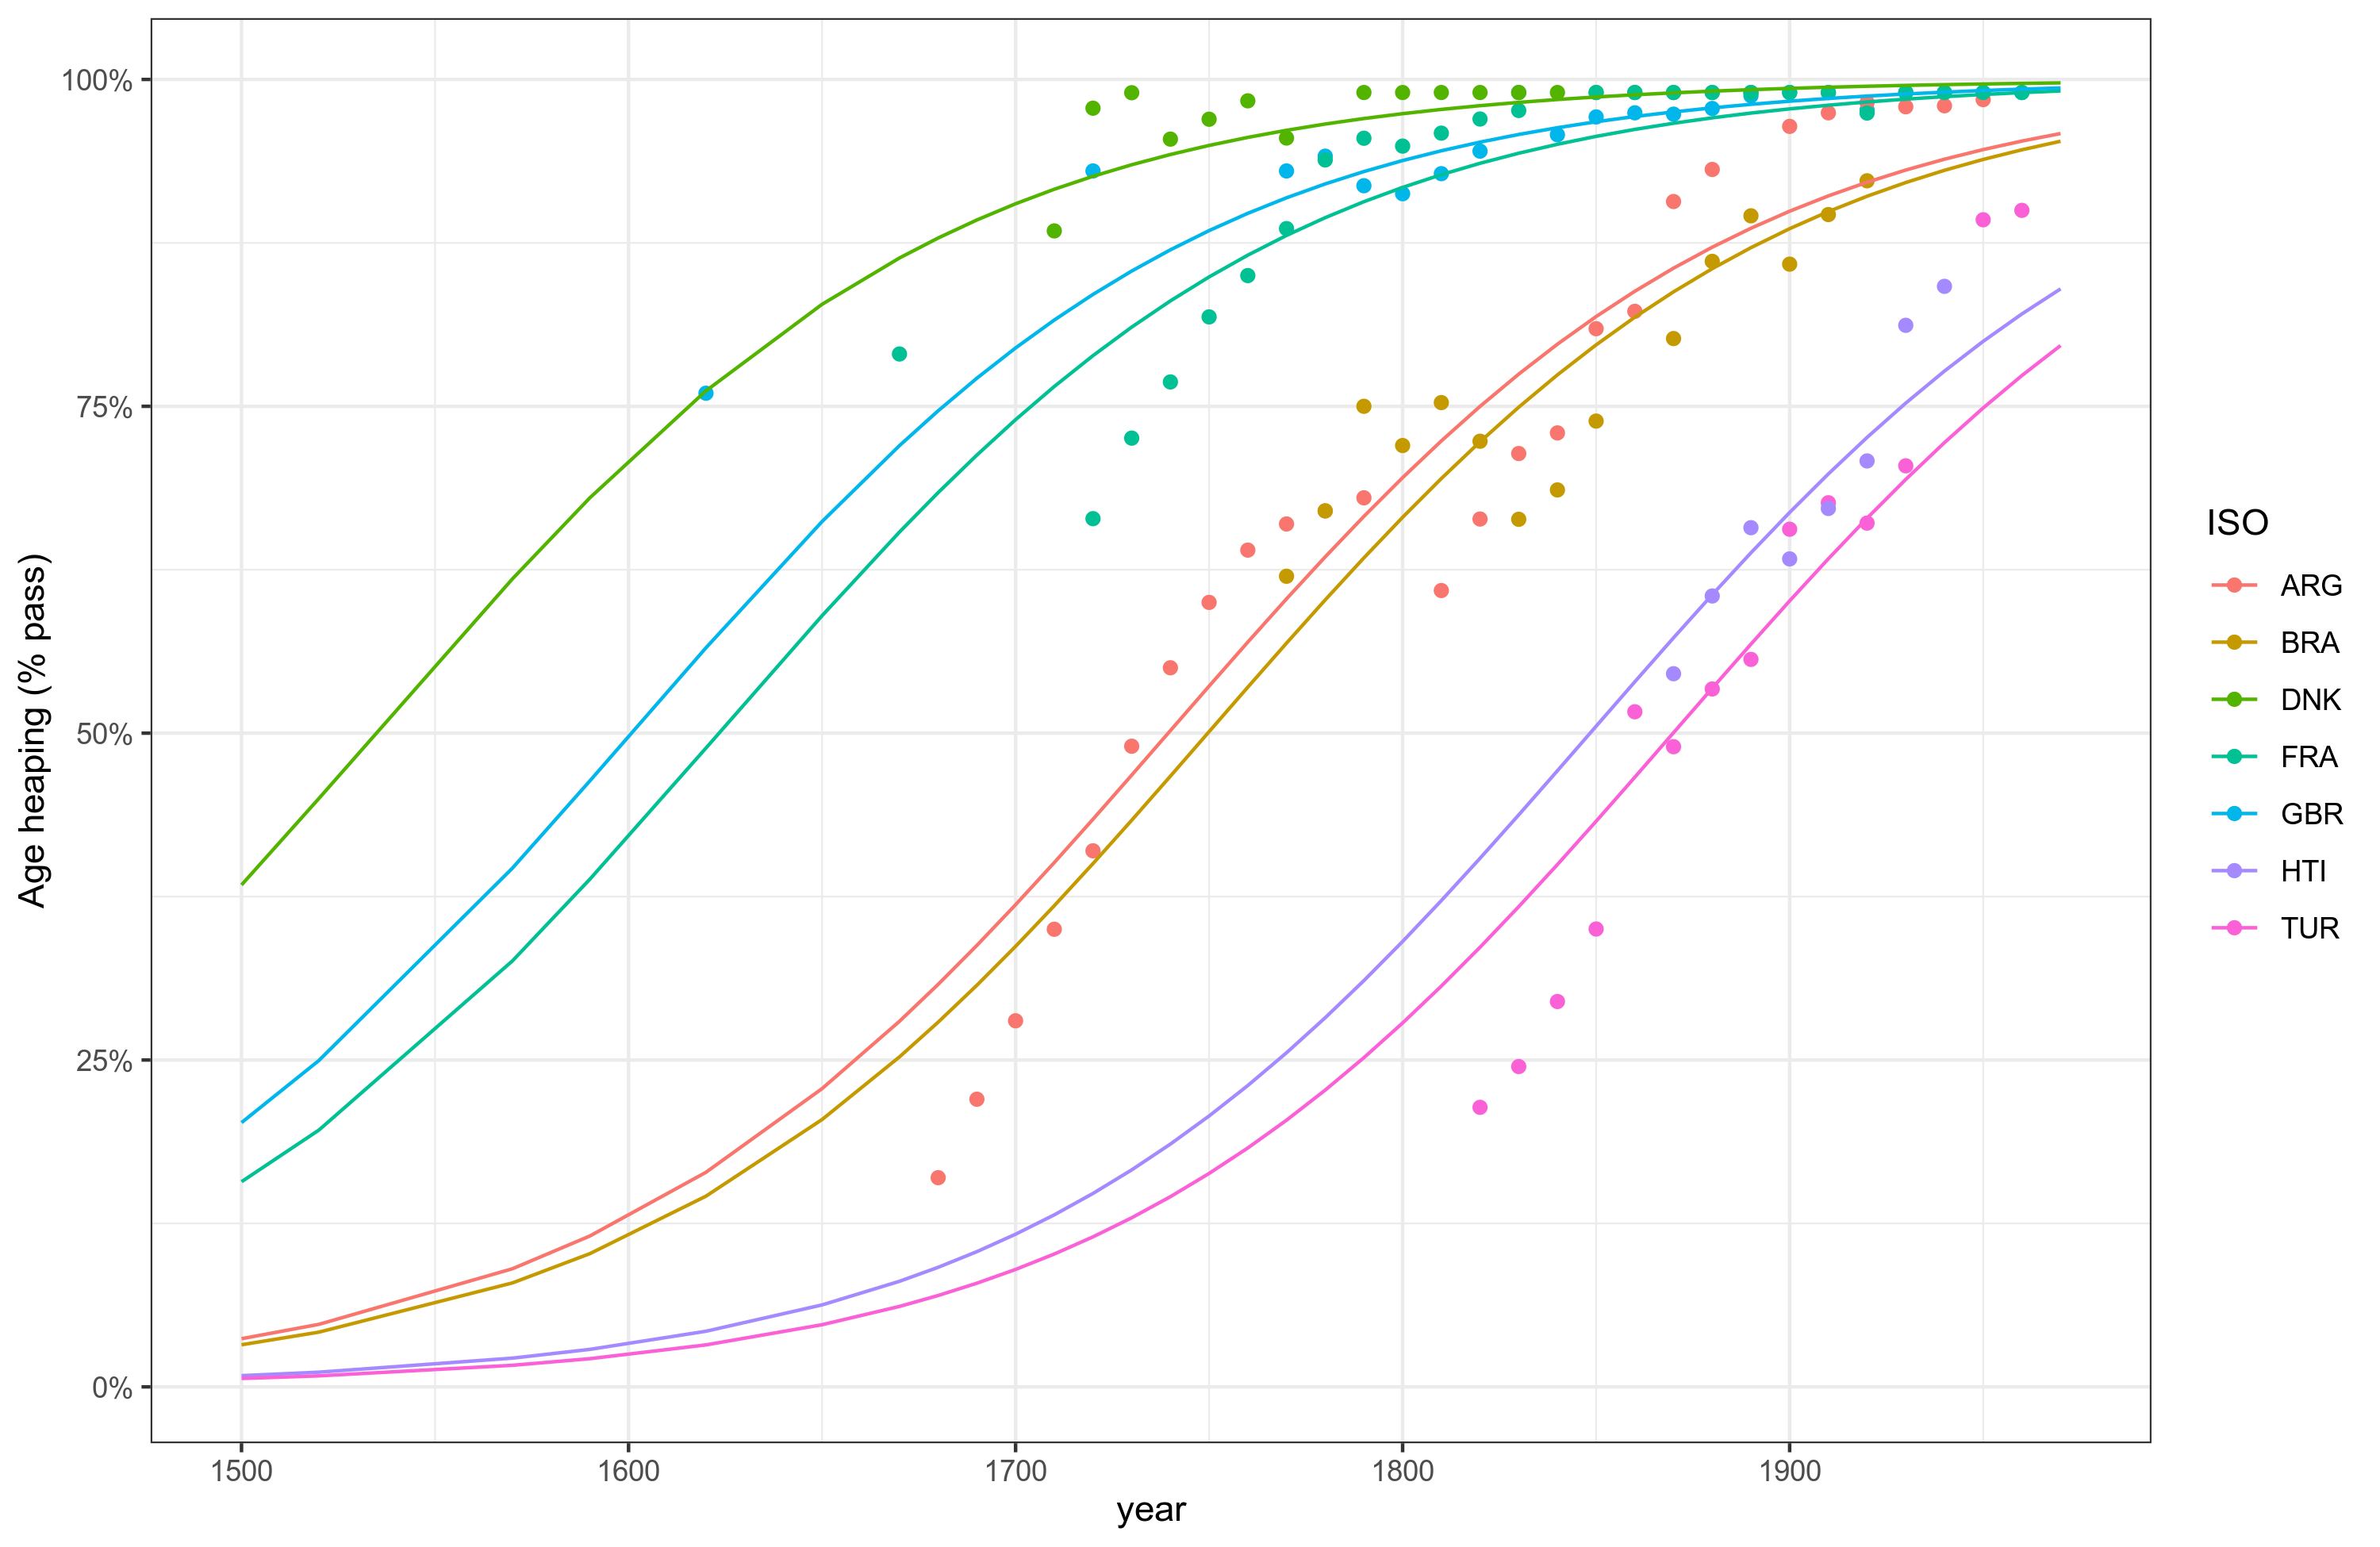
How does beta regression work? Well, consider the growth pattern of a set of countries, i.e., the Flynn effect for numerical ability to compute one’s own age:
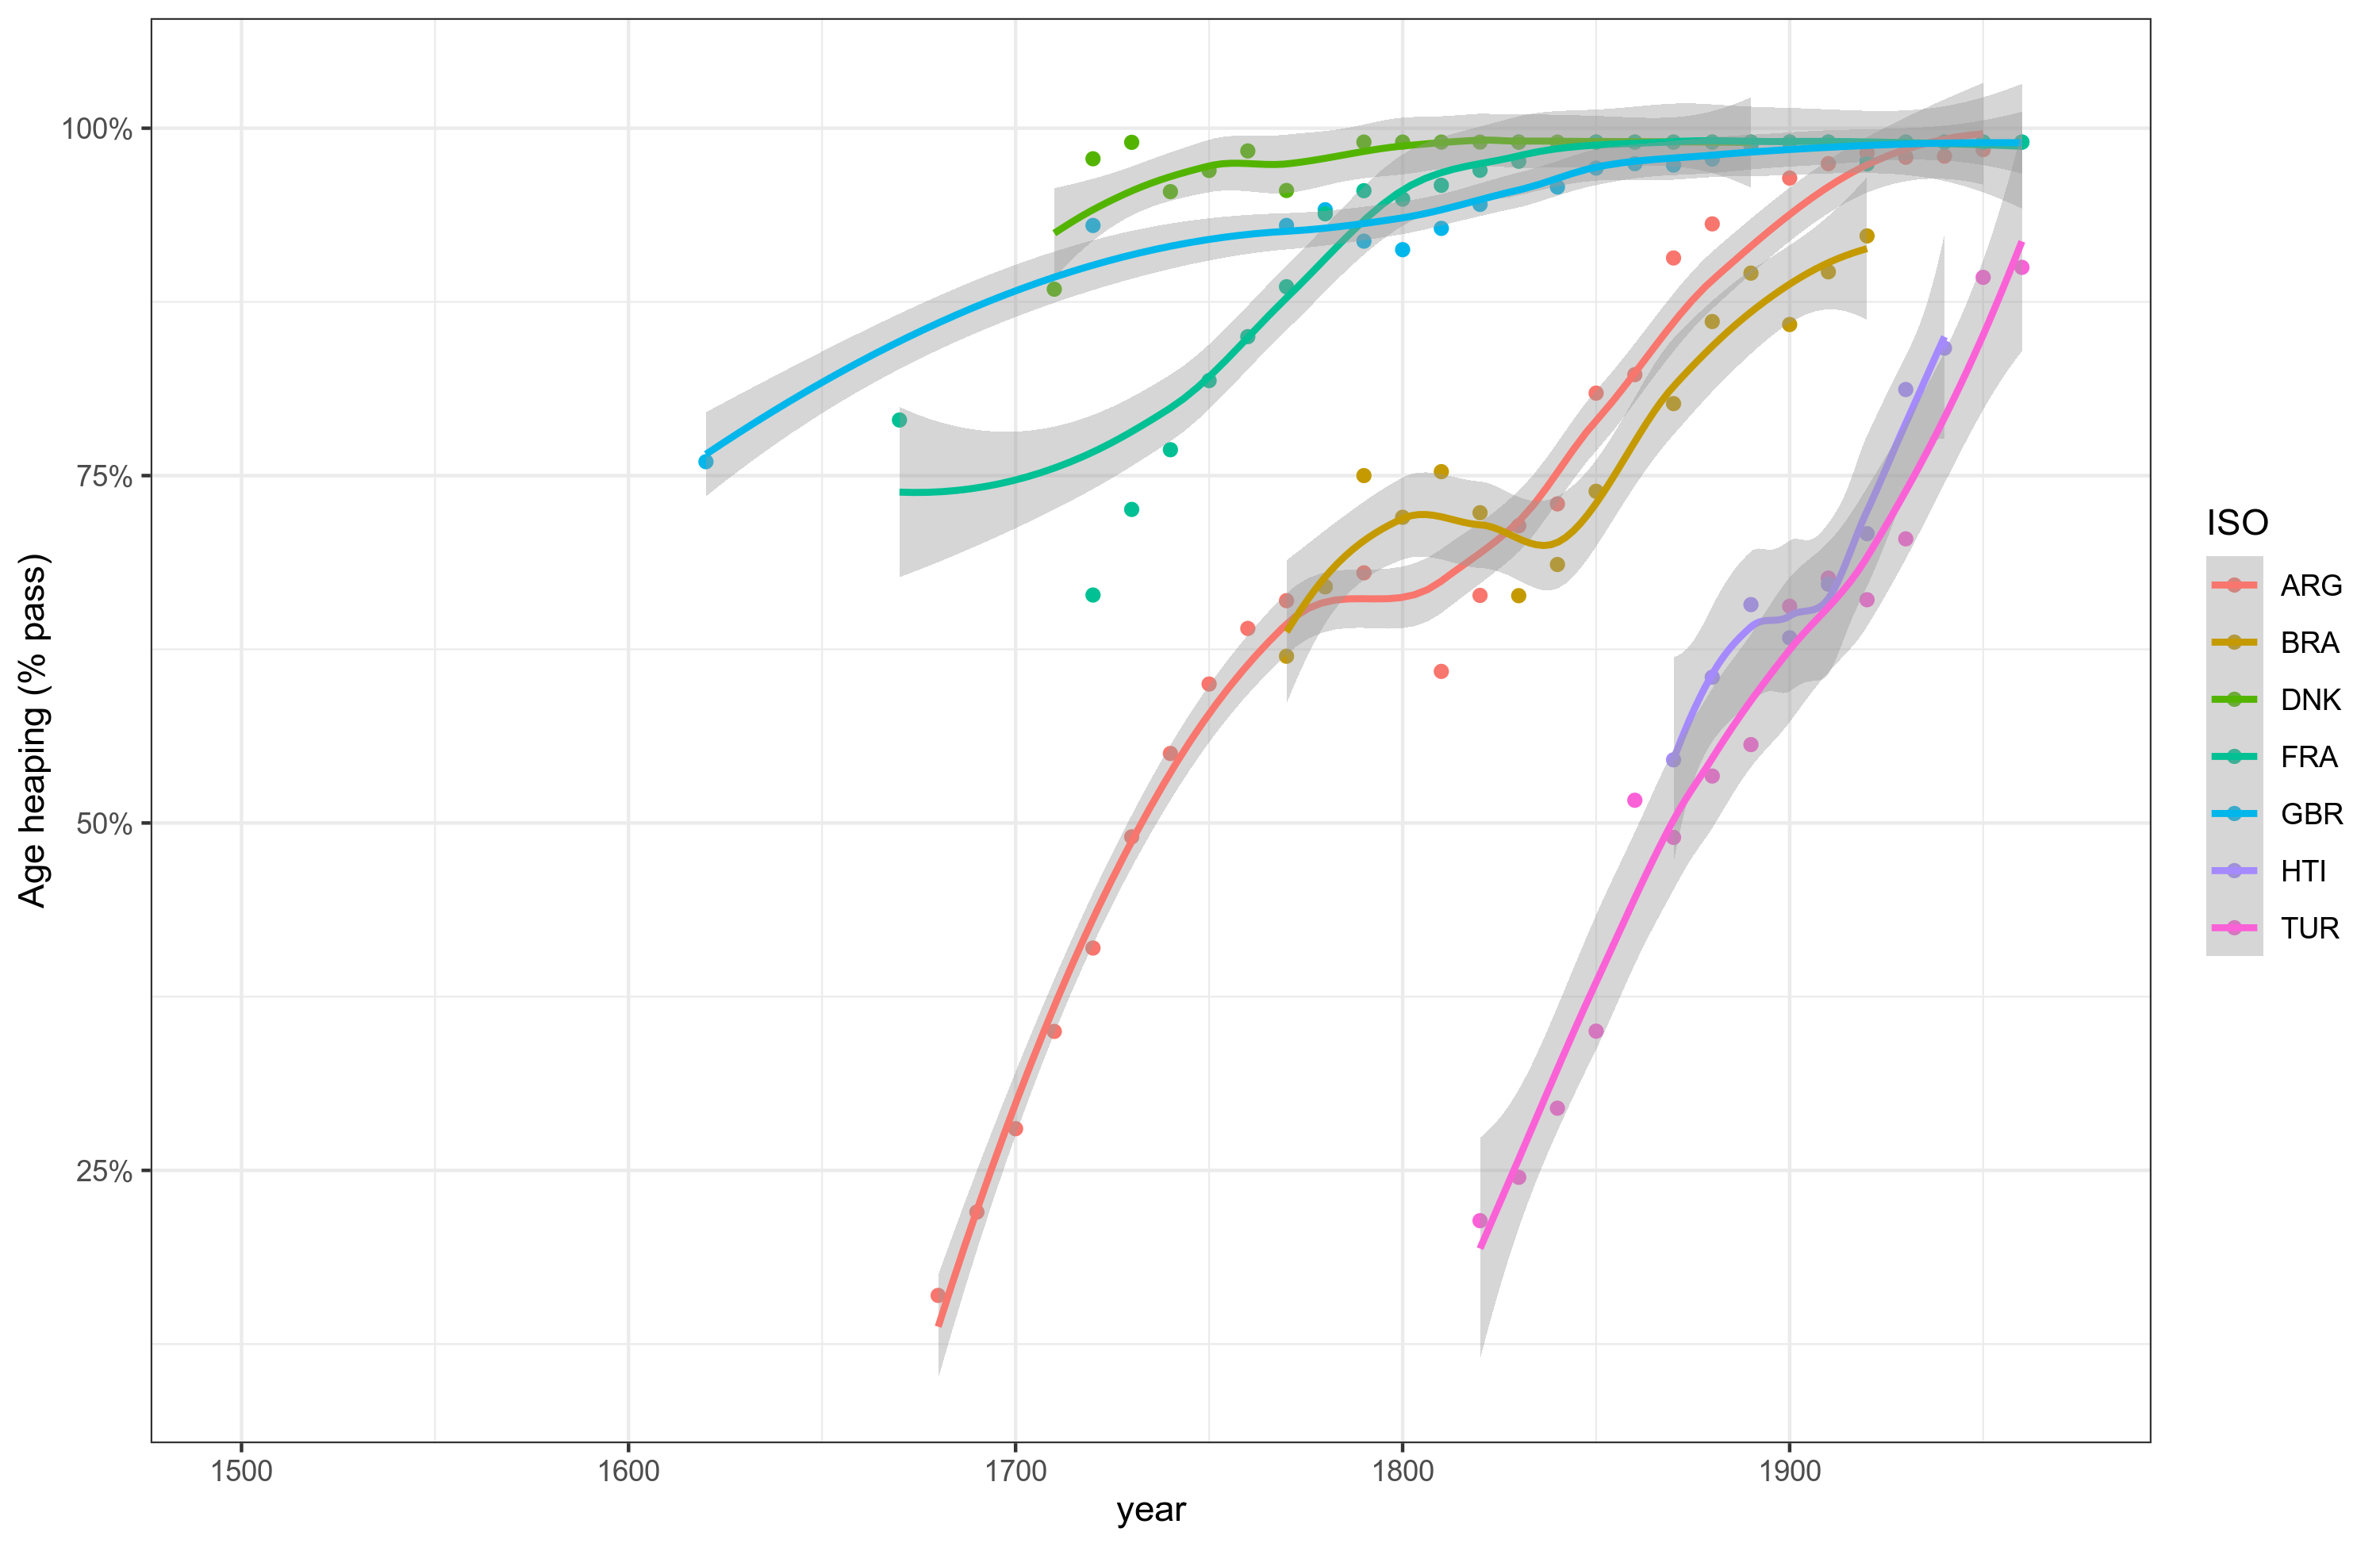
(The line fits are just smoothing lines, not beta regression predictions.) We see that already by early 1700s, Denmark had reached near universal numeracy, while others had to follow up later. France hit ceiling in about 1830, others later yet. The way we can model the data here, then is a two predictor approach. We posit that there is both a yearly effect, i.e., Flynn effect that increases over time. There are also country fixed effects, where some countries are better than others. We can also allow the the growth slope to differ by country, as clearly some grow faster than others. But we are mainly interested in the fixed effect of the country. Modeling the data this way, we get these model predictions:
Here the model ignores between country differences in growth rates (and forces equal intercepts), and the lines don’t find so well. But the overall pattern fit is about right. So let’s add an interaction with country and year:
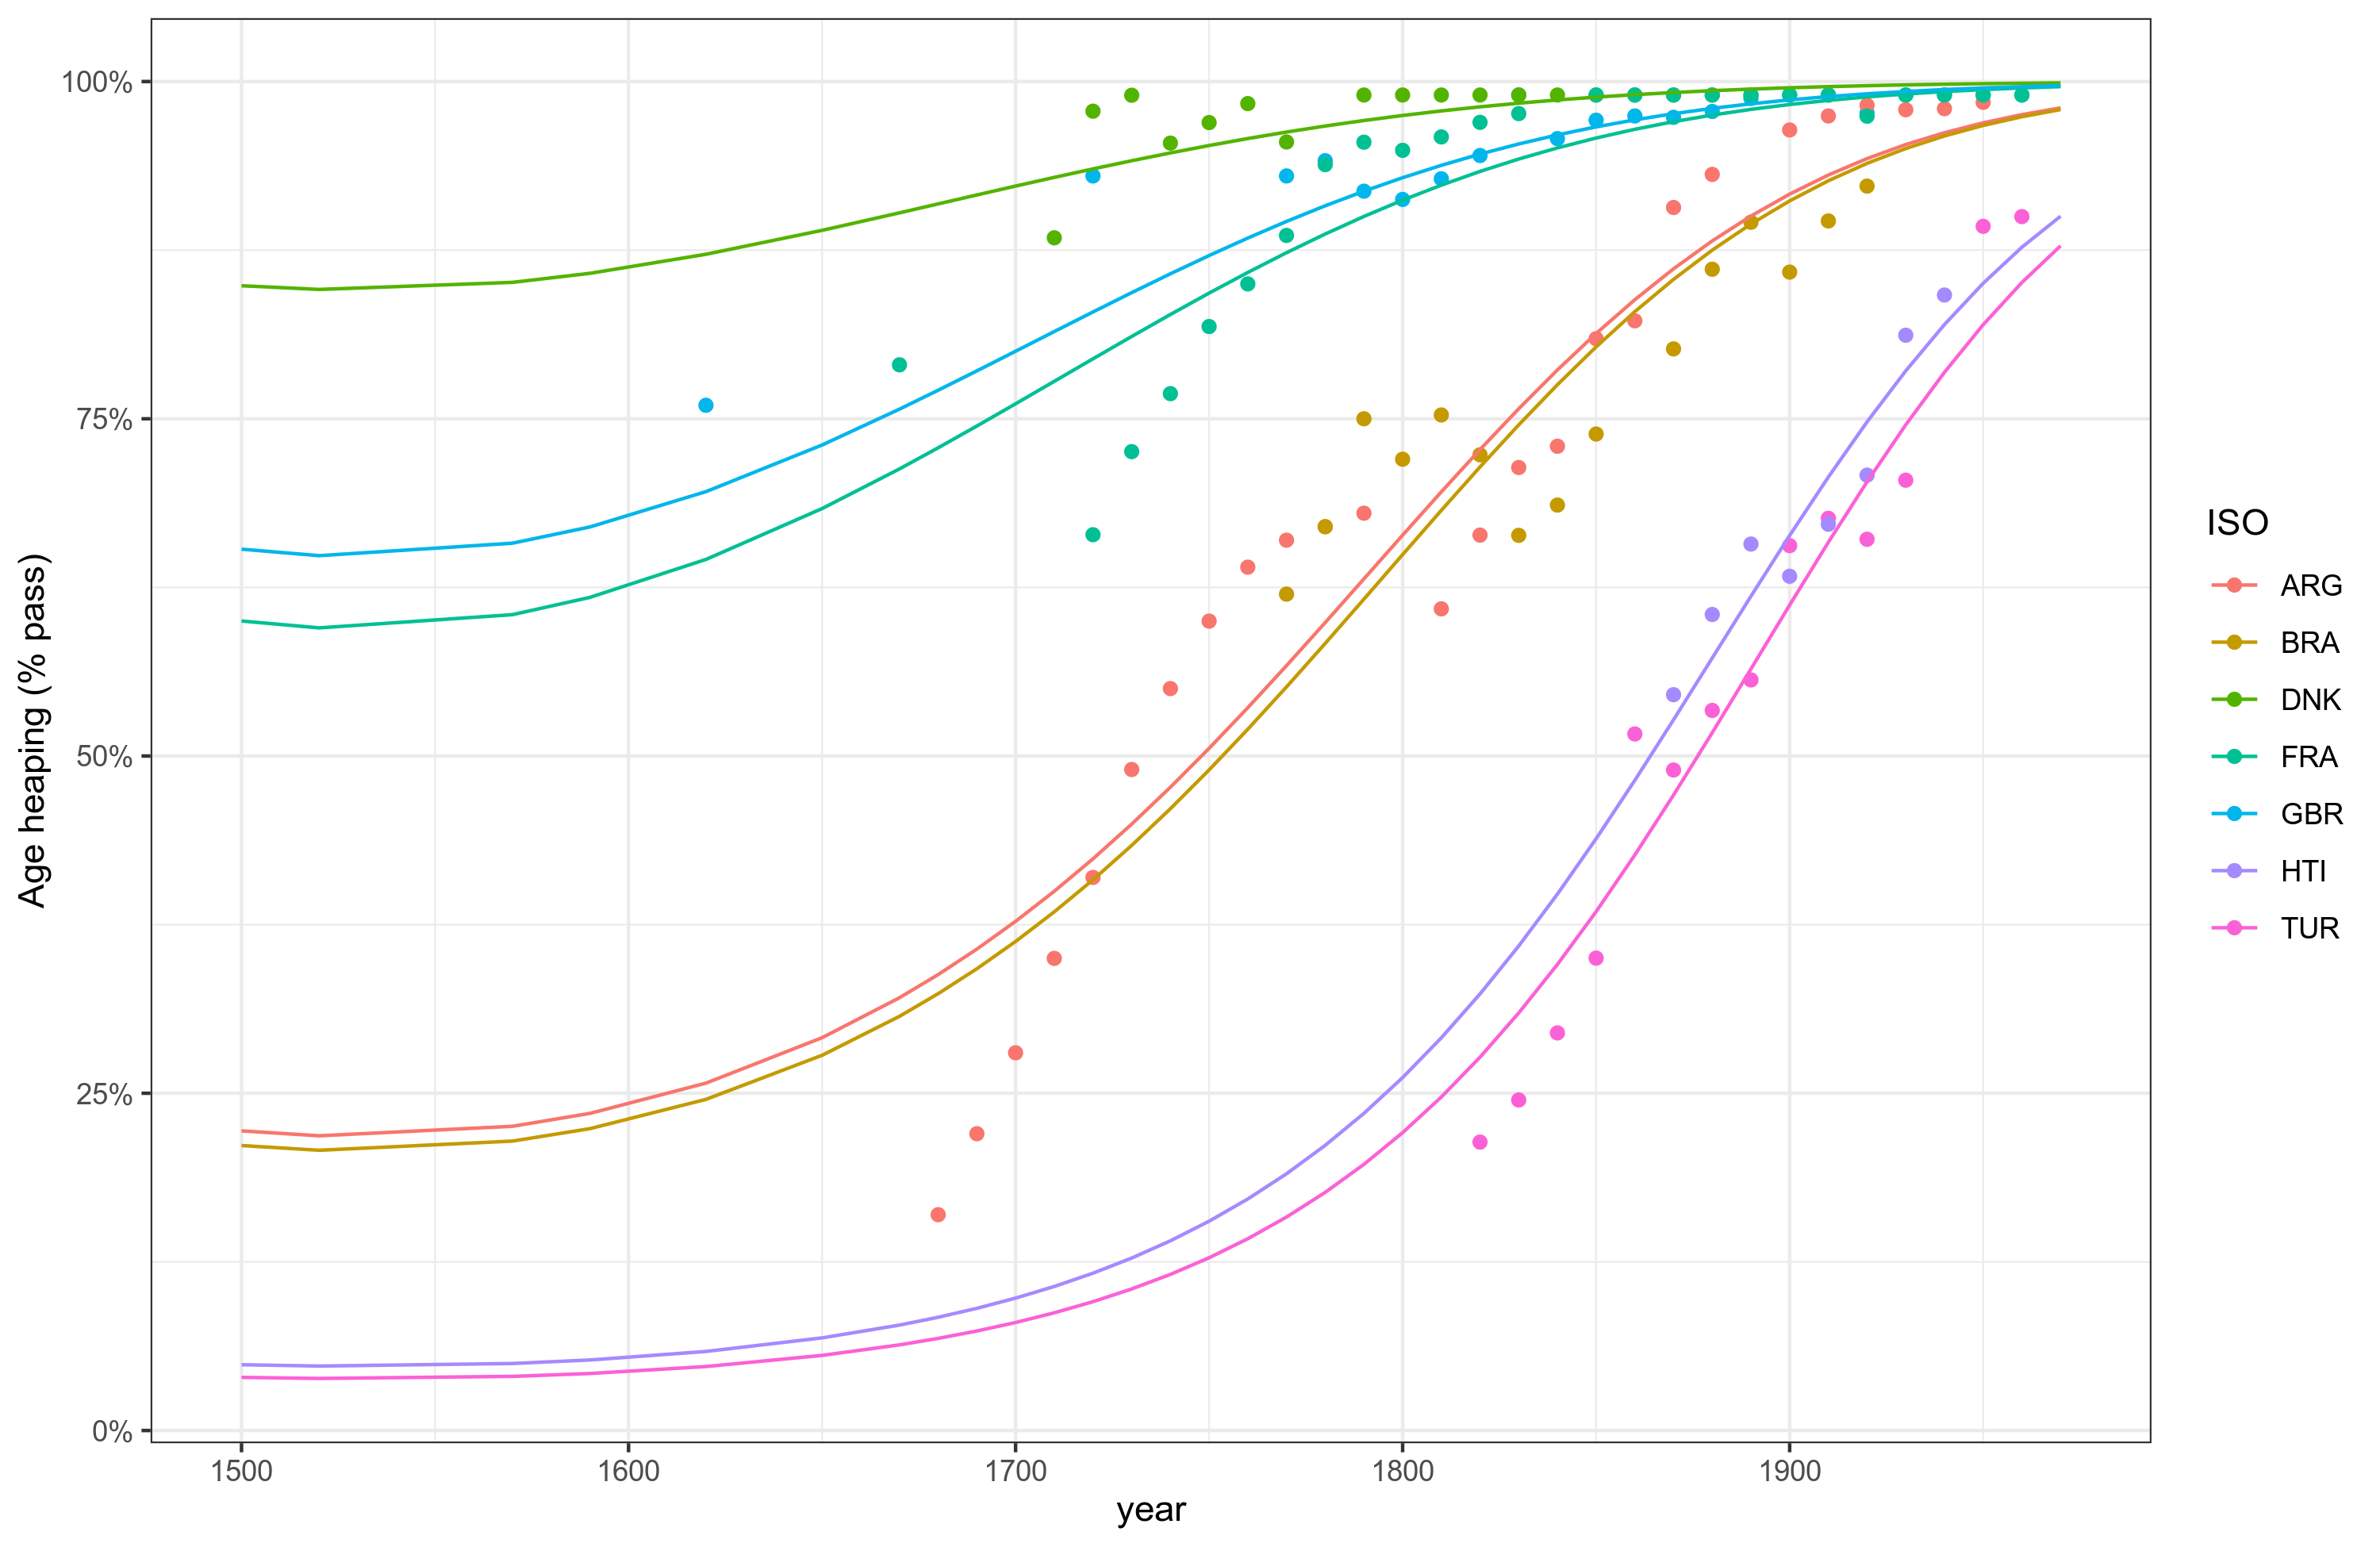
So now the lines are better fit, though we see that the y intercepts are crazy. Theoretically, no country should start out with having a large fraction of the population numerate! The lines should all intercept at 0 at some long time ago (e.g. year -2000), and then start increasing at different times. Since we have some countries where we never observed low numeracy in this dataset, it is not possible to estimate the right model properly. But maybe this is good enough. I also tried a Bayesian beta regression model for good measure. It was slow and produced about the same as the first Frequentist model. A Bayesian model with the interaction failed to even start to fit, which is unfortunate, as that was the most important model that could benefit from Bayesian advantages. If someone knows how to get this model to fit, please share your results.
If you are wondering: yes, there are still countries that show age heaping, so they are 300+ years behind Denmark in this skill. E.g. rural Indian villages in 2010.
OK, enough talk. So how well does age heaping IQs compare to modern IQs?
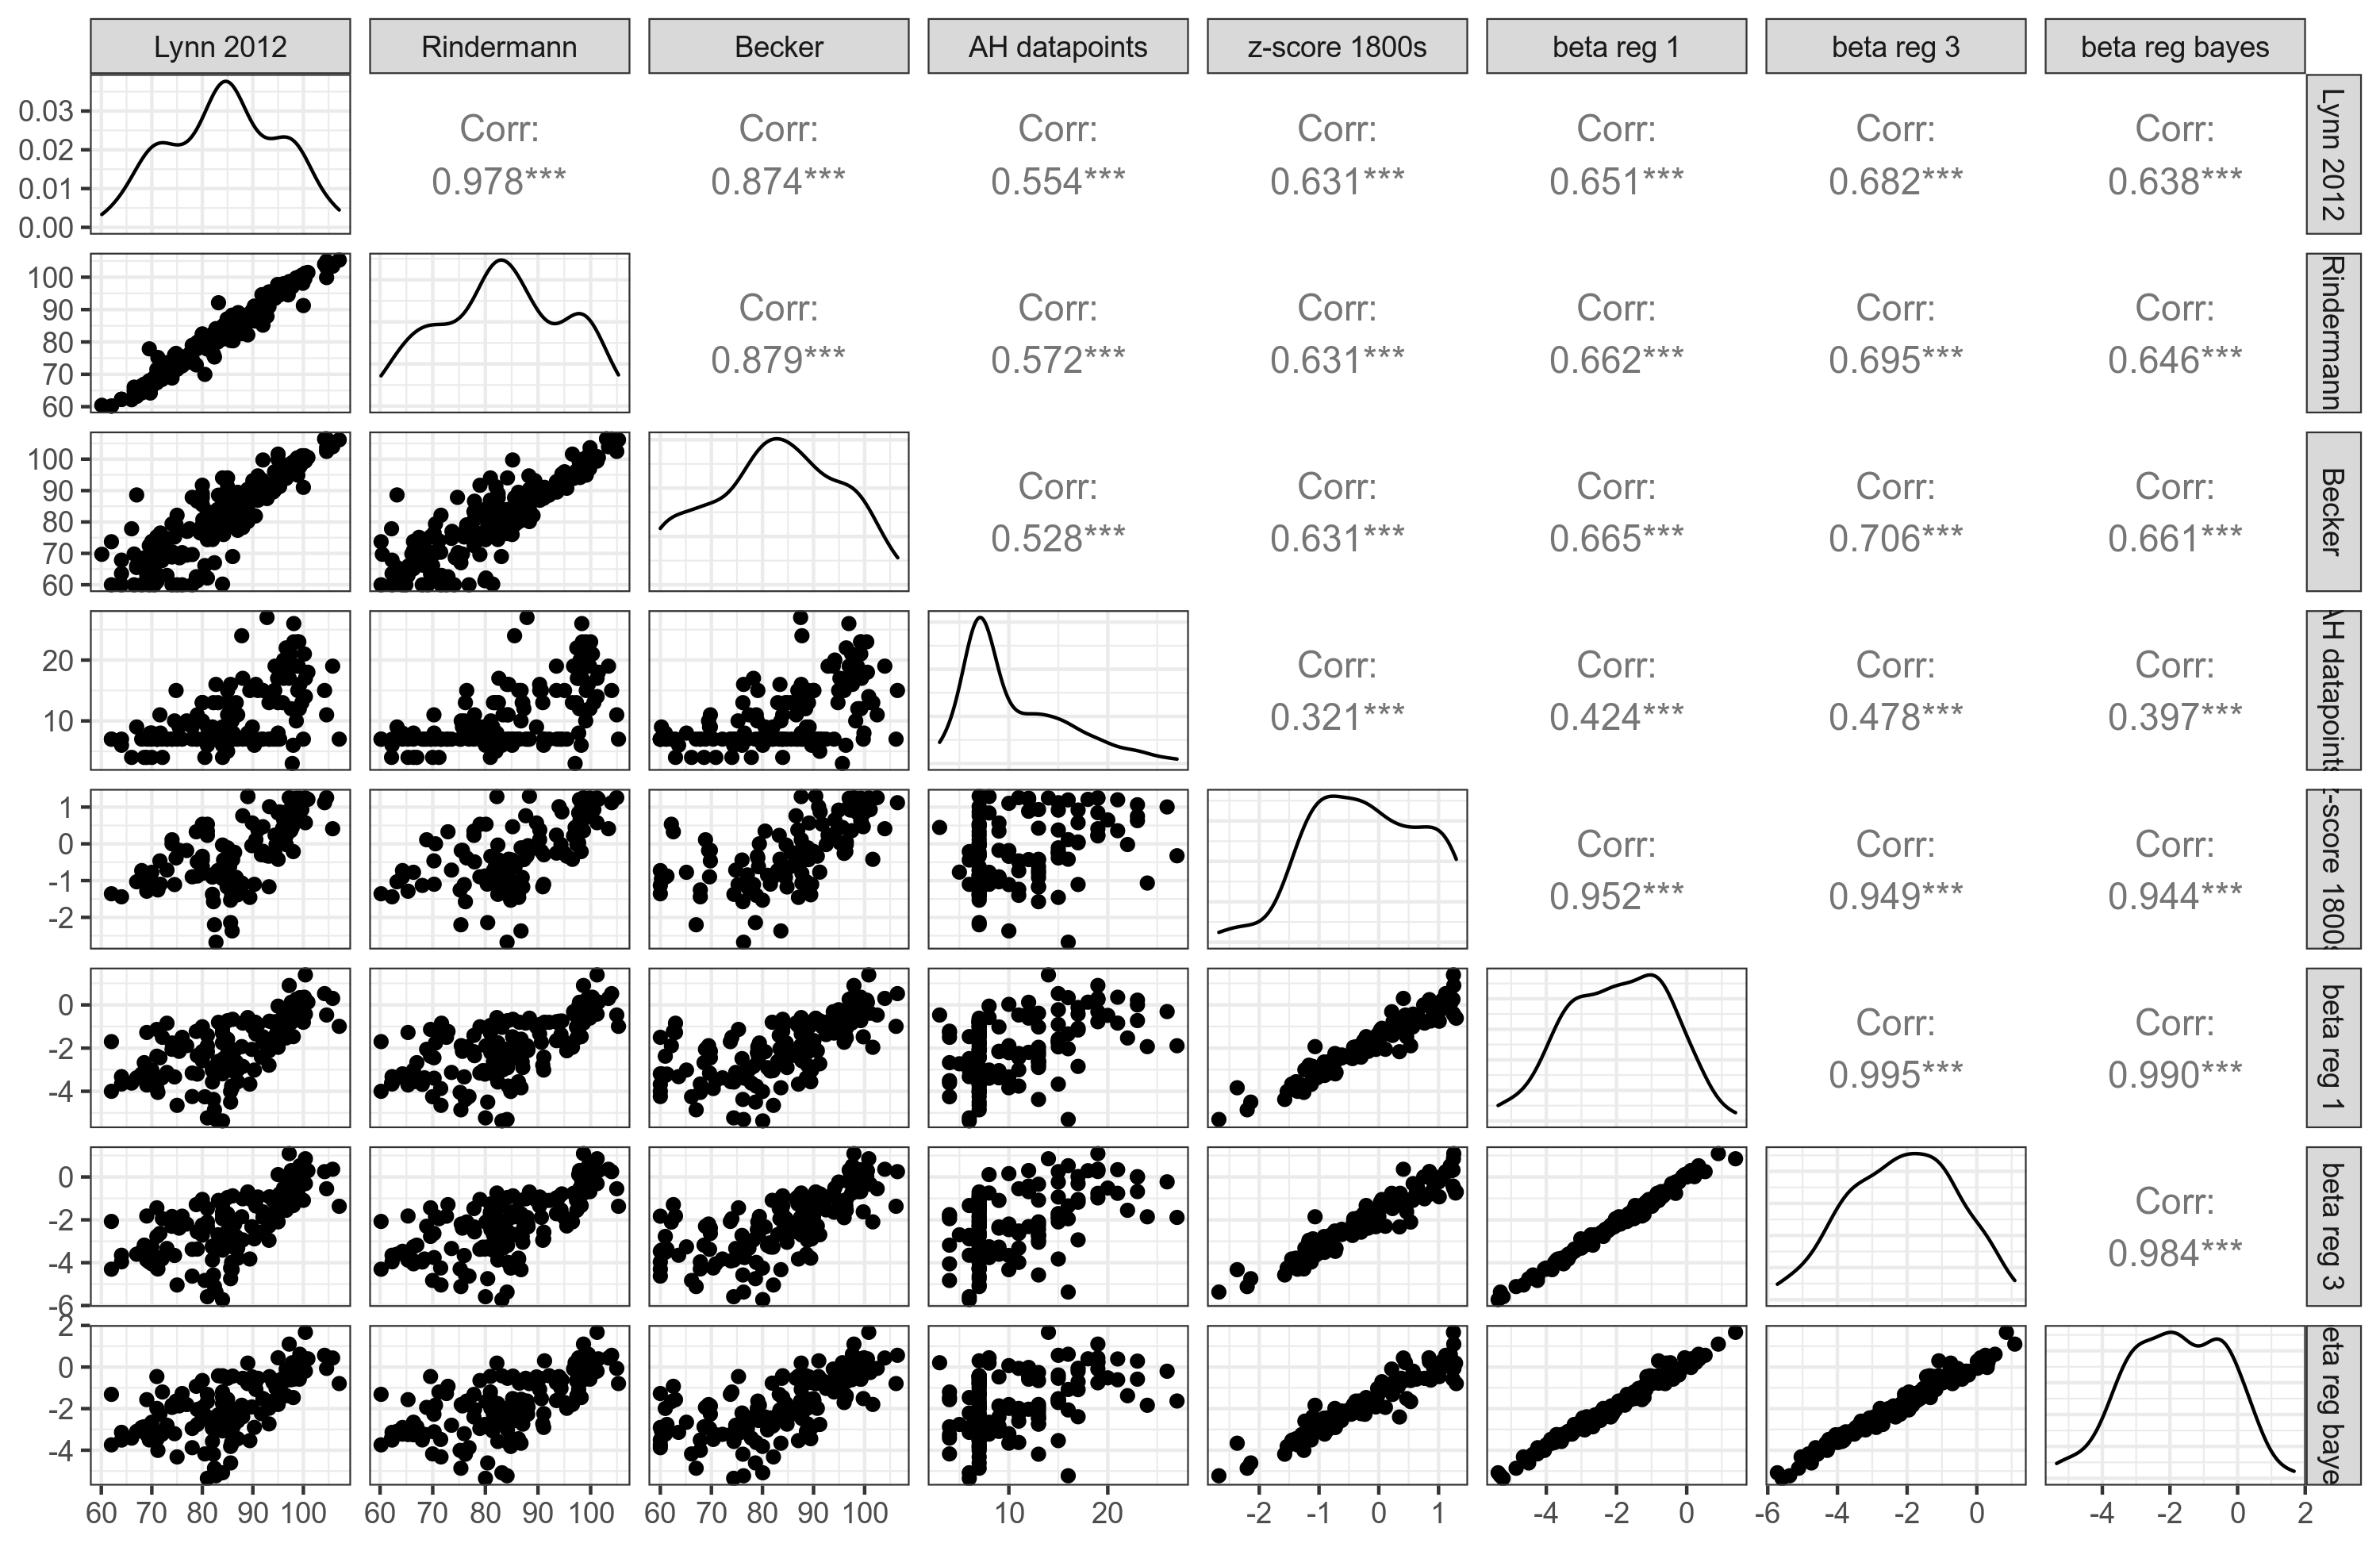
Beta reg 3 is the model that allows for different growth rates for countries. This produced the best overall results, i.e., strongest correlations to our national IQ measures. Still, the correlations are not great, they are only about .70 at best. The various age heaping methods correlated very strongly, at least .94 with even the suboptimal z-score method. Still, considering that they are based on totally unrelated data from 100s of years earlier (in many cases), this is kinda impressive. Let’s look at Rindermann’s IQs and the best age heaping IQs:
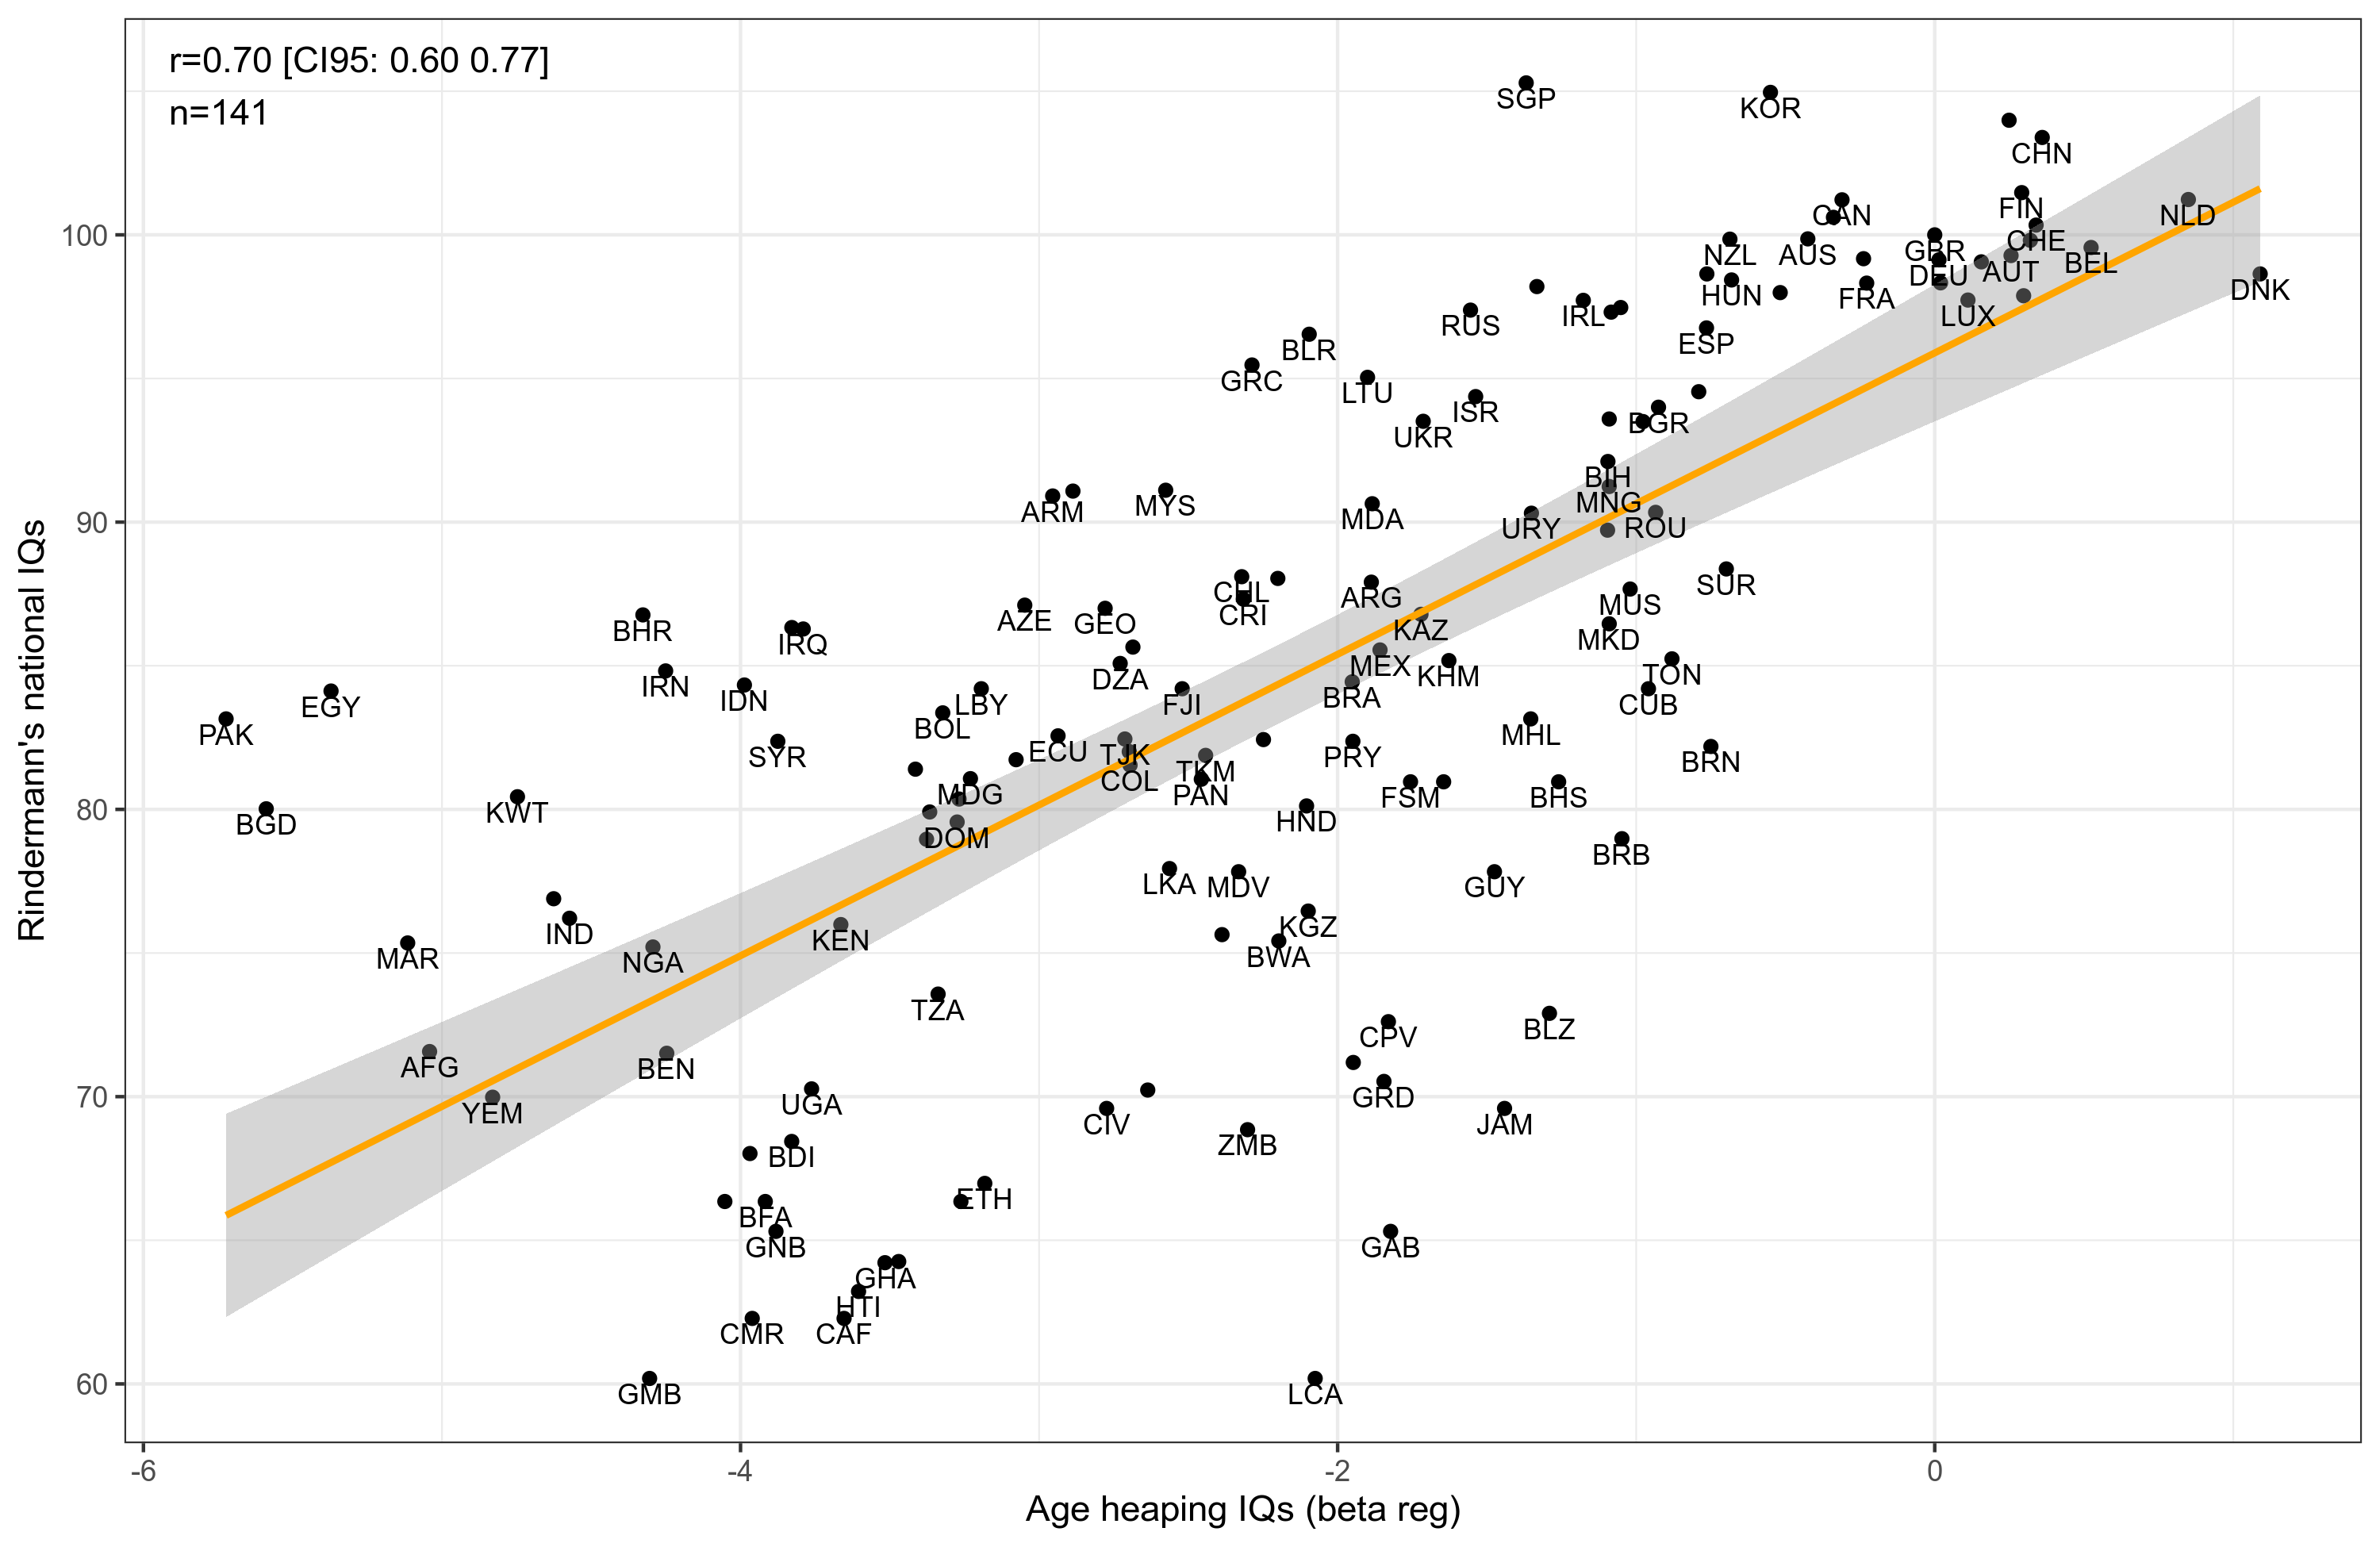
Amusingly, Denmark comes out as the country with the highest age heaping IQ, at 109, followed closely by Netherlands at 107, Belgium 105, China 104 etc. What about the regional means? Here they are:
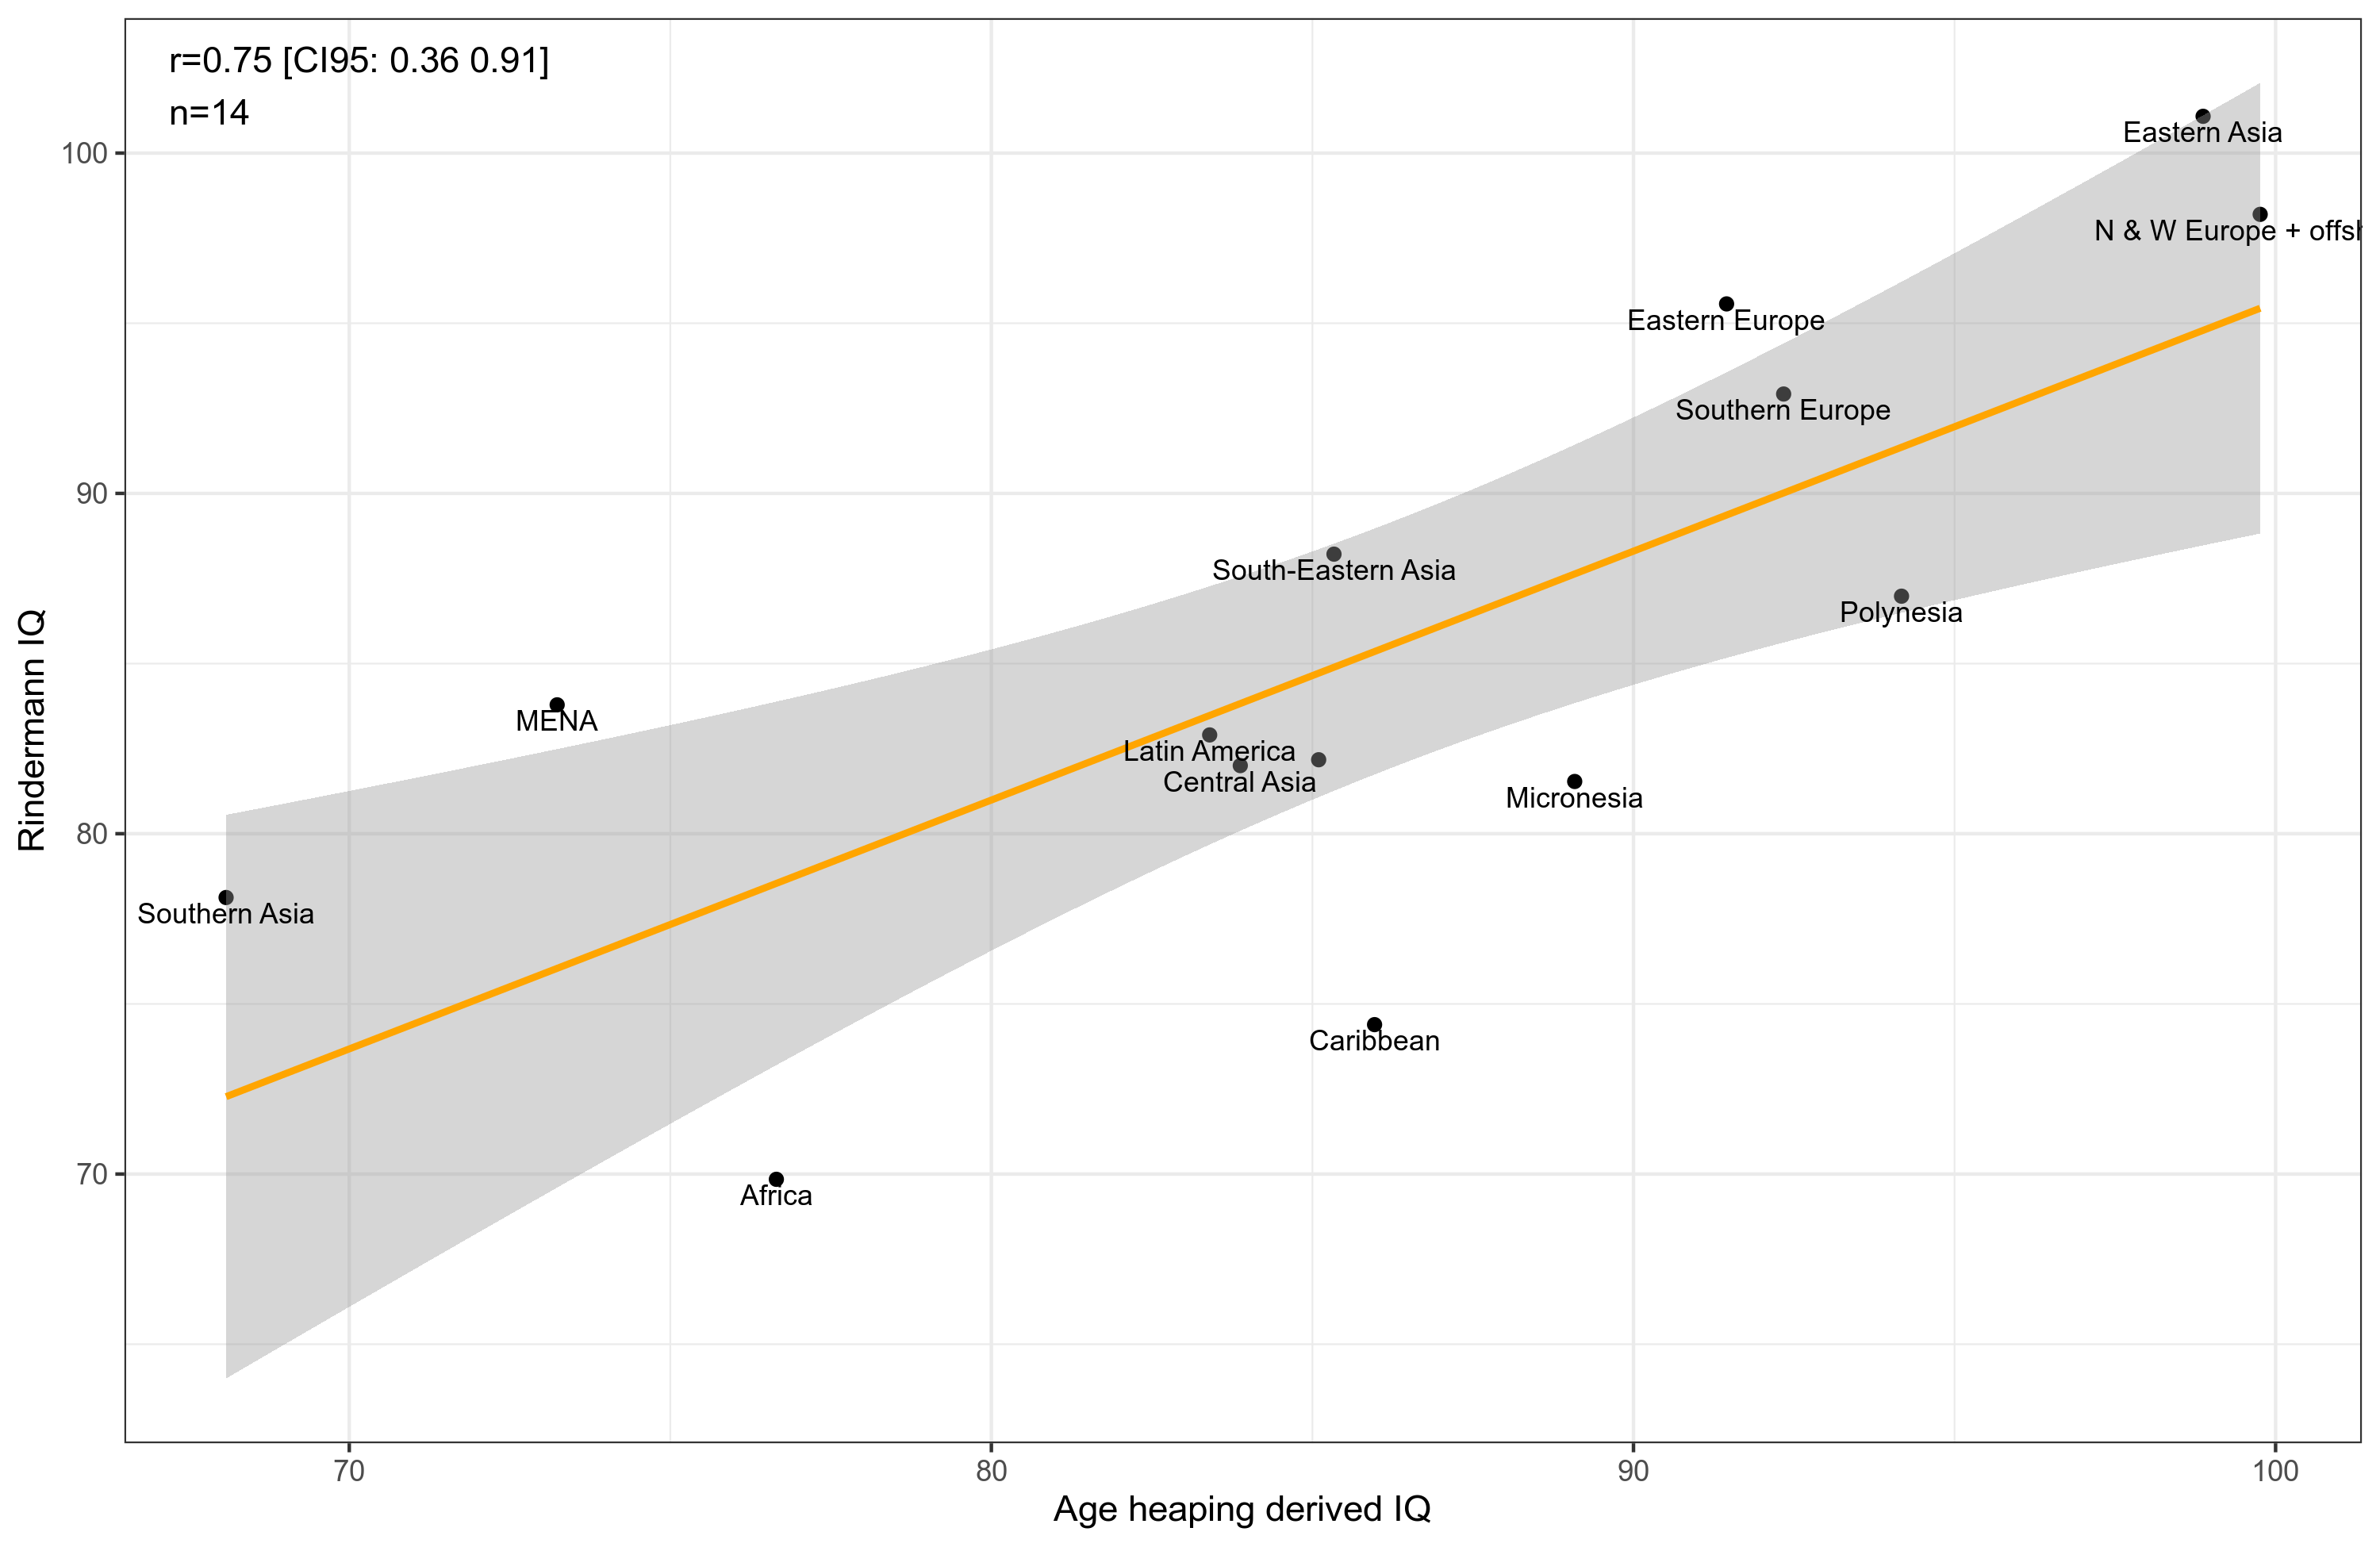
So after all this work, we get this plot with regional means. Africa is about 70 IQ in Rindermann’s data, and their age heaping is estimated at 77 IQ. This is probably too high because of self-selection in the census data but it’s in the right ballpark compared to the other sources and methods. Curiously, MENA and Southern Asia get even lower IQs. The lowest scoring countries are: Pakistan 58, Bangladesh 59, Egypt 60, Morocco 62. I don’t think we should take these at face value. As we saw in the correlation matrix, the amount of data for a country correlates .50ish with its IQ.
Conclusions
- New analyses of age heaping data properly converted to IQ metric shows a sub-Saharan African mean of 77 IQ. Sampling bias probably lead to an overestimate, but it’s still in the same ballpark as other sources despite being based on completely unrelated data.
- Other regional IQs were mostly accurate, but questions about MENA and southern Asia. Maybe related to late roll-out of formal education? Good sampling? Coincidence due to poor data coverage?
- Beta regression provides the right tool for the task. The modeling can surely be improved upon. The country’s should be fixed to have shared 0 intercepts, different growth patterns, and year of onset. Really, the country fixed effect will be more or less a linear transformation of the year the country reached a pass rate of 100%. But we can’t wait for that since some countries are still not there.
- The usual caveat with age heaping applies: this is a teachable skill. If some government decided to enforce correct age heaping and taught this skill to their citizens early on, then they would get an inflated IQ as estimated by this method. The same applies for governments or cultures that were unusually backwards in this regard. Denmark does not have 109 IQ, either now or in 1700, neither does Pakistan have an IQ of 58.
- Unfortunately, the situation is the same as always: the countries we most need data for are those with the worst data. There is a .50ish correlation with amount of age heaping data for a country and its IQ.