What is age heaping?
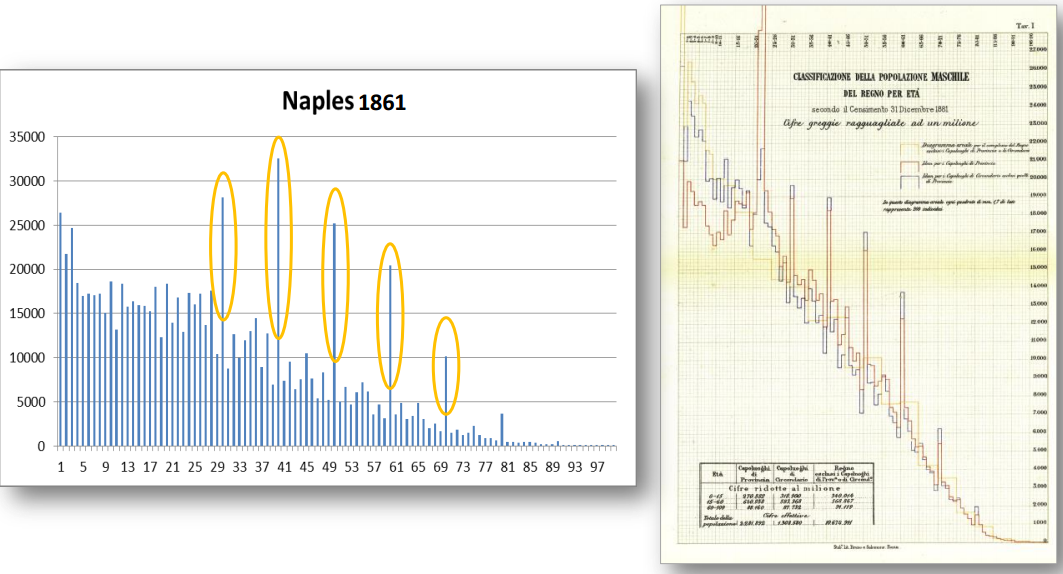
Number heaping is a common tendency of humans. What this means is that we tend round numbers to the nearest 5 or 10 (those of us that use the decimal system!). Age heaping is the tendency of innumerate people to round their age to the nearest 5 or 10, presumably because they can’t subtract to infer their current age from their birth year and the current year. Psychometrically speaking, this is a very easy mathematical test, so why is it useful? Surely everybody but small children can do it now? Yes. However, in the past, not all adults even in Western countries could do this. One can locate legal documents and tomb stones from these times and analyze the amount of age heaping. The figure below shows an example of age heaping in old Italian data.
Source: “Uniting Souls” and Numeracy Skills. Age Heaping in the First Italian National Censuses, 1861-1881. A’Hearn, Delfino & Nuvolari – Valencia, 13/06/2013.
Since we know that people’s ages really are nearly uniform, that is, the number of people aged 59 and 61 should be about the same as those aged 60, we can calculate indexes for how much heaping there is and use that as a crude numeracy measure. Economic historians have been doing this for some time and so we have some fairly comprehensible datasets for age heaping by now.
Is it a useful correlate?
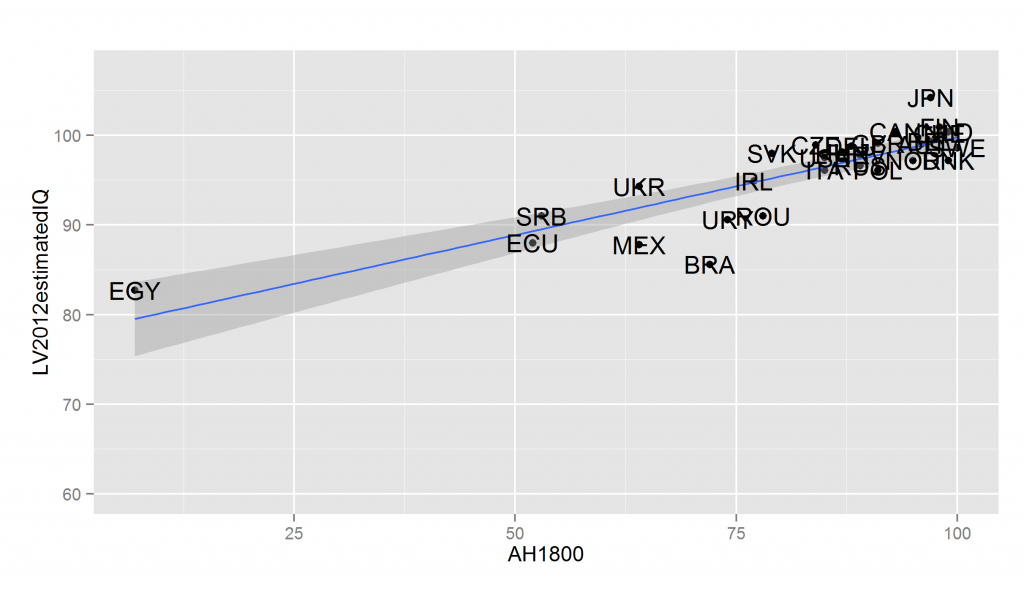
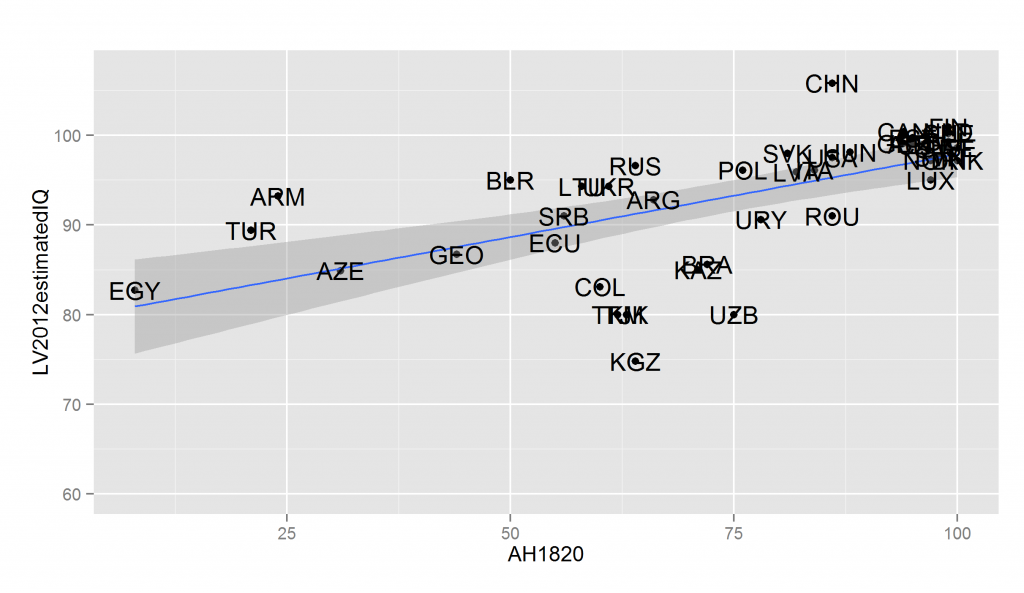
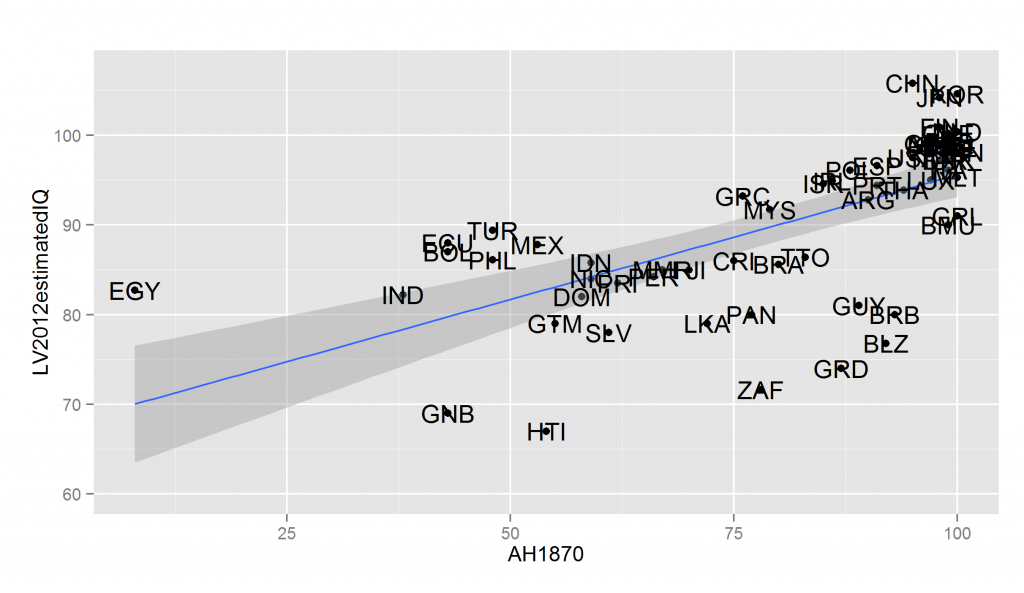
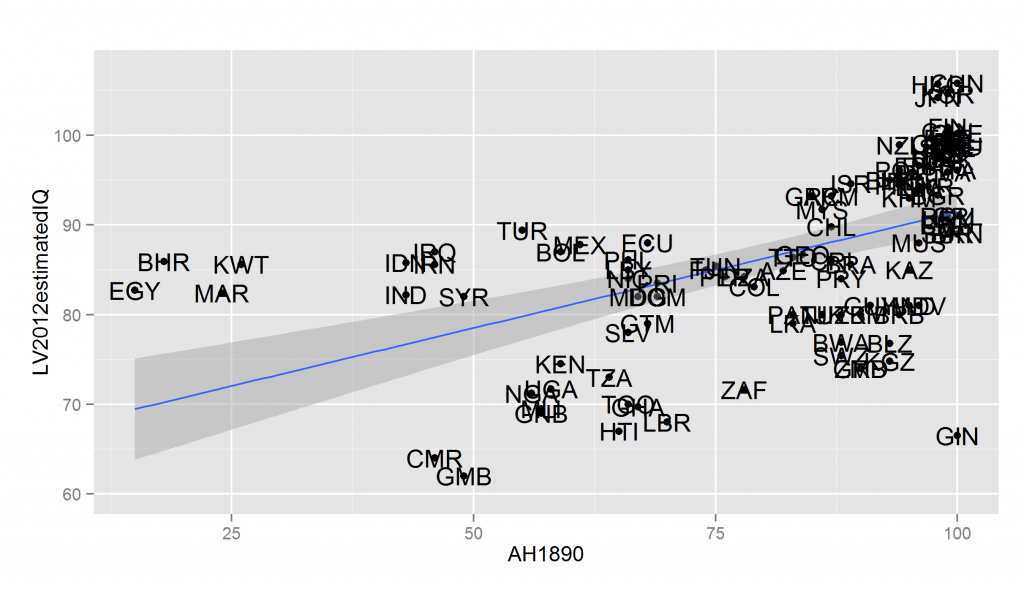
If you read the source above you will see that age heaping in the 1800s show the expected north/south Italy patterns, but this is just one case. Does it work in general? The answer is yes. Below I plot some of the age heaping datasets versus Lynn and Vanhanen’s (2012) national IQs:
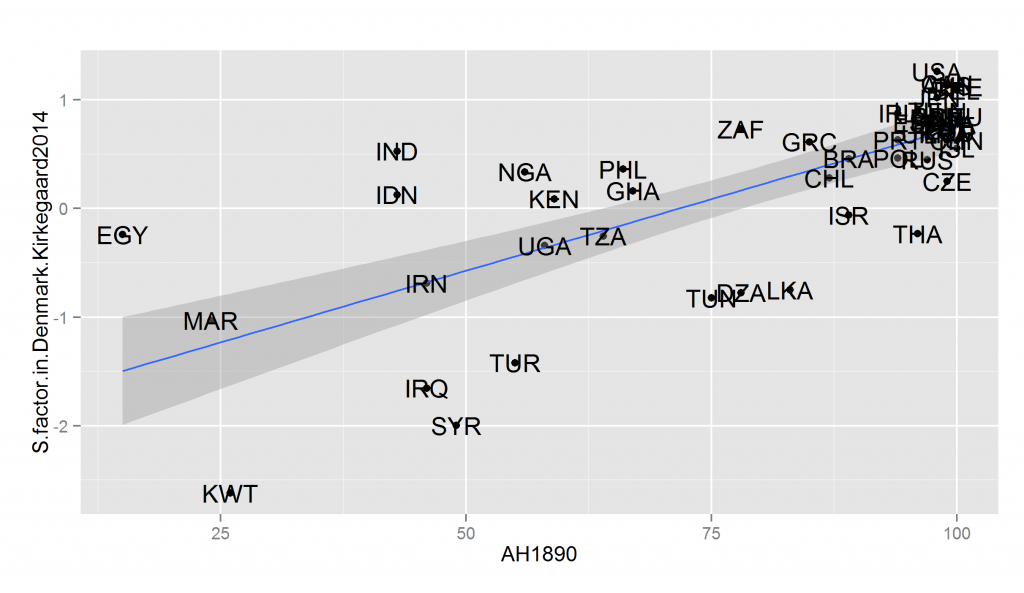
The problem with the data is this: the older datasets cover fewer countries and the newer datasets show strong ceiling effects (lots of countries very close to 100 on the x-axis). The ceiling effects are because the test is too easy. Still, the data covers a sufficiently large number of countries to be useful for modern comparisons. For instance, we can predict immigrant performance in Scandinavian countries based on their numeracy ability in the 1800s. Below I plot general socioeconomic performance (a general factor of education, income, use of social benefits and crime in Denmark in 2012) and age heaping in 1890:
The actual correlations are shown below:
| AH1800 | AH1820 | AH1850 | AH1870 | AH1890 | LV12 IQ | S in DK | |
| AH1800 | 1 | 0.95 | 0.94 | 0.96 | 0.9 | 0.85 | 0.61 |
| AH1820 | 0.95 | 1 | 0.94 | 0.94 | 0.76 | 0.62 | 0.67 |
| AH1850 | 0.94 | 0.94 | 1 | 0.99 | 0.84 | 0.73 | 0.59 |
| AH1870 | 0.96 | 0.94 | 0.99 | 1 | 0.96 | 0.64 | 0.56 |
| AH1890 | 0.9 | 0.76 | 0.84 | 0.96 | 1 | 0.52 | 0.73 |
| LV12 IQ | 0.85 | 0.62 | 0.73 | 0.64 | 0.52 | 1 | 0.54 |
| S in DK | 0.61 | 0.67 | 0.59 | 0.56 | 0.73 | 0.54 | 1 |
And the sample sizes:
| AH1800 | AH1820 | AH1850 | AH1870 | AH1890 | LV12 IQ | S in DK | |
| AH1800 | 31 | 25 | 22 | 22 | 24 | 29 | 24 |
| AH1820 | 25 | 45 | 37 | 22 | 36 | 43 | 27 |
| AH1850 | 22 | 37 | 45 | 27 | 37 | 43 | 30 |
| AH1870 | 22 | 22 | 27 | 62 | 56 | 61 | 34 |
| AH1890 | 24 | 36 | 37 | 56 | 109 | 107 | 50 |
| LV12 IQ | 29 | 43 | 43 | 61 | 107 | 203 | 68 |
| S in DK | 24 | 27 | 30 | 34 | 50 | 68 | 70 |
Great, where can I find the datasets?
Fortunately, they are freely available. The easiest solution is probably just to download the worldwide megadataset, which contains a number of the age heaping variables and lots of other variables for you to play around with: https://osf.io/zdcbq/files/
Alternatively, you can find Baten’s age heaping data directly: https://www.clio-infra.eu/datasets/indicators
R code
#this is assuming you have loaded the megadataset as DF.supermega
temp = subset(DF.supermega, select = c("AH1800", "AH1820", "AH1850", "AH1870", "AH1890", "LV2012estimatedIQ", "S.factor.in.Denmark.Kirkegaard2014"))
write_clipboard(wtd.cors(temp), digits = 2)
write_clipboard(count.pairwise(temp))

for (year in c("AH1800", "AH1820", "AH1850", "AH1870", "AH1890")) {
  ggplot(DF.supermega, aes_string(year, "LV2012estimatedIQ")) + geom_point() + geom_smooth(method = lm) + geom_text(aes(label = rownames(temp)))
  name = str_c(year, "_IQ.png")
  ggsave(name)
}

ggplot(DF.supermega, aes(AH1890, S.factor.in.Denmark.Kirkegaard2014)) + geom_point() + geom_smooth(method = lm) + geom_text(aes(label = rownames(temp)))
ggsave("AH_S_DK.png")
