Noah Carl has recently written about the African IQs debate, basically defending the usual numbers. Aside from arguing that the data are good enough to use, though obviously not perfect, he uses an imputation method as independent evidence:
As noted above, whether national IQs do underestimate the average cognitive ability in Sub-Saharan countries partly depends on which method for combining information from student assessment studies is correct. This is a matter for debate among statisticians. However, there is one crude way of checking: see whether Sub-Saharan countries have higher harmonized test scores than you’d expect based on the relationship between harmonized test scores and development among non-Sub-Saharan countries.
To do this, I created a simple “development index” by standardising and then averaging log GDP per capita and life expectancy. I then plotted the linear relationship between harmonized test scores and this development index for all the non-Sub-Saharan countries. This is shown as the grey line in the chart below, with Sub-Saharan countries highlighted in red:

This approach should work fine, but it is crude. If we trained a supervised model, we would be able to impute scores with higher accuracy. This probably doesn’t too much since all the national indicators are so strongly correlated resulting in what I called the international general socioeconomic factor, S factor. But using a more accurate imputation model should produce somewhat better results, so let’s try!
My approach is otherwise the same as Noah’s. We first delete all the African IQs, then we impute them back and see how their mean compares before and after. The latter represent African IQs in the counterfactual world where no one had ever gone there to collect data, and everybody was guessing based on other data that aliens had given us. For a nice collection of international indicators of all sorts, I chose my go-to option, the Social Progress Index. They produce their own Human Development Index alternative that isn’t based on money because they are sociologists who hate money stuff. Nevertheless, their world map looks the same as everybody else’s:

It is kinda ballsy of them to rank countries on tiers of social progress, which is very judgmental and ranky, but I digress! Their overall score is based on 53 indicators:
That’s why we created the Social Progress Index. Rather than emphasizing traditional measurements of success like income and investment, we measure 53 social and environmental indicators to create a clearer picture of what life is really like for everyday people. The index doesn’t measure people’s happiness or life satisfaction, focusing instead on actual life outcomes in areas from shelter and nutrition to rights and education. This exclusive focus on measurable outcomes makes the index a useful policy tool that tracks changes in society over time.
So these ’53’ indicators are what I shall use (their dataset only has 51). I can think of 3 main approaches to imputing scores. First, we can do the same as Noah did, but we use the overall index or score of the SPI, not each indicator. This approach has 2 variants, because we can use their premade SPI, or we can factor analyze them and use the generator factor. The second approach is to use a standard imputation algorithm. It has to be based on a method that can handle extrapolated values away from the training data since IQs outside of Africa are not generally so low (but a few are). If one used something like random forest or nearest neighbor, it would not be possible to predict lower values than observed. My go-to imputation approach is an algorithm called IRMI, which you can read about here. It tends to do well in comparisons and it’s based on regressions. It is implemented in the VIM package in R. The third approach would be to fit a machine learning model manually to impute the values. For this I chose ridge regression, which is just penalized linear regression. In this approach, an optimal amount of shrinkage is estimated and each of the 51 variables are then used to predict the missing IQ values.
First off, though, we gotta choose a dataset of IQs. So I chose… all of them:
- Lynn2012 = Lynn & Vanhanen’s 2012 Intelligence a unifying construct for the social sciences. These combine IQ data as well as PISA etc. data.
- Rindermann2018 = Rindermann’s 2018 Cognitive Capitalism book scores. These are mostly based on PISA etc. data, but also with the regular IQ data.
- Becker2019 = David Becker’s v1.3.3 recalculations of Lynn’s source materials, uses the same basis as Lynn 2012, just with better sourcing and open calculations.
- Worldbank2020 = World Bank’s Harmonized Test Scores, which are only based on PISA etc. data.
Here’s the regional observed IQ means, based on a UN classification scheme I’ve been using:

For African, we see that these are 70.5, 66.7, 68.2, and 69.8. Not much variation here.
Before going further let’s replicate Noah’s findings using the Worldbank data:

The red dots are the African countries who were left out of the model. Obviously, their placement is on the line that relates the IQs to the SPI. The mean of their values is 65.8 IQ. So it seems like a striking vindication of Lynn’s African IQs! But as we shall see, it gets more complicated. Above, I said I used 4 different national IQ datasets. The idea of this is of course to check for ‘method variance‘, i.e. whether the somewhat arbitrary choices made during data analysis made a difference to the results (which it often does). Here’s the results based on the same SPI linear regression method, but for the 3 other IQ variables:

Huh, so using this method, the African IQs could be somewhere from 61.9 to 79.3, a span of about 18 IQ! That doesn’t sound so convincing anymore. So what about all the other methods combinations? There’s 4 methods, and 4 IQ variables, hence 16 mean IQs for each region, and we’ve got 14 regions. That’s too many combinations to just look over, it is in fact 224. Of these, I have results for 221 because 3 gave errors due to missing data for small regions e.g. Melanesia.
If we are to try to summarize all of this in one plot, it might look like this:
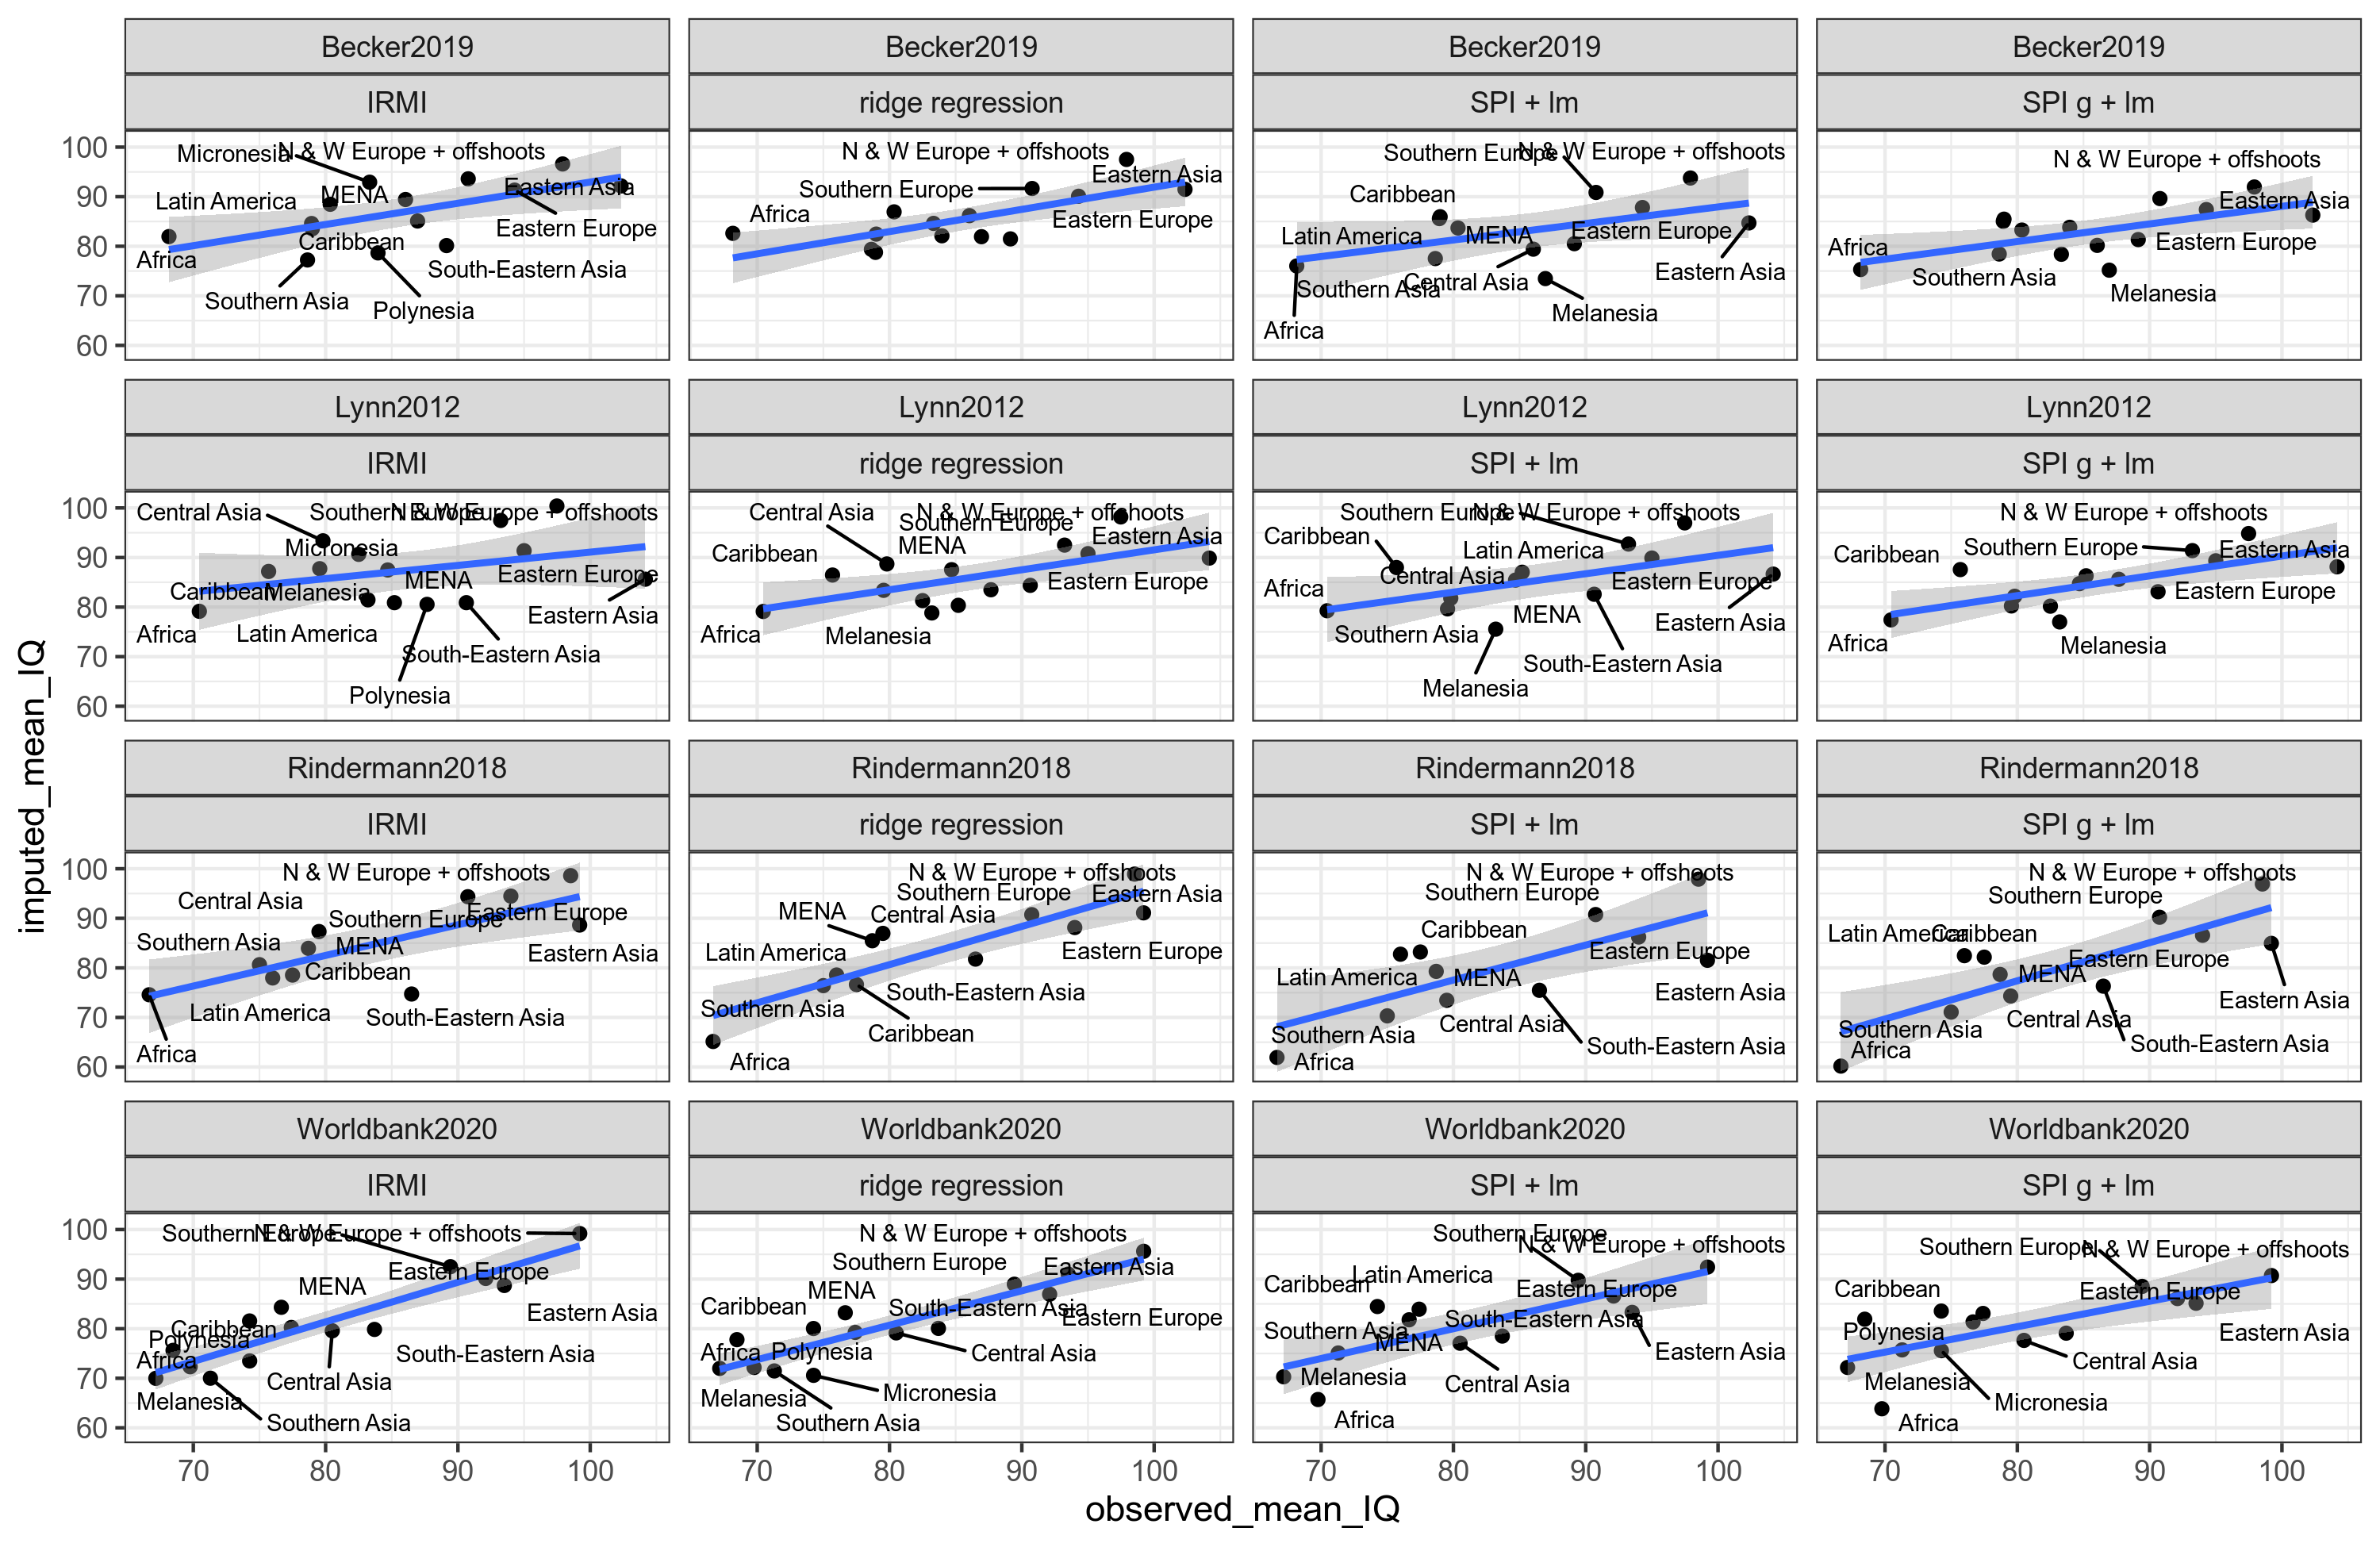
I’m sorry, it is a mess. But if we pay close attention, we can make sense of it. Here’s the results for Africa:

So as before, we get variation, from 60.2 to 82.6, with a mean of 72.9 IQ. This is not a result that will surprise hereditarians. However, consider the East Asian results:

Huh, these are all way below their observed IQs! The mean is 87.5, which is kinda crazy. What gives? Well, first off, the Worldbank has some strange numbers. Their IQ for China is 84 in contrast to Lynn2012’s 106!!:

But that’s just the Worldbank, the other 3 datasets produce similar low results. Why is that? It’s because Eastern Asia underperforms on international rankings compared to their IQs. Thus, if one predicts IQs backwards, one will get lower values. The whole exercise about predicting IQs from non-IQs thus just depends on whether some region is an underperformer or overperformer. We’re full circle here. Because of this, I no longer think this source of data is that strong. It is certainly true that African IQs pass the sniff test by comparison with other international rankings, where Africa’s performance is roughly equally abysmal. However, one cannot just impute IQs reliably from non-IQ data in order to get some kind of unbiased estimates of a region’s IQ because the regions themselves may under- or overperform on international rankings for whatever reason and that will have a big effect on the imputed IQs. Reasons under-/overperformance could be legacy of or current communism, nonWEIRDness, low individualism, or any other difference you can imagine.
For those interested in the details, here’s the complete list of imputed regional IQs across method and dataset. And here’s the R notebook for those who are wondering about the rest of the code.
