Davide Piffer and Richard Lynn has a new study out:
- Piffer, D., & Lynn, R. (2022). In Italy, North-South Differences in Student Performance Are Mirrored by Differences in Polygenic Scores for Educational Attainment. Mankind Quarterly, 62(4), Article 2. https://doi.org/10.46469/mq.2022.62.4.2
In Italy, there is a consistent north-south gradient in economic development, education, intelligence (IQ) and stature. The aim of this paper is to investigate the possible genetic cause of differences in educational attainment by using publicly available DNA data and recent genetic predictive models. Principal components analysis confirmed the presence of a high degree of population structure and clusters with little overlap between northern and southern Italy, corresponding to traditional macro-regions (Northern, Central, and Southern). This ancestry component correlates with the polygenic scores (PGS) for educational attainment (r = .2 to .3). The differences in the genetic scores for educational attainment and height follow the same north-south gradient and are of similar magnitude to the measured phenotypic differences (Cohen’s d is 0.5 to 0.6). Key Words: Italy, Inequality, Intelligence, Cognitive ability, Education, Genetics, Polygenic score
So let’s jump into it! First, they confirmed the usual north-south population structure in Italy using their individual-level dataset.
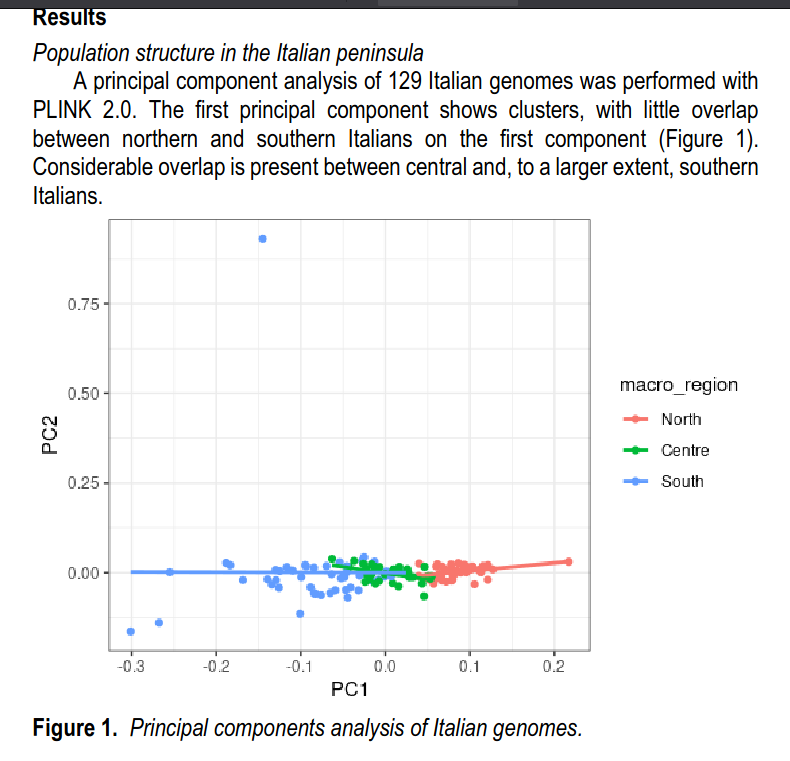
We see there is one conspicuous outlier (blue dot in the top). Presumably, this is either gross reading error in the genomics pipeline, or more likely, someone with cryptic ancestry from far away. Aside from that, there is not so much overlap between the 3 broad regions. There is no overlap at all between north vs. south for these samples.

In terms of polygenic scores for educational attainment, using the newest iteration, the semi-public release, we get these gaps. Numerically speaking, they are fairly large:
Magnitude of the differences The magnitude of the differences in polygenic scores between North and South, as represented by Cohen’s d, was 0.49 (95% C.I. = 0.08 to 0.90). An outlier was identified using the R function (rstatix package) “identify_outliers” (Kassambara, 2021). The effect size increased after removing the outlier (Cohen’s d = 0.57, 95% C.I. = 0.15 to 0.99). One-way ANOVA was performed to test if the three group means were significantly different (F(2,126) = 3.1, p = .049). After removal of the outlier, statistical significance increased (F(2,125) = 4.15, p = .018).
The Abruzzo region is genetically and geographically a grey area between southern and central Italy (Sazzini et al., 2016; Raveane et al., 2019), hence the analysis was re-run after grouping Abruzzo with other central Italian regions. With this grouping, one-way ANOVA found similarly significant differences (F(2,126) = 3.37, p = 0.037 and F(2,125) = 4.46, p = 0.013), before and after removing the outlier, respectively. The effect size for the North-South difference increased to Cohen’s d = 0.55 (95% C.I. = 0.11 to 0.98) (suppl. Figure 1). Without the outlier, Cohen’s d increased to 0.64 (95% C.I. = 0.20 to 1.07).
So, the differences are not entirely convincing in terms of the p values, but considering the other supporting evidence (i.e. the Bayesian prior), we don’t have too much reason to be highly suspicious. Another way to look at it, is to look at each subject’s north-south ancestry, which can be proxied by the first principal component in Italy:
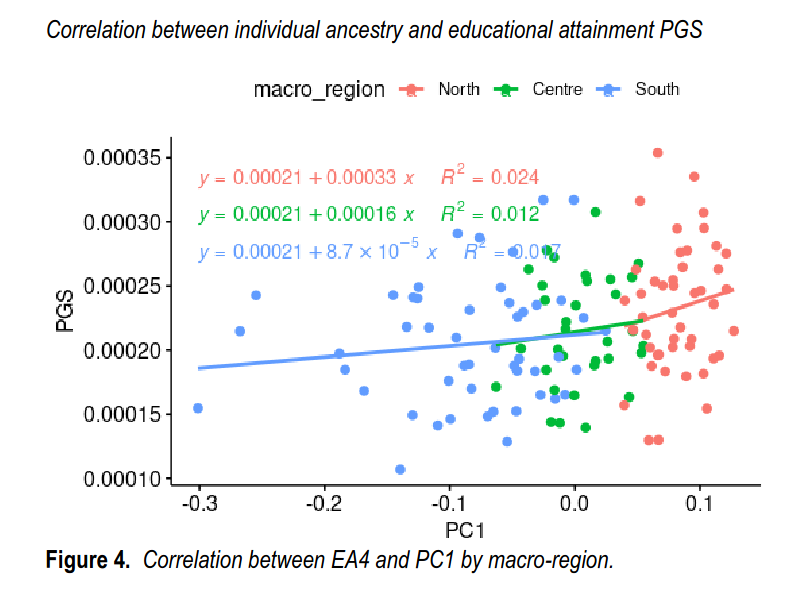
We get a similar pattern, again, statistically, not so impressive at p = .02 before the outlier was removed, r = .20, and r = .27 afterwards (p value not reported but I compute it to be .002, n = 128 when outlier is removed).

Here the authors compared the results to those of other Europeans in the 1000 Genomes project and gnomAD. This aggregate only analysis allowed the use of the second dataset of Italian data, which only released summary statistics by region, INGI, but which has a larger sample size of about 1,000 subjects. In that dataset, we see the anomalous result that northeast Italy has a fairly low polygenic score, even below south Italy in the array dataset. Weird! However, it still shows that overall north Italy (NE + NW) had a higher polygenic score than south Italy (S), so the main pattern was preserved, and replicated. Still, this is weird and needs further replication the next time more data arrives.
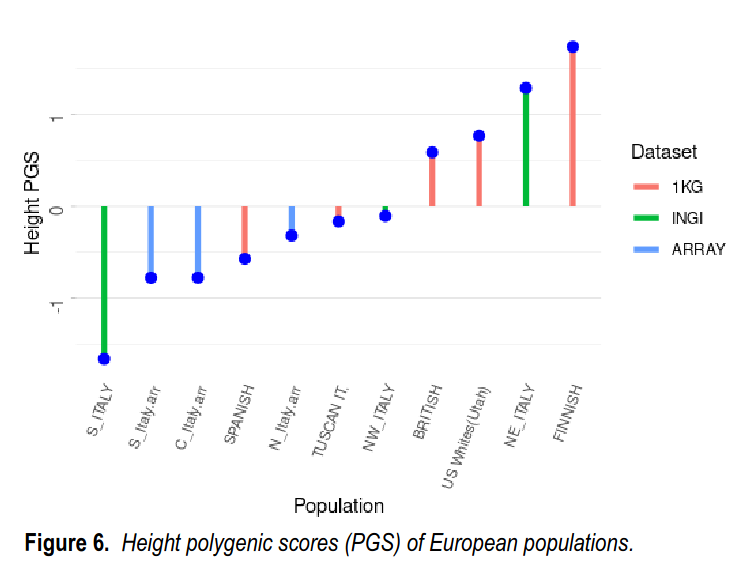
Finally, as a validation, they examined the height gaps. Height is more heritable and less affected by environmental factors, but also shows large north-south gaps. Can these also be seen in the polygenic scores for height? Yes, they are quite clear. The two samples of south Italians obtain the lowest polygenic scores for height. Again, the relative differences are not entirely spot on. Finns have a much higher score than even the Europeans in Utah and British in Britain, but Finns are not particularly tall by north European standards, so what gives? We can’t really say for now, but the broad patterns are there.
The authors are cautious about the possible interpretations:
An interpretation of this finding is that in Italy, natural selection acted over many generations to produce different population means for education-related traits (intelligence, impulsivity, openness to experience, etc.), thus becoming associated with old ancestry components. Conversely, in the presence of recent massive selective migration, with large numbers of migrants whose average levels of cognitive traits are different from those who stay behind, the association between ancestry and EA PGS would break down (Abdellaoui, 2019)
In fact, the individuals in our study had all their grandparents born in the same region, hence the data set does not represent the effects of the massive migrations that occurred over the last century, mainly from the countryside to the city and from the poorer South to the industrialized North, on the polygenic scores of people living in different regions. The present study lacked the power to detect subtle differences in polygenic scores independent of ancestry, due to the small sample size and the low spatial resolution.
Another possible interpretation of the findings is that the GWAS failed to remove the effects of population stratification on the phenotype (Sohail et al., 2019). However, the EA4 GWAS was carried out on individuals of White British and European American ancestry living in the UK and in the US. Therefore, population structures in the discovery populations are different from those present in Italy, and therefore less likely to bias the Italian results.
The paper should be read with the controversy about 10 years ago in mind. Lynn published this paper in Intelligence:
- Lynn, R. (2010). In Italy, north–south differences in IQ predict differences in income, education, infant mortality, stature, and literacy. Intelligence, 38(1), 93-100.
Regional differences in IQ are presented for 12 regions of Italy showing that IQs are highest in the north and lowest in the south. Regional IQs obtained in 2006 are highly correlated with average incomes at r = 0.937, and with stature, infant mortality, literacy and education. The lower IQ in southern Italy may be attributable to genetic admixture with populations from the Near East and North Africa.
The paper spawned a bunch of debate, and has 185 citations:
- Beraldo, S. (2010). Do differences in IQ predict Italian north–south differences in income? A methodological critique to Lynn. Intelligence, 38(5), 456-461.
- Lynn, R. (2010). IQ differences between the north and south of Italy: A reply to Beraldo and Cornoldi, Belacchi, Giofre, Martini, and Tressoldi. Intelligence, 38(5), 451-455.
-
Daniele, V., & Malanima, P. (2011). Are people in the South less intelligent than in the North? IQ and the North–South disparity in Italy. The Journal of Socio-Economics, 40(6), 844-852.
- Felice, E., & Giugliano, F. (2011). Myth and reality: A response to Lynn on the determinants of Italy’s north–south imbalances. Intelligence, 39(1), 1-6.
- Lynn, R. (2012). IQs in Italy are higher in the north: A reply to Felice and Giugliano. Intelligence, 40(3), 255-259.
-
Templer, D. I. (2012). Biological correlates of northern–southern Italy differences in IQ. Intelligence, 40(5), 511-517.
-
D’Amico, A., Cardaci, M., Di Nuovo, S., & Naglieri, J. A. (2012). Differences in achievement not in intelligence in the north and south of Italy: Comments on. Learning and Individual Differences, 22(1), 128-132.
- Cornoldi, C., Giofrè, D., & Martini, A. (2013). Problems in deriving Italian regional differences in intelligence from 2009 PISA data. Intelligence, 41(1), 25-33.
- Piffer, D., & Lynn, R. (2014). New evidence for differences in fluid intelligence between north and south Italy and against school resources as an explanation for the north–south IQ differential. Intelligence, 46, 246-249.
- Daniele, V. (2015). Two Italies? Genes, intelligence and the Italian north–south economic divide. Intelligence, 49, 44-56.
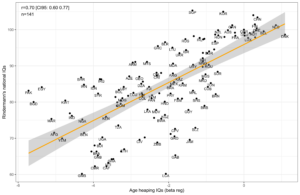
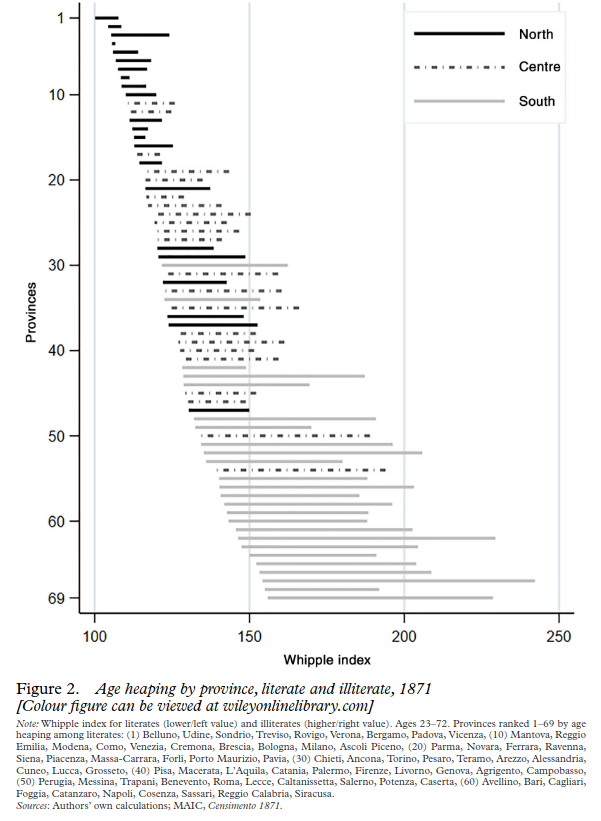
As far as I can tell, the debate then died down since 2015, pending new data. Well, the new data are in, and they support the obvious explanation. I find that science in this area is so predictable. You just start with some common stereotype. For instance, people in north Italy are brighter than those in the south. Almost invariably, it will be correct. Coming up with historical supporting data is easy: look at origins of Italian scientists, Nobel prize winners, renaissance eminent men and so on. These are invariably more common in the north. There’s a bunch of older data about regional development, and later, there’s age heaping data from the 1800s too. They are available at a lower level of aggregation, provinces. Some years ago I merged these with the Italian school achievement data at the same level, and the 1800s data correlated at about .60 with the modern scores. The paper with that dataset was finally officially published in 2021. Looks like this:
We can confidently make some more predictions:
- Future studies will confirm regional patterns in intelligence and its various downstream effects in Italy, wealth, health, education etc.
- Future genetic studies will find polygenic score differences in line with the above.
- These results will be denied to show what they plainly show for a while.
- It will eventually be conceded as obvious. Indeed, it is obvious.