The new June issue of Mankind Quarterly is out, and naturally it features a paper of mine:
-
Kirkegaard, E. O. W. (2022). Admixture and Social Status in Chile. Mankind Quarterly, 62(4), Article 3. https://doi.org/10.46469/mq.2022.62.4.3
We investigated how genetically measured ancestry relates to social status in Chile. Our study is based on a dataset of 1,805 subjects previously analyzed in another study. Ancestry was measured using genetic analysis based on microarray data. Overall we find that compared to European ancestry (44%), the Amerindian ancestries Mapuche (central Chile, 36%) and Aymara (northern, 17%) both predict lower social status (standardized betas = -1.77 and -0.97, p’s < .001). The amount of African ancestry was relatively minor in this sample (3%), but tentatively was associated with lower social status (beta = -2.15, p = .03). These differences held controlling for age, gender, and region of residence. Our analyses of the regional-level data (n=13) did not produce any findings. The sample size is probably too small and coarse-grained for this analysis to be viable. Key Words: Mapuche, Aymara, SES, Ancestry, Admixture
This is a relatively simple study. I was so fortunate as to discover some public individual level genomic data that also included a measure of social status. This allowed me to use our usual regression framework to better understand the genetics of social status, and thus indirectly intelligence, in a Latin American country. Here’s the figures from the original study, showing the regional variation in ancestry and gallbladder cancer (their topic of study):

The authors had gathered quite a diverse set of persons for their study. It was unfortunately not properly representative of the regions, but that was due to their interest in these two particular ethnic groups. Still, the maps show the regional variation is substantial. Particularly interesting was the use of 2 different Amerindian ancestries. Hereditarians expect different Amerindian ancestries to have different social status and intelligence averages, that should relate to their climatic adaptations and other recent history (eugenic vs. dysgenic selection, population density, out-migration etc.). From this perspective, the more southern group, the Mapuche, should be somewhat better off than the northern group, The Aymara. The results don’t support that, however! Here’s the correlations at the individual level:

As I write in the paper, these can easily be misleading:
It can be seen that some pairs of ancestry variables were positively correlated, indicating that naive interpretation of their relations to social status would be unwise (European x African, r = .18; European x Mapuche, r = .18). The reason for this is presumably African ancestry is mainly present in the areas where Mapuche live and Europeans settled, while the Aymara are relatively isolated. Positive associations between ancestries have been observed in prior studies of Latin American data, especially regional averages (e.g. Kirkegaard & Fuerst, 2016). In terms of the correlations with social status, European showed a slight positive relationship (.13), and Mapuche a slight negative relationship (- .12). The other variables were near zero (p > .05). In terms of regression slopes run individually, there were: Mapuche = -0.86 (p <.001), Aymara = -0.06 (p = .599), European = 0.88 (p <.001), and African = 1.90 (p = .053). Unstandardized regression slopes are of primary interest because they are an estimate of the effect of going from 0% to 100% ancestry. Correlations are not informative about the size of the effect because the standard deviations of the ancestries vary enormously (refer to Table 1). For more on this approach, see Connor & Fuerst (2021) and Kirkegaard et al. (2019).
The regression analyses provides more reliable results:

The regression analysis results differ strongly from the correlations and singular regressions. Both Amerindian ancestries are now strongly negative (Aymara = -0.97, Mapuche = -1.77, both p’s < .001). African ancestry is now also negative -2.15, with a nominal but not impressive confidence (p = .03). This means that as non-European ancestry increases, social status decreases, no matter which non-European ancestry. The addition of the basic controls (age, gender) greatly improved the model fit (adjusted R2 .036 to .197) while the addition of regions did not much (adj. R2 .197 to .204). The betas here contrast with those from the singular regression results for Aymara and African, which were both near zero before, but are both strongly negative now, thus highlighting the dangers of relying on singular regression (and correlation) when there are more than two ancestries.
I also tried the regional results, though the dataset was very limited with only n=13 regions for analysis, and with small samples for some of them due to the unrepresentative sampling. Only the correlations showed a ‘hit’ for one ancestry, Mapuche at -.75. I also found that cognitive scores from the scholastic tests correlated fairly well with human development index of the regions, about .60, similar to prior studies, a bit on the lower side.

The regression results showed nothing of interest. It was very underpowered. But there’s another recent study of 40 communes of Chile that replicated the Mapuche association:
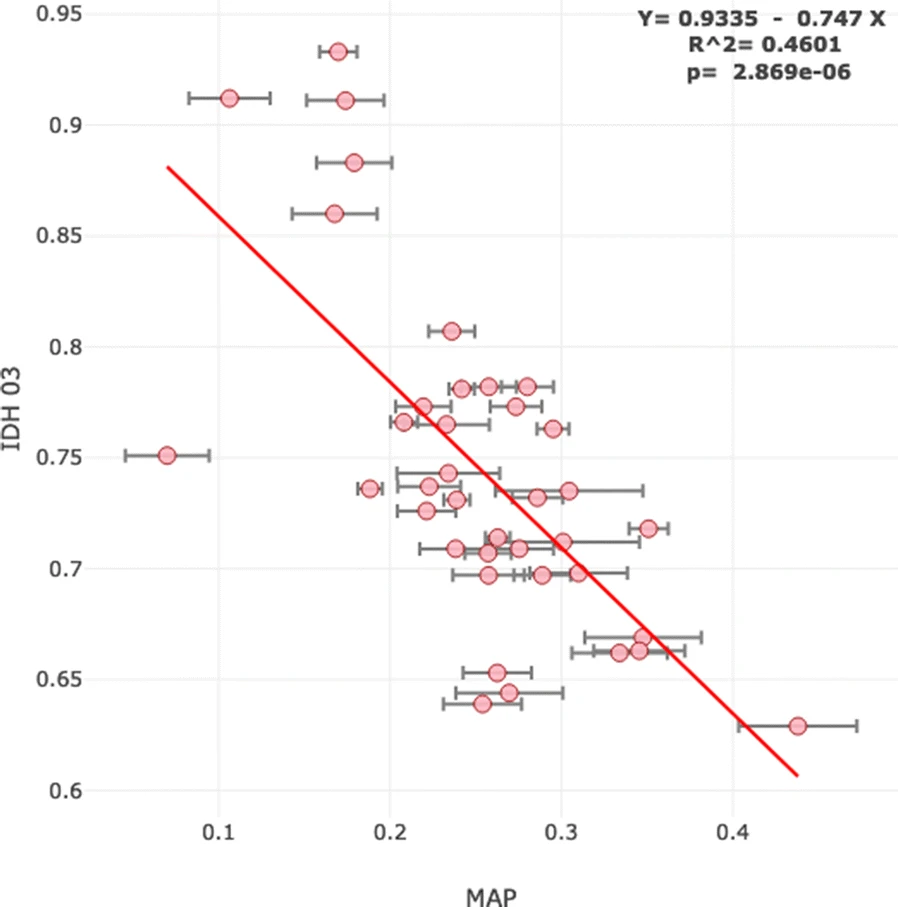
The effect size is large. They also use the human development index as their outcome. The slope for the Mapuche ancestry is -0.75. HDI is on a 0-1 scale. A change of 0.75 corresponds to a difference larger than between the worst country on the current listing, Niger at 0.394, and the best country, Norway at 0.957. This result is therefore too large to be credible. Do we really think that if we took purebreed Mapuches and let them run a country, this country would be worse off than a terrible African country? Not really. The result is presumably due to unmeasured confounds in this single regression. Still, it’s a replication in the right direction, and needs more study. Unfortunately, though the authors of that study claimed they published more details, the links to give are already all 404 and it’s been only 2 years since their study was published! Link rot is a serious issue in science.
For those readers interested in more of these kind of studies, see our large 2016 meta-analysis, and the 2017 Argentina follow-up:
-
Fuerst, J., & Kirkegaard, E. O. W. (2016). Admixture in the Americas: Regional and National Differences. Mankind Quarterly, 56(3), 256–374. https://doi.org/10.46469/mq.2016.56.3.2
We conducted novel analyses regarding the association between continental racial ancestry, cognitive ability and socioeconomic outcomes across 6 datasets: states of Mexico, states of the United States, states of Brazil, departments of Colombia, sovereign nations and all units together. We find that European ancestry is consistently and usually strongly positively correlated with cognitive ability and socioeconomic outcomes (mean r for cognitive ability = .708; for socioeconomic well-being = .643) (Sections 3-8). In most cases, including another ancestry component, in addition to European ancestry, did not increase predictive power (Section 9). At the national level, the association between European ancestry and outcomes was robust to controls for natural-environmental factors (Section 10). This was not always the case at the regional level (Section 18). It was found that genetic distance did not have predictive power independent of European ancestry (Section 10). Automatic modeling using best subset selection and lasso regression agreed in most cases that European ancestry was a non-redundant predictor (Section 11). Results were robust across 4 different ways of weighting the analyses (Section 12). It was found that the effect of European ancestry on socioeconomic outcomes was mostly mediated by cognitive ability (Section 13). We failed to find evidence of international colorism or culturalism (i.e., neither skin reflectance nor self-reported race/ethnicity showed incremental predictive ability once genomic ancestry had been taken into account) (Section 14). The association between European ancestry and cognitive outcomes was robust across a number of alternative measures of cognitive ability (Section 15). It was found that the general socioeconomic factor was not structurally different in the American sample as compared to the worldwide sample, thus justifying the use of that measure. Using Jensen’s method of correlated vectors, it was found that the association between European ancestry and socioeconomic outcomes was stronger on more S factor loaded outcomes, r = .75 (Section 16). There was some evidence that tourist expenditure helped explain the relatively high socioeconomic performance of Caribbean states (Section 17).
-
Kirkegaard, E. O. W., & Fuerst, J. (2017). Admixture in Argentina. Mankind Quarterly, 57(4), 542–580. https://doi.org/10.46469/mq.2017.57.4.4
Analyses of the relationships between cognitive ability, socioeconomic outcomes, and European ancestry were carried out at multiple levels in Argentina: individual (max. n = 5,920), district (n = 437), municipal (n = 299), and provincial (n = 24). Socioeconomic outcomes correlated in expected ways such that there was a general socioeconomic factor (S factor). The structure of this factor replicated across four levels of analysis, with a mean congruence coefficient of .96. Cognitive ability and S were moderately to strongly correlated at the four levels of analyses: individual r=.55 (.44 before disattenuation), district r=.52, municipal r=.66, and provincial r=.88. European biogeographic ancestry (BGA) for the provinces was estimated from 25 genomics papers. These estimates were validated against European ancestry estimated from self-identified race/ethnicity (SIRE; r=.67) and interviewer-rated skin brightness (r=.33). On the provincial level, European BGA correlated strongly with scholastic achievement-based cognitive ability and composite S-factor scores (r’s .48 and .54, respectively). These relationships were not due to confounding with latitude or mean temperature when analyzed in multivariate analyses. There were no BGA data for the other levels, so we relied on %White, skin brightness, and SIRE-based ancestry estimates instead, all of which were related to cognitive ability and S at all levels of analysis. At the individual level, skin brightness was related to both cognitive ability and S. Regression analyses showed that SIRE had little detectable predictive validity when skin brightness was included in models. Similarly, the correlations between skin brightness, cognitive ability, and S were also found inside SIRE groups. The results were similar when analyzed within provinces. In general, results were congruent with a familial model of individual and regional outcome differences.
It has been 6 years since we published the 2016 study. There are many new genomic studies of ancestry in the Americas. If you can read Spanish and/or Portuguese (for Brazil), and is interested in helping us with the next iteration of this study, please email me at emilowk@proton.me.