The theoretical prediction seems straightforward. If income is a function of intelligence (and other factors), then all else equal, a country with more inequality in intelligence will have more inequality in incomes. The first we generally measure by the standard deviation, and the latter we generally measure by things like gini coefficients and 10/90 income ratios. The various national intelligence databases do not include SDs for some reason, but the various student achievement surveys, PISA etc., do usually report a lot of inequality metrics. PISA likes their “proportions of students at level 1, 2, … 6”, but they do also report ability levels by centiles and even standard deviations if one reads tables in their reports or online materials. As such, it is possible to compile a dataset of countries’ inequality in intelligence as measured by PISA etc. tests. Together with a colleague, I spent some time today doing this. PISA reports exist since 2000, and come out every 3 years, so there are data for 2000, 2003, 2006, 2009, 2012, 2015, 2018. 2021 is not out yet due to COVID delays. Still, we have data for 7 years, and in each year, 3 topics: math, reading, and science. So for each country, we have up to 18 datapoints. This should be plenty for a meta-analysis. Those interested in the details can find them here, but the final product is a dataset of 79 countries that participated in at least one PISA testing. Their SDs range from 73 to 112, which is hard to believe, with a mean/median of 91. (See also the recent post discussing the fake data from Buj.) Be that as it may, these differences are relatively reliable. The standard error of the SD for countries averages about 2.
So then we just correlate these with income inequality measures, and get what we want:
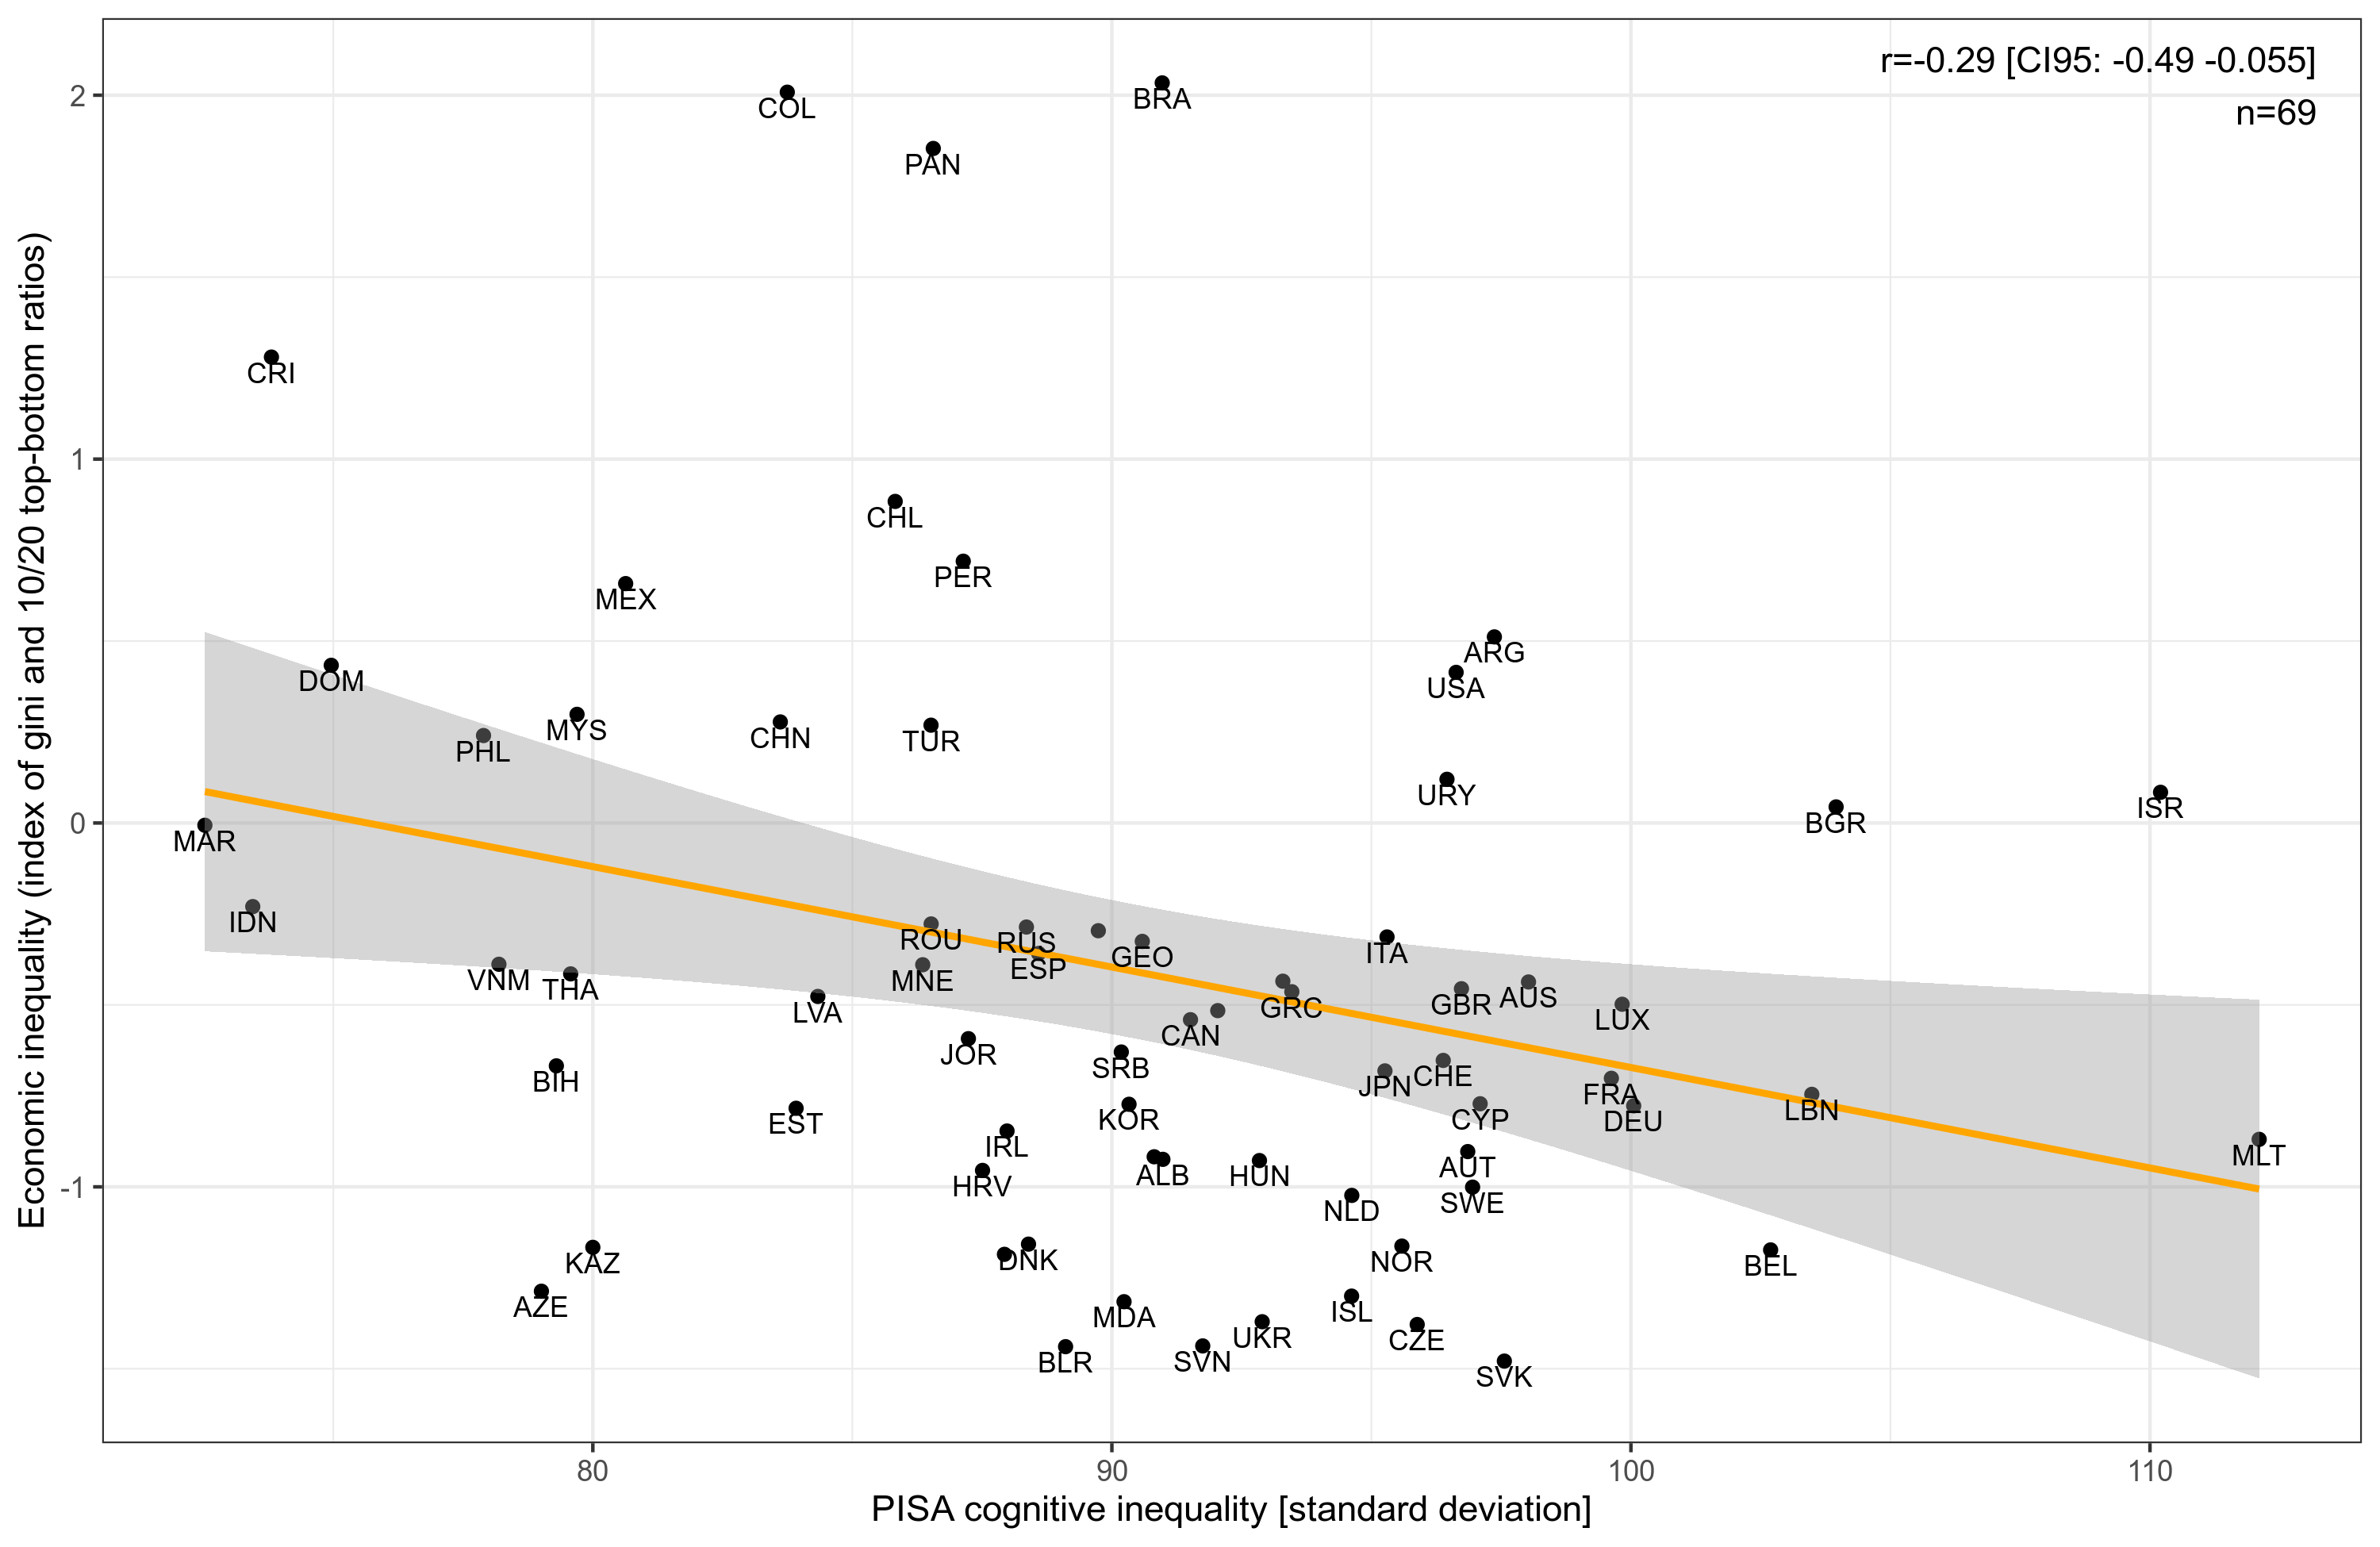
Except that, uh, the relationship is in the wrong direction! It even has p = .016! What is wrong? Well, maybe we just need to control for some obvious things, like the mean ability, or region of the world:
Nope. Well, we managed to make the beta about 0, but it doesn’t turn positive as it should. What’s wrong here?
Maybe we need to go back to basics. Let’s simulate a bunch of countries with different mean IQs, IQ SDs, and income functions of IQ (slope and randomness). I based the model on Dalliard’s regression model with log-income for the USA. So the model was log(income) = IQ_slope * IQ + intercept. I varied IQ slope between 0.01 and 0.05 (Dalliard found 0.025 for the USA). The intercept I set as a function of mean IQ (IQ/12) plus some noise. Dalliard found a value of 7.9 for the USA. All in all, this simulation produces kinda realistic log-normal income data. Simulating 1000 countries, I get these summary stats:
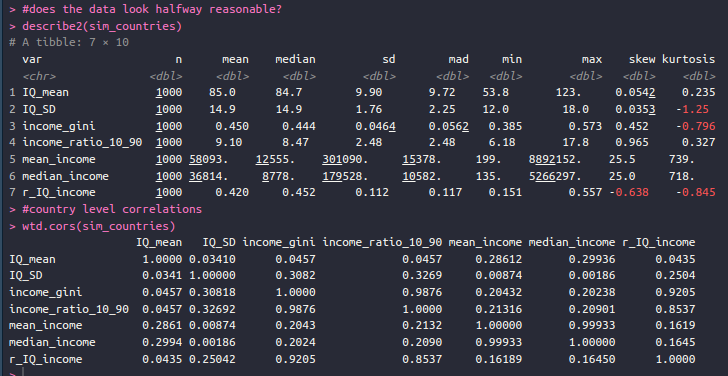
I set the world mean IQ to 85 with SD of 10, and we ended up with somewhat too high countries (one with 123 IQ!). But good enough probably. The SD I let vary from 12 to 18 by a uniform distribution. This corresponds then to a ratio of 1.50 at most. In the PISA data, we saw a ratio of 1.53. The income inequalities seem mostly reasonable too, probably too small. Some African countries in real life have ratios of 50+ between bottom 10th vs. top 10th, but we see a max of 18. Median yearly income across countries has a median of 50k. I aimed to hit a mean income of about 250k for a country with 100 IQ. Still, some countries are unrealistically high. I also let the strength of the income relationship vary between countries, with correlations from .15 to .57, as well as the regression slope. This is what economists talk about with “returns to skill”. The data are kinda realistic overall. So given this, what is the correlation between IQ SD and income inequality? Looks like this:

(The nerdy reader will also note that the association above shows heteroscedasticity, which is interesting, but not so relevant here I think.)
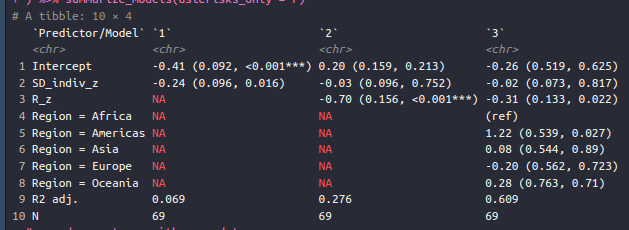
The correlation is not that impressive, r = .30ish. With n=1000 countries, we can of course find this relationship every time, but if we had a dataset of 70 countries, one might miss it. Or even find the opposite. Of course, in our simulation there is a the lack of any kind of other factors that strongly affect income inequality, which is really the issue. Government policies to reduce income inequality are the norm, and obviously vary a lot. Insofar as these are correlated with some of these IQ distributional numbers, this would probably make the association hard to spot in normal data, that is to say, it would be a study with low statistical power. In fact, we can try some models on the simulated data to get an idea:

(Standardized betas.)
Huh, so adding some covariates actually reduces the effect of IQ SD to 0.09! The most important variable seems to be return to skill, as measured by the correlation between IQ and income. Not really a surprise as this is basically another indirect measure of income inequality.
I don’t really have any particular hypothesis for which government policies are causing the negative association that one sometimes sees in the real data. However, the simulations make it clear that this relationship would probably too weak to find in real life given the noisy data and limited sample size. This isn’t intuitive. 2 different people with interest in these matters proposed this study idea to me, and I also had the idea myself. As we saw however, the study doesn’t ‘work’. But the likely reason for the failure is interesting. I am not sure anyone has simulated this kind of national inequality as function of IQ distribution parameters before, so hopefully this work can inspire some economists to continue this work!
I also think that the SDs we find based on PISA data are incorrect. Who can really believe that utra-diverse countries like Brazil (BRA) and Mexico (MEX) have less intelligence diversity than Malta (MLT). Back in 2007, sidestepping this issue of measuring intelligence SDs, Gerhard Meisenberg relied on racial diversity as a proxy for intelligence diversity (and other traits), and studied whether this could predict income inequality:
- Meisenberg, G. (2007). Does multiculturalism promote income inequality?. Mankind quarterly, 47(4), 3.
In many countries of the world the extent of ethnic, cultural and racial diversity is increasing as a result of international migration. One frequently voiced concern is that as populations become more diverse, socioeconomic inequalities within countries will become greater. The present study presents new measures of ethnic, racial and religious diversity for 198 countries and territories. These measures were used as predictors of the Gini index in regression models with other predictors. Ethnic and religious diversity were found to be virtually unrelated to the Gini index. However, a high level of racial diversity independently predicts a high Gini index. The effect of racial diversity is robust and persists when controls for spatial and cultural autocorrelation are introduced. The ethnic, racial, cultural and religious diversity of national populations varies over a wide range. At one extreme are countries such as Sweden and Norway which are, or were until recently, very homogeneous on most or all of these dimensions. Other countries are extremely diverse. For example, we find very high levels of ethnic diversity in most countries of sub-Saharan Africa, and very high levels of racial diversity in most Latin American countries. The possibility that aspects of cultural, ethnic or racial diversity are related to the level of income inequality in the country derives from two lines of reasoning. One hypothesis states that social solidarity is greatest in countries with a homogeneous population. It has been shown repeatedly that in private life, people associate preferentially with partners who are similar to themselves (DeBruine, 2002). According to genetic similarity theory (Rushton, 1989; Rushton and Bons, 2005), this tendency evolved as an extension of kin-selected altruism.
(See also my own 2014 paper with the same idea.)
He made an estimate of the intelligence diversity using the ethnic groups in the countries and their IQs and genetic distances. His results were not so surprising:

His correlation of .41 is not too far from the simulation results of .31, and his regression results were robust enough. This may make us wonder how to reconcile the simulation findings with Meisenberg’s real data findings using a proxy for IQ SD instead of the real deal. The simplest explanation I can think of is that racial diversity reduces support for income redistribution policies (very rationally, says Frank Salter), and that’s what Meisenberg’s measure is really picking up upon, not intelligence inequality’s direct effect on income inequality.