Gark N. Marks has a new review article out. And it doesn’t pull punches!
Few issues in the social sciences are as controversial as the role of cognitive ability for educational and subsequent socioeconomic attainments. There are a variety of arguments raised to dismiss, discount or discredit the role of cognitive ability: socioeconomic background is the dominant influence; if cognitive ability appears important, that is only because important predictors have been omitted; the relative importance of socioeconomic background and cognitive ability cannot be ascertained; and cognitive ability is simply a function of socioeconomic background and, for post-education socioeconomic attainments, education. This study analyses the effects of cognitive ability and socioeconomic background on a chronological sequence of social stratification outcomes – school grades, SAT and ACT scores, educational and occupational attainment, income and wealth – in data from the 1979 and 1997 National Longitudinal Surveys of Youth. The coefficients for cognitive ability decline marginally with the addition of socioeconomic background measures, including family-of-origin income averaged over several years, and wealth. In contrast, socioeconomic background coefficients decline substantially with the addition of cognitive ability. Net of educational attainment, cognitive ability has sizable effects on occupational attainment and income. Net of socioeconomic background, education and occupation, a one-standard-deviation difference in ability corresponds to a sizable 43% difference in positive wealth at around age 35 in the older cohort and a 25% increase in the younger cohort. Therefore, contrary to dominant narratives, cognitive ability is important to a range of social stratification outcomes, and its effects cannot be attributed to socioeconomic background or educational attainment.
His introduction consists of discussion of the various findings about intelligence and the criticisms of those. Especially with regards to responses to The Bell Curve analyses (experts actually like the book). He ends the introduction thus:
Many of the studies cited above reinforce false narratives that cognitive ability is unimportant to education and subsequent socioeconomic attainments, and that social stratification is mostly about socioeconomic background. Nielsen (1997, p. 704) notes that, contrary to the evidence, this literature confirms existing ideological preferences and reinforces “a comfortable state of denial”. Little has changed since the mid-1990s, despite the accumulation of far more evidence contrary to these narratives. Unfortunately, they have permeated from academia into wider publics including government bureaucracies, the media and the commentariat. Importantly, these narratives are consistent with prominent political ideologies which view Western societies as characterized by large and entrenched educational and socioeconomic inequalities, which can only be addressed by stronger interventions by the state, or the dismantling of market capitalism. 4
These prominent and pervasive critiques of cognitive ability’s role in education and social stratification are highly detrimental to the accumulation of scientific knowledge. Many academic journal editors and referees accept these critiques unquestionably, not because the contentions of the critiques are the products of careful and objective science (they are not), but because they are compatible with their pre-existing political ideologies. 5 Strong and robust effects of cognitive ability seriously undermine these political ideologies, so are summarily rejected.
Footnote 4: Among political activists and some sections of academia, socialism is understood as the obvious solution to the intergenerational reproduction of educational and socioeconomic inequalities. Socialism is advocated even when the intergenerational reproduction of socioeconomic inequalities is concluded as weak, for example Jencks et al.’s (1972, pp. 253–265) chapter “What is to be done”. Socialism is also the solution proposed for social inequalities attributable to genetic differences (Harden, 2021).
Footnote 5: When cognitive ability is involved, referee reports are often little more than unhinged ideological rants. Such reports are uncritically endorsed by the editors who commissioned them. The great pretence is that this process constitutes acceptable scholarly behavior in the pursuit of scientific knowledge.
What follows then is a tour de force of new analyses of the NLSY79 and NLSY97. These are probably the best American longitudinal studies that include good measures of intelligence. As NLSY79 was the dataset of The Bell Curve, this article essentially redoes these analyses with updated data, as well as replicates them in the NLS97 dataset. Marks could also have used the NLSY Add Health dataset, but maybe he didn’t have access to the full dataset. Contrary to the prior installments, this 3rd dataset is only partially publicly available, and the genetic data are all hidden firmly away behind locked doors.
The outcomes he looks at are:
- School grades
- SAT/ACT scores
- Educational attainment
- Occupational attainment (prestige of job)
- Income
- Wealth
So they are essentially all the major life-course social outcomes that everybody is interested in, except for criminality which he left out for some reason. It is not mentioned in the article at all. Perhaps he didn’t want to potentially derail the discussion with blahblah about the supposedly American racist police. In fact, the article is essentially silent on race.
Let’s look at the results one by one. Each comes with its own regression table:

We begin with school grades. These are the first step to winning at life (your parents tell you).
He includes both metric (unstandardized) and standardized coefficients. For some reason, the standardized ones are only included for the final models (model 3 above, Greek letter beta β column). However, one can compare the models’ R2 values and see which variables are important. So model 1 has parent (average) education and family income, model 2 has intelligence (g), and model 3 has all three. There are 3 rows of models because there are 3 sets of grades. One for NLSY79 in high school, and two for NLSY97, 8th grade and high school grades. Comparing the R2’s, it’s obvious that intelligence is by far the most important factor. The model’s with just intelligence explain the same % as the models that add family background variables, showing their uselessness in terms of improving the prediction. They do have positive betas, some with p < .05. The interpretation is however not necessarily that ability estimates were confounded and social background matters. Another option is that the g factor scores have some measurement error, and introducing correlated variables will just gobble up that variance into them (cf. Statistically Controlling for Confounding Constructs Is Harder than You Think).
The more interesting finding is that school grades seemingly become a lot more random over time, as they can neither be predicted as well by social background or by intelligence. In NLSY79 high school grades could be predicted with R2 of 37% but it’s only 20% in NLSY97! This could be due to many things. Perhaps the between-school factors are now more important, some school grading on a curve, others not; some schools using affirmative action grading, others not; or maybe the grading standards have been eroded to hide social gaps etc.
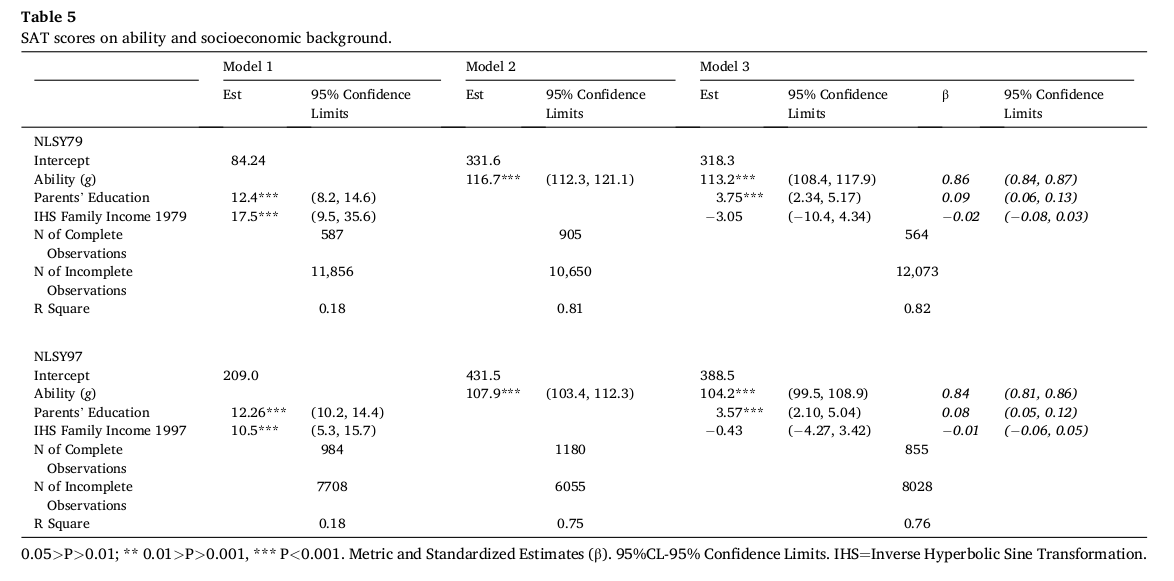
OK, after you got good grades, it’s time to get into university. Here you need to take an entrance test that measures what you learned previously.
What about SATs? Well, as I have written about them a few times, achievement tests are almost the same as intelligence tests. They have a bit more coloring of their g factors by crystalized abilities (stored knowledge). Still, they correlate at about .80 when adjusting for random measurement error. Marks finds betas of .86 and .84 even when adjusting for social background. In fact, family income did not predict SAT scores when adjusting for intelligence and parental education. Parental education has a minor role beyond intelligence, betas of .09 and .08. This could be due to the measurement error of intelligence, or maybe they do have minor causal effects on their own. The minor role for family income has been found a number of times. Heiner Rindermann also a paper about this, and there’s one in OpenPsych back from 2014.

The ACT models show the same thing pretty much.

So you got good grades, and got into university. Hopefully, you also completed university, right?
Educational attainment is essentially the end outcome of schooling. Still, it is a crude measure as not all degrees that take the same amount of time are equal. There’s large differences between the IQs of people with degrees in physics and in social work. Still, educational attainment is an important outcome used pretty much everywhere, including in GWASs that try to train genetic predictive models of intelligence by using this indirect measure. So how well does it work? Pretty well. In the final model, intelligence predicts education with betas of .48 and .46, compared to parental education with .21 and .18, and family income with .03 and .06. Intelligence is thus about twice as important as social background. We can also look at the model R2’s, and we see that adding social background only increases the variance explained a little: 35 to 39% and 32 to 35%.

So after having finished your PhD in advanced feminist Marxist dance therapy, it is time to get a good job (as science correspondent for the New York Times).
Occupational index or rank is a kind of measure of how cool your job is. There’s a few ways to construct these but they give about the same results. The coolest way is just to ask people to rank jobs by their perceived prestige level. These prestige rankings are very highly correlated among people in a given society. Due to the lack of standardized betas for the 3rd models, it is hard to compare social background to intelligence directly. However, one can compare the model R2’s, which show that adding social background variables doesn’t add much: 29 to 30%, and 21 to 23% variance explained compared to intelligence alone. Marks then adds years of education as a 4th predictor. This has a large incremental value for the models, about +50% in variance explained. Still, even with educational attainment included in the model, intelligence continues having about half the effect it had before (compare the unstandardized slopes between model 3 and 4). Marks notes that some of this is probably due to us not measuring education so well, and intelligence’s effect is probably overestimated for the same reason as discussed above.

You’re getting somewhere. You landed the science writer job, so now it’s time to harvest what you have sown and cash in. Income is what you want to make you happy in life according to capitalism.
As before, we can compare models to see the overall importance of family background vs. intelligence. These R2’s are .07 and .06 vs. .15 and .17. So intelligence is bit more than twice as important as a predictor (measured in R2). Combining them into a single model doesn’t do so much, it adds 1% to the R2. In model 4, we even manage to get a case of collider bias, as the beta for parental education turns negative (p < .05) in both datasets. This is probably because when you hold constant someone’s own intelligence and their education level, their family income, then look at changing their parental education level, you are really indirectly measuring mental illness or laziness, which have negative effect on income. Scott Alexander has kinda sorta written about this kind of thing before, but seemed to not realize it. In model 5, occupational status is added too, but we see that intelligence still predicts income. The prediction is still far above chance, but it is quite a bit reduced from initially. This is of course because intelligence gets you income by virtue of getting you better grades and a better job that pays more. The unstandardized betas for intelligence at the end are .11 and .21, down from .40 and .38 to begin with in model 2. So in percentage terms, about 50-75% of the validity of intelligence to predict your income is mediated by how much education and which job you get.

And NLSY97:

So you got the good grades, the good education, the good job, and the good income. Now it’s time to NOT spend the money, but just accumulate it until death (then donate it to strangers in taxes). That’s #winning
For wealth, there’s a table for each dataset. It’s because to model wealth is a bit complicated because some people have zero or negative wealth (they owe money), so the wealth distribution doesn’t follow any single statistical distribution, but rather a composite (mixture statisticians call it). So each predictor will be trying to predict first whether you end up in the positive or null-negative wealth categories, and then how much wealth you will have. I will let Marks explain these himself:
Tables 10 and 11 present the estimates from analyses of wealth at ages 34, 35 for the NLSY79 and at age 35 NLSY97. Positive and negative wealth are analyzed simultaneously. Model 1 shows that a one-year difference in parents’ education is associated with an 11% increase in positive wealth in NLSY79 and a 9% increase in the NLSY97. Without considering other influences, a doubling of family-of-origin income is associated with a 40% increase in positive wealth in the NLSY79 and a 21% increase in the NLSY97. This compares to increases of 75% and 68% for a one-standard deviation increase in cognitive ability (Table 3).
Comparing model 3 to model 2 (Table 3). controlling for parents’ education and family income reduces the coefficient for ability from 0.75 to 0.66 in the NLSY79 (12%) and from 0.68 to 0.55 in the NLSY97 (19%). In the extended model 3, the coefficients for g on positive wealth were comparable 0.64 and 0.59, although the two analytical approaches are not strictly comparable.
When considering cognitive ability in model 3, the impact of family income is substantially less than in model 1. In the NLSY79, a doubling of family income is associated with a 24% increase (compared to 40% in model 1) in positive wealth and 15% in the NLSY97 (compared to 21% in model 1). In both cohorts, the parental education coefficients in model 1 decline by about two-thirds with the addition of cognitive ability.
Model 4 adds educational attainment. A one-year increase in educational attainment is associated with a 12% increase in positive wealth in the NLSY79 and a 19% increase in the NLSY97. The effects of cognitive ability on wealth remain substantial. A one-standard deviation difference in cognitive ability is associated with a 53% difference in positive wealth in the NLSY79 and a 31% increase in the NLSY97. There are no significant effects for parents’ education on wealth when considering ability and educational attainment. Family income remains statistically significant: a 100% difference in family income is associated with a 24% difference in positive wealth in the NLSY79 and a 12% difference in the NLSY97.
Occupational attainment was added in model 5. Net of education, occupational status and other variables in model 5, a one standard deviation difference in ability is associated with 43% increase in positive wealth in the NLSY79 and a 25% increase in the NLSY97. The coefficients for family income is largely unchanged.
Model 6 adds average income. Not unexpectedly, average income has strong relationships with wealth: a doubling of average income translates to a 56% increase in wealth in the NLYS79 and a 68% increase in the NLSY97. Ability remains significant, net of the variables in model 6. In the NLSY79, a one-standard-deviation difference in ability is associated with a 33% difference in positive wealth. In the NLSY97, the difference was 10%.
In model 6, family income remains statistically significant. A 100% difference in family income is associated with a 20% difference in positive wealth in the NLSY79 and an 9% difference in the NLSY97. Family- of-origin income has a moderate impact on offspring’s wealth in the NLYS79 and a significantly smaller impact in the NLSY97. The rate of return to wealth from educational attainment has increased: 11% in the NLSY97 and 6% in the NLSY97 (11%). The coefficient for occupational status is much the same for both cohorts: a one unit increase in occupational status was associated with a 1% increase in wealth.
Concluding reMarks
So having finished going over all the results, Marks now concludes:
What is remarkable is the robustness of the effects of cognitive ability. The addition of measures of socioeconomic background only marginally decreases the magnitudes of the coefficients for cognitive ability: by 4 to 7% for grades, 3 to 5% for SAT and ACT performance, nearly 20% for educational attainment, 13 and 14% for occupational attainment and 3 to 10% for income. Importantly, the coefficients for cognitive ability are much the same in the extended family background model compared to the reduced family background model.
And it won’t work trying to complain that he didn’t measure family background properly:
The common response to the much lower than expected explanatory power of socioeconomic background is to argue that the measurement of socioeconomic background is flawed, for example one year of family income is too unreliable and should be averaged over several years, and family wealth is an important but neglected aspect of socioeconomic background. However, the extended socioeconomic background model for the NLSY79—comprising father’s and mother’s occupational status, parental income averaged over 8 years, family wealth averaged over 2 years, as well as the average of parents’ education—did not substantially increase explanatory power for high school grades, and SAT and ACT scores. For educational attainment, the extended model accounted for more variance than the standard model, but in the presence of cognitive ability the extended model did not increase the variance explained. For occupational status and income, there are sizable effects for family in come and significant effects for family wealth, but when considering cognitive ability these effects are small. So, contrary to conventional wisdom, socioeconomic background is a comparatively weak influence on educational and subsequent socioeconomic outcomes.
Marks then goes in for the kill: he talks genetics. He notes that all of these outcomes have genetic bases and indeed show positive genetic correlations. So even a regression finding of parental education having some effect may not mean that in the usual blank slate sense. It might just mean that there are non-intelligence but still heritable factors that parent and children share, say, academic interest. This has in fact been shown already.
Finally, politics:
This study indicates that, to a considerable extent, the US is meritocratic. Ability has substantial effects on each outcome, net of socioeconomic background and relevant proximal influences. Whether this is fair, just, or desirable are different questions.
Substantial effects for cognitive ability does not mean socioeconomic background is irrelevant; it may be especially important for those at each end of the socioeconomic continuum. Sizable effects for cognitive ability do not necessarily mean greater socioeconomic mobility. If cognitive ability is equally distributed across (parental) socioeconomic continuums, then strong effects of cognitive ability will promote socioeconomic mobility. However, if the distribution is skewed towards higher status families, which it tends to be in contemporary Western societies, then there will be much more limited socioeconomic mobility.
Since the 1960s, it has been not infrequently argued in the academic literature that the reproduction of educational, occupational and economic inequalities in Western societies is so egregious and entrenched that it can only be addressed by much greater government intervention and control and, more radically, by dismantling capitalism. This is likely to lead to far more dystopian societies than Young envisioned in his The Rise of the Meritocracy. Educational and occupational attainments would be based, not on ability – or even competence – but on political and ideological criteria. Even a partial or imperfect meritocracy is far preferable to societies where nepotism, cronyism, patronage or political ideology govern access to high status, powerful and well-renumerated occupations.
In other words: the social policies are based falsehoods about the true causes. How can we expect social policies to work when their theoretical basis is so egregiously out of touch with reality? Meanwhile at the Guardian:

And Yale university:

And at Vox:

And at Princeton university:

And at Harvard: