In the last days of 2022, Noah Carl and I had a new paper out:
- Kirkegaard, E. O. W., & Carl, N. (2022). Smart Fraction Theory: A Comprehensive Re-evaluation. Comparative Sociology, 21(6), 677-699.
Previous studies have found that the ability of a country’s cognitive elite is generally more predictive than the average ability. However, these studies have relied on sub-optimal methods. Here, the authors tested smart fraction theory, as it is known, using a pre-residualization approach, which obviates the problem of collinearity. For outcome variables, they utilised the 51 indicators of the Social Progress Index, as well as 6 economic variables. Like in previous research, the authors operationalized the ability of the intellectual class as the 95th percentile score. Consistent with smart fraction theory, they found evidence that the ability of the intellectual class does influence outcomes over and above that of the average ability. For the 93 countries with available data, average ability explained 57% of the variation in country performance. Adding the 95th percentile score increased this to 66%. The authors discuss their findings in light of the existing literature.
The story of the theory is that it was originally proposed 100+ years ago by Terman, and then mentioned by Jensen and Weyl half a decade later. First, Lewis Terman (1916):
The number of children with very superior ability is approximately as great as the number of feeble-minded. The future welfare of the country hinges, in no small degree, upon the right education of these superior 680 Kirkegaard and carl Comparative Sociology 21 (2022) 677–699 children. Whether civilization moves on and up depends most on the advances made by creative thinkers and leaders in science, politics, art, morality, and religion. Moderate ability can follow, or imitate, but genius must show the way.
Nathaniel Weyl 1970:
Thus, very small changes in the average psychometric intelligence of a society can cause it either to become richly endowed with creative and gifted people or to suffer from a dearth of talent. This is the most prob- able explanation of the fact that, throughout most of history, genius and creativity have tended to be concentrated in the hands of a few nations and peoples.
Arthur Jensen 1980:
The social implications of exceptionally high ability and its interaction with the other factors that make for unusual achievements are considerably greater than the personal implications. The quality of a society’s culture is highly determined by the very small fraction of its population that is most exceptionally endowed. The growth of civilization, the development of written language and of mathematics, the great religious and philosophic insights, scientific discoveries, practical inventions, industrial developments, advancements in legal and political systems, and the world’s masterpieces of literature, architecture, music and painting, it seems safe to say, are attributable to a rare small proportion of the human population throughout history who undoubtedly possessed, in addition to other important qualities of talent, energy, and imagination, a high level of the essential mental ability measured by tests of intelligence.
However, no one really bothered quantitatively testing the theory in a comparative framework until much later, in 2002, when the mysterious La Griffe du Lion wrote his famous blogpost The Smart Fraction Theory of IQ and the Wealth of Nations. After this, the theory sat around again gathering dust, until Heiner Rindermann, Michael Sailer and James Thompson took up the mantle in 2009.
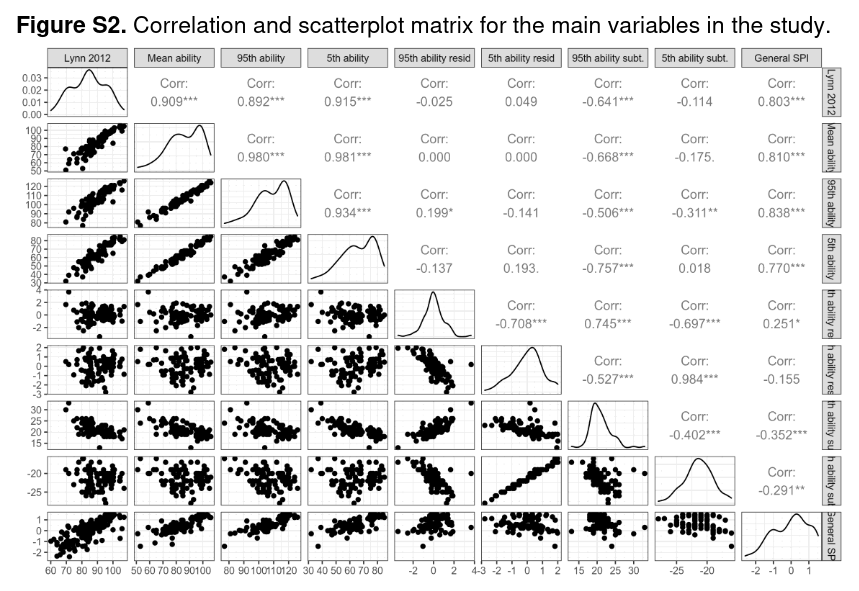
The problem with the Rindermann studies is that they used methods that could not properly test the model against the simpler model of average ability, and the Griffe approach was even worse. The innovative part of our new study is that we figured out a method for doing such a test using a residualization approach. One cannot just take the lower tail and upper tail ability levels and plug them into a regression together with mean ability because they are correlated too strongly, at .98 in fact:
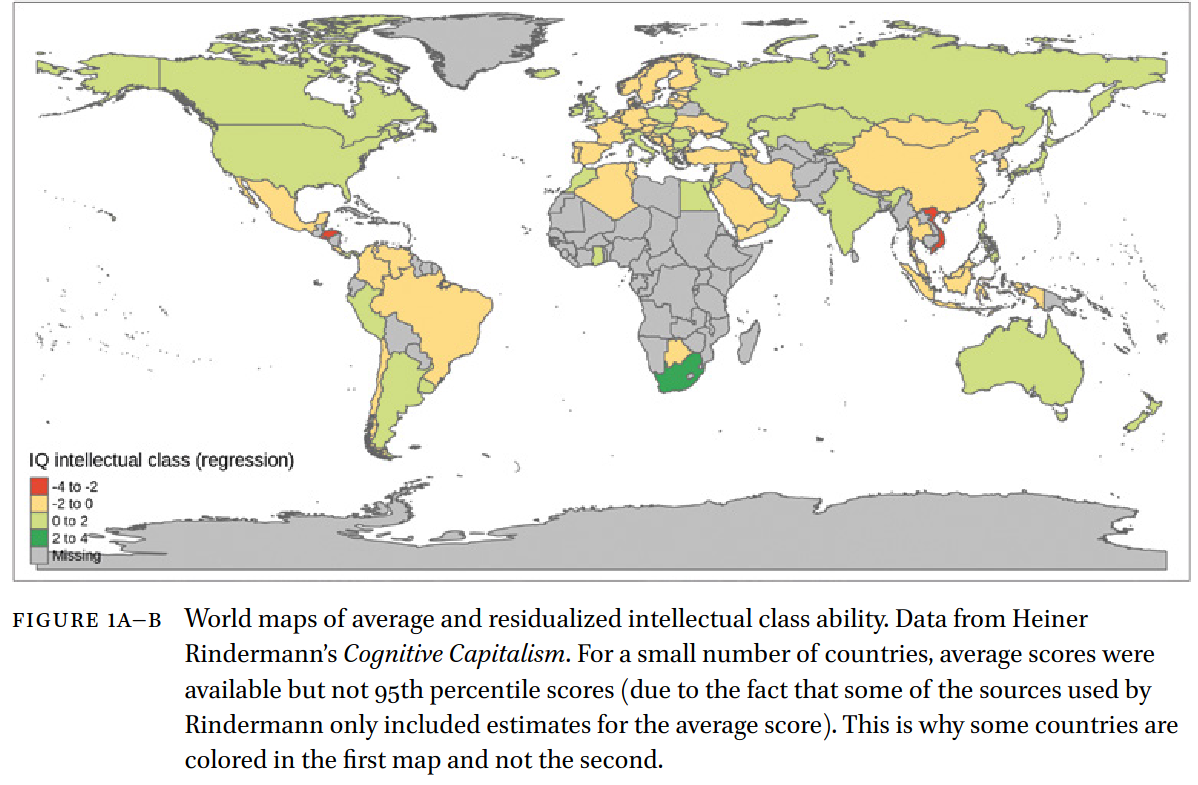
But one can remove the mean ability from the tail ability estimates, thus giving a kind of tail deviation score. These scores tell you how much better the tails of the distributions are doing relative to the mean ability level. Since these residuals are now uncorrelated with the mean, they can all be used together in a regression model like normal. Here’s a map of the tail ability:
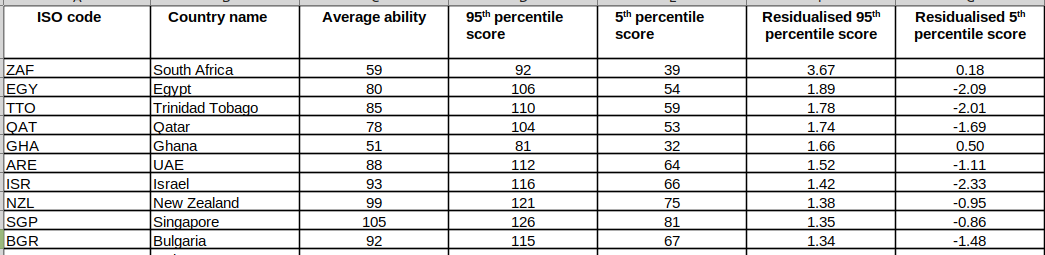
The countries with the best performing tails (again, relative to their mean) are:
(You can download the dataset here.)
So South Africa is the least surprising as it has a large but shrinking European minority in a land of Sub-Saharan Africans. The oil countries presumably have imported some elite foreigners whose kids participate in PISA. It’s not obvious why Bulgaria and New Zealand are doing well, nor Ghana for that matter, but that’s what the data say. These data are based mainly on PISA scores, where the top 5% and bottom 5% scores were saved and used for this analysis. These data were compiled by Rindermann and are in fact out of date, but it was too much work for us to download the datasets for every PISA, TIMSS etc. wave and estimate the values again. This is important work going forward.
The data limitations aside, the primary results look like this:
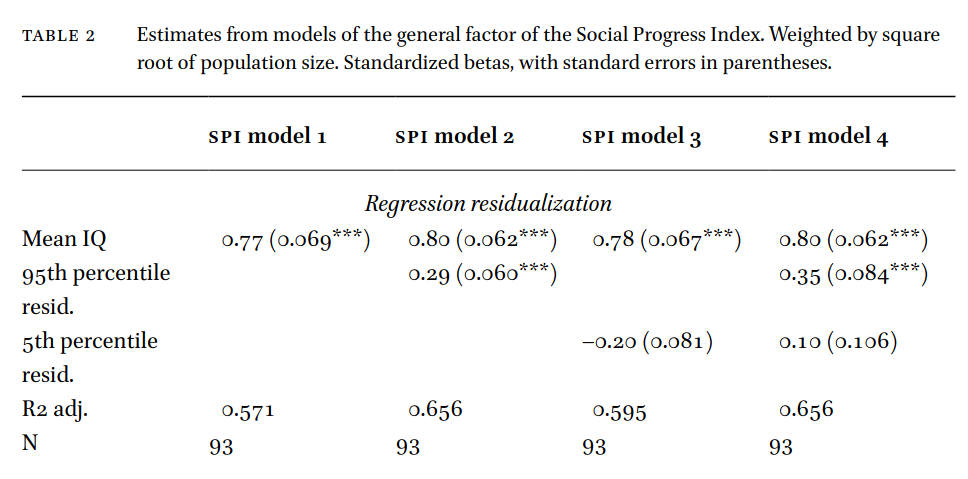
Here we are predicting the social progress index general factor. That’s what I in 2014 called the general socioeconomic factor (S), based on the observation that almost everything good goes together between countries. Those that do well with education also do well with health, have less corruption, have better roads, earn higher incomes etc. This is essentially a better version of the commonly used Human Development Index, but with less emphasis on GNI/GDP. These economic metrics are biased by resource economies (mainly oil) and tax havens (e.g. Ireland).
Looking at the 4 models, we see that mean IQ itself does well with a beta of 0.77 (model 1). Adding the smart fraction metric about the 95% ability level improves the model (model 2). However, the bottom 5% doesn’t do anything (model 3 and 4). This is without any controls, but adding them doesn’t change the pattern, just lowers the values a bit:
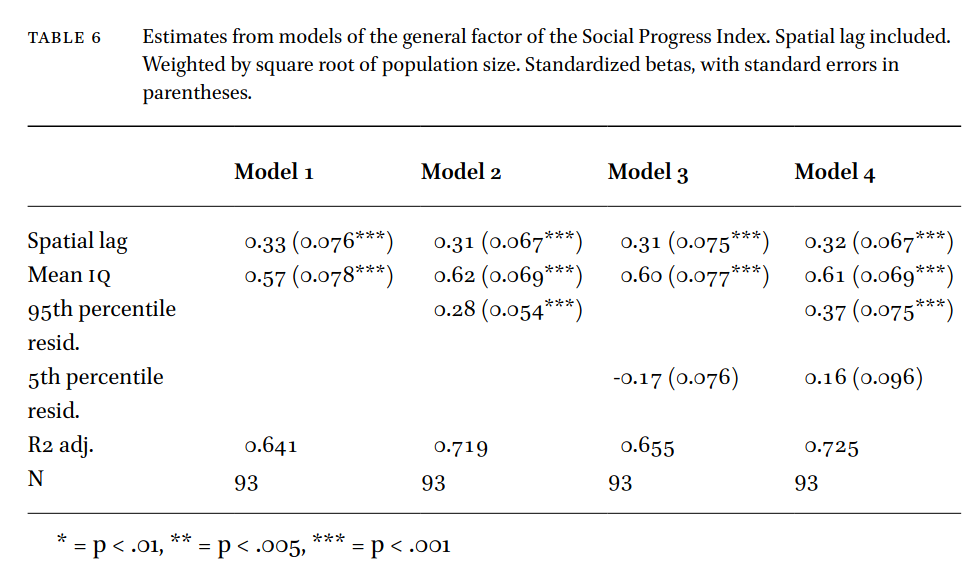
Here we controlled for the spatial autocorrelation of SPI. That is, the predicted value of SPI if one were to guess based on the 3 closest countries. This approach controls for anything that neighboring countries have in common, most obviously, geographical factors (latitude, climate), continent, language (to some extent) and so on. Still, we see clear effects of mean and 95% ability levels, and not so much for the bottom 5%. Spatial lag has a decent sized validity, which captures these other unmeasured factors, whatever they might be exactly.
Furthermore, we expanded this analysis to each of the 40+ indicators of the SPI. We did the same thing there, i.e., fit these 4 models, and checked how much the 95% ability index added. Generally, it adds quite a bit and often has a p value below .01:
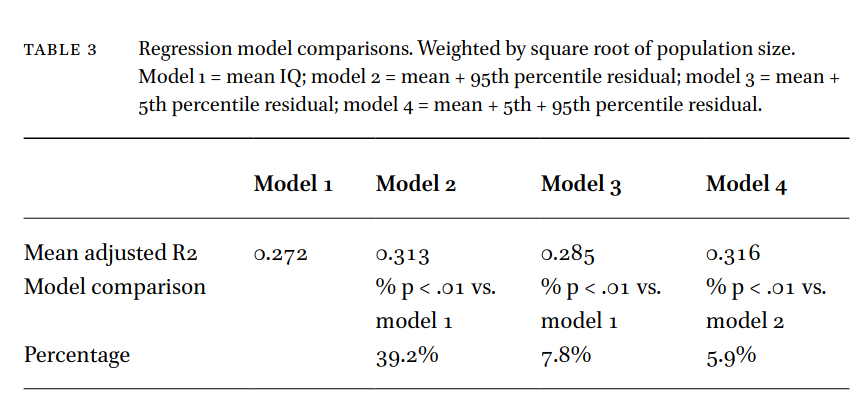
So here, on average, adding the 95% ability adds another 4%points of explained variance, and in about 40% of the model comparisons, this addition reached p < .01. The bottom 5% ability did much worse, though still above chance levels, even controlling for 95% ability level.
We also checked previously reported findings by Rindermann et al and these were mostly confirmed with our new method. And finally, we checked whether this is also true for economic outcomes, and we found it was. So all in all, this comprehensive check of smart fraction theory was a big success for the theory!
What’s the take-away? Well, nurture the best and brightest! If civilization depends on the few brightest among us, then it would be very smart to make sure their talents are not wasted. However, we are doing exactly that, while focusing on raising the ability of the bottom 5%:
Our finding that intellectual class ability has incremental validity over and above average ability suggests that funding elite education may be the most effective way to boost national performance. However, elite schools are increasingly unpopular in the West, as their student bodies often show large ethnic or racial disparities (Warne, 2022). For example, in the United States, Asians are typically overrepresented, while blacks are underrepresented. This makes them common targets for either defunding or affirmative action, the latter undermining the purpose of elite education.
This sad conclusion is not really new either. The Bell Curve spent some time discussing the situation in the 1994 and it hasn’t improved, but probably gotten worse. There was a big 2004 report on gifted education fittingly titled A Nation Deceived: How Schools Hold Back America’s Brightest Students. This was a follow-up on the 1983 report called A Nation at Risk: The Imperative for Educational Reform. You get the picture.
Aside from making sure our gifted programs are actually running, another good thing to do is make sure we find all the gifted children to put in them. Many of them hail from middle class or lower class homes, and their talents aren’t always appreciated. They might even hide them to fit, Good Will Hunting style. So we should simply do universal screening:
- Card, D., & Giuliano, L. (2016). Universal screening increases the representation of low-income and minority students in gifted education. Proceedings of the National Academy of Sciences, 113(48), 13678-13683.
Low-income and minority students are substantially underrepresented in gifted education programs. The disparities persist despite efforts by many states and school districts to broaden participation through changes in their eligibility criteria. One explanation for the persistent gap is that standard processes for identifying gifted students, which are based largely on the referrals of parents and teachers, tend to miss qualified students from underrepresented groups. We study this hypothesis using the experiences of a large urban school district following the introduction of a universal screening program for second graders. Without any changes in the standards for gifted eligibility, the screening program led to large increases in the fractions of economically disadvantaged and minority students placed in gifted programs. Comparisons of the newly identified gifted students with those who would have been placed in the absence of screening show that Blacks and Hispanics, free/reduced price lunch participants, English language learners, and girls were all systematically “underreferred” in the traditional parent/teacher referral system. Our findings suggest that parents and teachers often fail to recognize the potential of poor and minority students and those with limited English proficiency.
What are we waiting for?