In medicine, there are two normal dose-response functions for a chemical (or other treatment) and your health. In the first case, any amount of the chemical is bad and more is always worse, a monotonic relationship. The curve may not be linear, maybe there will be a saturation effect so that adding more of a chemical will only increase the harms a bit (diminishing returns), or it might be curving upwards so that the harms are accelerating. Think of heavy metals like lead or cadmium. In the second case, the curve is non-monotonic, meaning that the curve changes direction and possibly the chemical is beneficial at some dose. This second dose-response function with an optimal level with benefits is called hormesis, or what doctors call the J-curve. It is the norm for most things we regularly consume such as water, vitamins, food, sunlight, and even oxygen. Here’s some possible dose-response functions for illustration purposes:
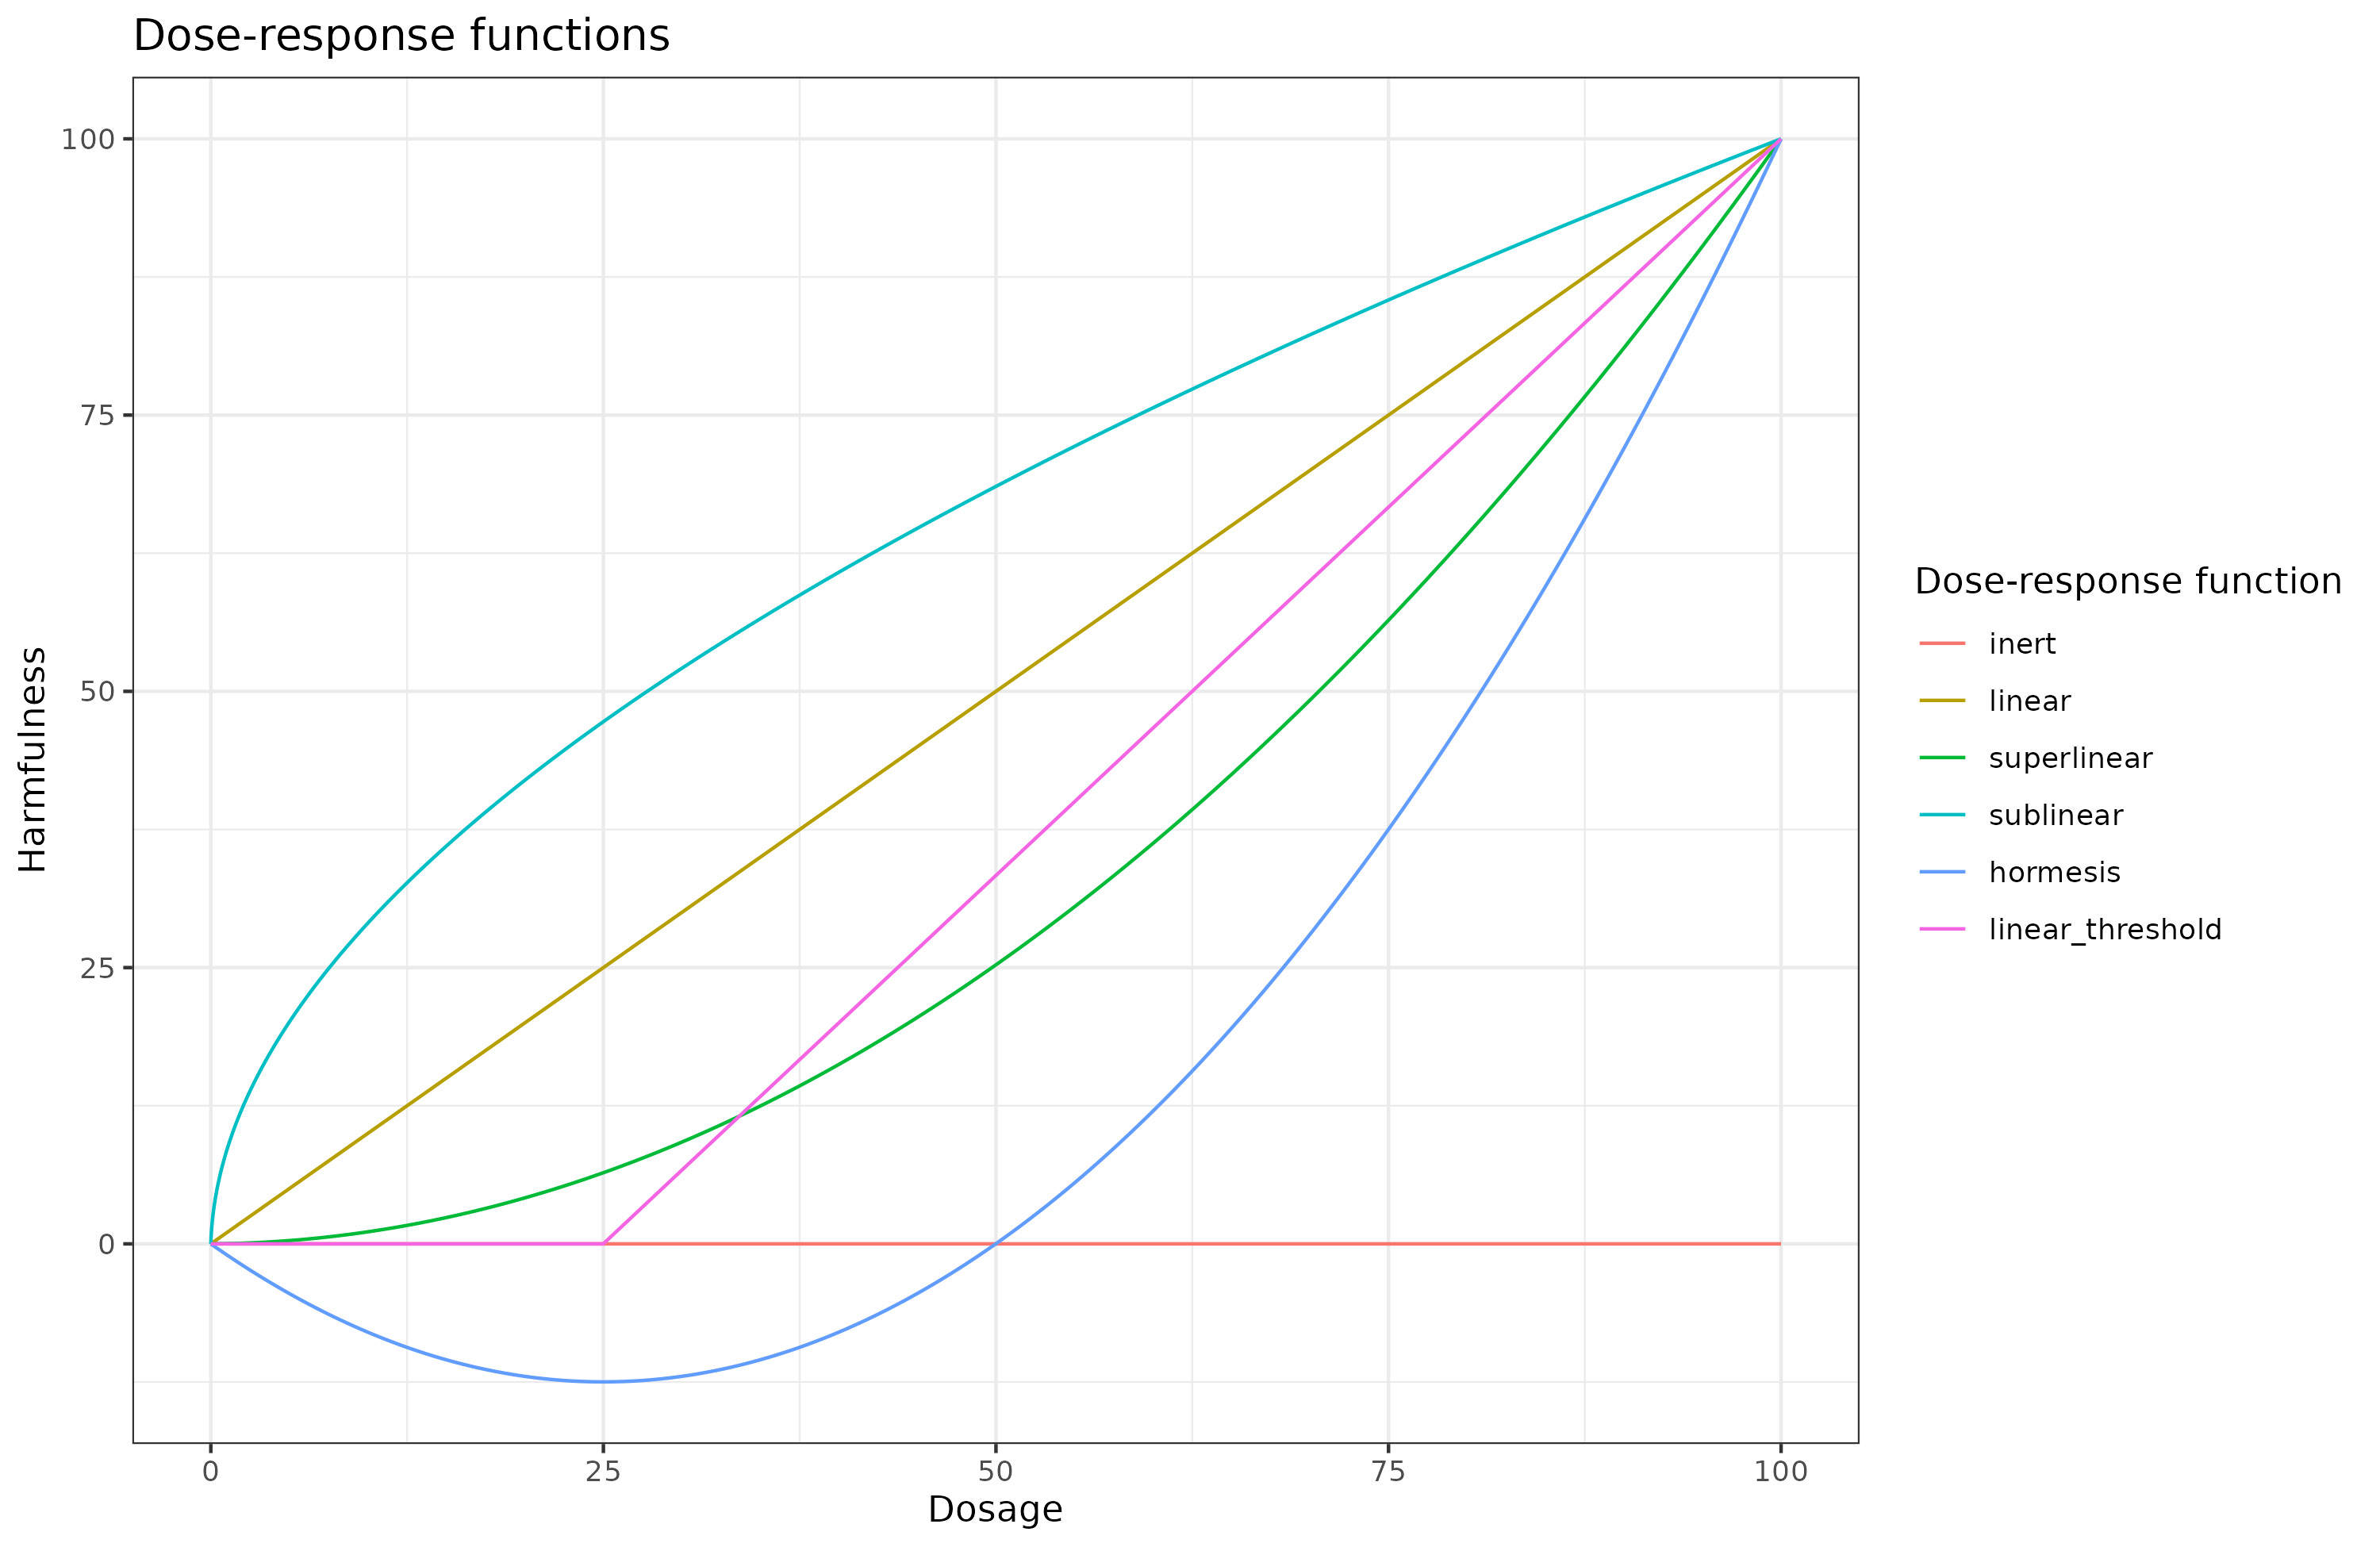
I have arbitrarily set the harmfulness scale to 0-100, which you could interpret as 0 = does nothing and 100 = lethal. Every curve is normalized so that x=0 is y=0, and x=100 is y=100. Since positive Y values are harmful, negative values are beneficial. With that in mind, let’s go over the various possible options outlined:
- Inert: the chemical does nothing at all no matter the dose. Probably nothing truly follows this pattern, but some things probably get close for all practical purposes (nitrogen in air?).
- Linear: harms are directly proportional to the intake.
- Superlinear: harms increase with larger doses.
- Sublinear: harms of an additional amount decrease with larger doses. This pattern occurs with various infections by viruses or bacteria, where a small dose will give you the infection but getting a 100x larger initial dose probably isn’t that much worse.
- Hormesis: initial dose is beneficial (negative y value) but it gets harmful with larger doses. In the plot above, a dose of 25 is optimal for health.
- Linear threshold: some initial amount does nothing (inert) but at some threshold (at x=25 here), the body becomes unable to cope with it and it starts being harmful proportional to the intake.
With this in mind, which function does alcohol consumption follow? It’s difficult to tell for multiple reasons:
- We can’t easily randomize people into consuming different amounts for many years to study the effects without confounding. (“Hello, would you like to participate in a study where I throw dice to determine your drinking habits for the next few decades?”)
- It is difficult to measure how much people drink as self-report data for diet and drinking is not great.
- Some conditions we care about are rare, so we need huge datasets to see the effect in the noise (or wait until everyone has died in the study).
- People regularly changing their drinking habits over time. Someone who used to binge drink or was addicted to alcohol may now be a non-drinker. Ideally, then, we would like some kind of life-long data from people, which is not generally possible to acquire.
With that in mind, let’s look at some results. I’m relying mainly on this review from 2020 which seemed moderate compared to many others:
- Hendriks, H. F. (2020). Alcohol and human health: what is the evidence?. Annual review of food science and technology, 11, 1-21.
Alcohol consumption has long been a part of human culture. However, alcohol consumption levels and alcohol consumption patterns are associated with chronic diseases. Overall, light and moderate alcohol consumption (up to 14 g per day for women and up to 28 g per day for men) may be associated with reduced mortality risk, mainly due to reduced risks for cardiovascular disease and type-2 diabetes. However, chronic heavy alcohol consumption and alcohol abuse lead to alcohol-use disorder, which results in physical and mental diseases such as liver disease, pancreatitis, dementia, and various types of cancer. Risk factors for alcohol-use disorder are largely unknown. Alcohol-use disorder and frequent heavy drinking have detrimental effects on personal health.
The most general thing to look at is overall mortality risk. Here’s the evidence the review cites. First, Jayasekara et al 2014 a meta-analysis:
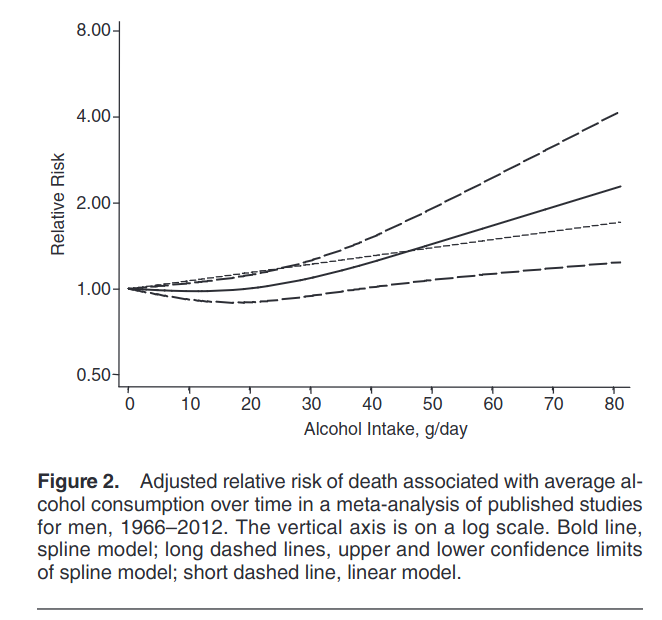
If you squint, the line dips slightly below 1 and increases later. Mostly, it looks like the linear threshold with a threshold around 20 grams per day. The authors however tell us:
The reported relative risks for men, mapped onto the defined intake categories used to derive pooled relative risks for comparable categories of intake, are given in Table 3 (number and percent of men in each intake category are available in Supplementary Data). We derived the following pooled relative risks by intake category: for 1–29 g/day, 0.90 (95% confidence interval (CI): 0.81, 0.99); for 30–59 g/day, 1.19 (95% CI: 0.89, 1.58); and for 60 or more g/day, 1.52 (95% CI: 0.78, 2.98) (Figure 3) compared with abstention. Visual inspections of the forest plot and funnel plot (Figure 4) for men did not show marked publication bias. Egger’s test results confirmed this finding: for 1–29 g/day, P = 0.31; for 30–59 g/day, P = 0.65; and for 60 or more g/day, P = 0.54. The inverse association for an intake of 1–29 g/day did not change much when the analysis was repeated excluding 1 study at a time (excluding Lazarus et al. (23), relative risk (RR) = 0.90, 95% CI: 0.80, 1.02; excluding Goldberg et al. (24), RR = 0.88, 95% CI: 0.77, 1.01; excluding Emberson et al. (28), RR = 0.90, 95% CI: 0.80, 1.00; excluding Beulens et al. (29), RR = 0.88, 95% CI: 0.77, 1.00; excluding Britton et al. (33), RR = 0.94, 95% CI: 0.87, 1.01; and excluding Fillmore et al. (25), RR = 0.87, 95% CI: 0.78, 0.97).
So it appears their reported numerical results are inconsistent with the figure. They report that the average value for the 1-29 g/day line is 0.90, but it looks like about 0.99 to me. But in any case, their confidence interval is 0.81 to 0.99, so this meta-analysis of 6 studies is underpowered to study this question. The dose-response function does look slightly nonlinear and the spline model test vs. linear is p = .02, which is not convincing either.
Here’s a second set of results from Ferrari et al 2014:

Unhelpfully, they are split by sex and the axes are swapped compared to the plots above (so you may want to tilt your head 90 degrees). Let’s look at the first two sets for overall mortality (top row). The mortality rate for the non-drinkers are higher than the light-moderate drinkers. In fact, they are too high! The non-drinkers have similar mortality rate to heavy drinkers. That doesn’t seem very likely. More likely, non-drinkers are weird in some other way that confounds the results. The authors let us know all the things they controlled for:
Cox proportional hazard models were used to compute mortality HR, and 95% CIs, for categories of average lifetime alcohol use; never drinkers, 1–4.9 g/day (reference category), 5–14.9, 15–29.9, 30–59.9, ≥60 g/day. In women, the last two alcohol categories were collapsed into a ≥30 g/day group. Time in the study up to death, loss or end of follow-up, whichever came first was the primary time variable. The Breslow method was adopted for handling ties. Models were stratified by centre to control for differences in questionnaire design, follow-up procedures and other centre-specific effects.13 Systematic adjustments were undertaken for age at recruitment, body mass index and height (continuous), an indicator for participants who quitted alcohol drinking, time since alcohol quitting (continuous), smoking (never, current with 1–15 cigarettes/day, current with more than 15 cigarettes/day, former smoker that quitted less than 10 years before recruitment, former smoker that quitted more than 10 years before recruitment, current smoker of other than cigarettes, unknown (n=8819)), duration of smoking (continuous), age at start smoking (less than 19 years, more than 19 years, unknown (n=39 041)), educational attainment (five categories of level of schooling: none, primary, technical or degree or more, unknown (n=14 223)) as a proxy variable for socioeconomic status, physical activity (inactive, moderately inactive, moderately active, active, unknown (n=328)) and energy intake (continuous). In women the models were further adjusted for menopausal status (dichotomised as natural postmenopausal or surgical vs premenopausal or perimenopausal, as assessed at baseline), ever use of replacement hormones, and number of full-term pregnancies (nulliparous, one or two children, more than three, unknown (n=6482)). Indicator variables specific to some of the confounding factors were used to model missing values, after checking that the parameters associated with these indicators were not statistically significantly associated with risk of death.
It doesn’t include intelligence, but it does include a lot of stuff one might otherwise suggest as confounders, including educational level/social status, smoking, BMI, and exercise. Yet their results are hard to believe to be true estimates of alcohol’s benefits. So what gives? The effect size is too large to be believed, but they controlled for a lot of confounders. One thing they didn’t control for, however, is ethnicity or religion. Notice how in their plot death from accidents and injuries are elevated for non-drinkers. The typical non-drinker I know is a nerdy introvert on the autistic spectrum. These people are risk-averse and do not die of accidents and injuries a lot. Thus, we need another population that could confound the results that doesn’t drink yet have high accident and violence rates and isn’t adjusted for, like, Muslim immigrants. The data from this study are from 10 European countries, so this hypothesis fits across the board. Maybe this can explain some of the too-high-to-believe mortality rate of the non-drinkers.
So I looked around for more recent studies, especially one without a potential Muslim immigrant confound. Here’s a large American study by Kunzmann et al 2018:
We report a population-based cohort study using data from 99,654 adults (68.7% female), aged 55–74 years, participating in the U.S. Prostate, Lung, Colorectal, and Ovarian (PLCO) Cancer Screening Trial. Cox proportional hazards models assessed the risk of overall and cause-specific mortality, cancer incidence (excluding nonmelanoma skin cancer), and combined risk of cancer and death across categories of self-reported average lifetime alcohol intakes, with adjustment for potential confounders. During 836,740 person-years of follow-up (median 8.9 years), 9,599 deaths and 12,763 primary cancers occurred. Positive linear associations were observed between lifetime alcohol consumption and cancer-related mortality and total cancer incidence. J-shaped associations were observed between average lifetime alcohol consumption and overall mortality, cardiovascular-related mortality, and combined risk of death or cancer. In comparison to lifetime light alcohol drinkers (1–3 drinks per week), lifetime never or infrequent drinkers (<1 drink/week), as well as heavy (2–<3 drinks/day) and very heavy drinkers (3+ drinks/day) had increased overall mortality and combined risk of cancer or death. Corresponding hazard ratios (HRs) and 95% confidence intervals (CIs) for combined risk of cancer or death, respectively, were 1.09 (1.01–1.13) for never drinkers, 1.08 (1.03–1.13) for infrequent drinkers, 1.10 (1.02–1.18) for heavy drinkers, and 1.21 (1.13–1.30) for very heavy drinkers. This analysis is limited to older adults, and residual confounding by socioeconomic factors is possible.
Their results:

Their curves show a particularly clean hormesis pattern. By looking at the various outcomes, this is clearly due to cardiovascular health, as the relationships for the other causes of death were monotonically increasing. Still, their results are hard to believe. Are we to think that being a non-drinker and drinking 4 drinks a day are equivalent from a health perspective, overall? That seems very difficult to believe. I would guess the problem here is that people who are sick and dying avoid alcohol, putting them in the non-drinker category. Based on this hypothesis, one would have to use only old data about drinking to predict mortality. They controlled for a bunch of things, but not this particular worry:
Adjusted models included race/ethnicity (non-Hispanic white, non-Hispanic black, Asian, Hispanic/Other), study centre, randomisation group (control group or screening group), body mass index (BMI), year of DHQ completion, smoking status by pack-years (never smokers, former smoker reporting ≤25 pack-years, former smoker reporting ≥25 pack-years, current reporting ≤25 pack-years, current reporting ≥25 pack years, cigar/pipe only smokers), marital status, education, family history of cancer (cancer outcomes only), intakes of total energy (kcal/day), calcium, red meat, processed meat, fiber, coffee, fruit and vegetables, and menopausal hormone replacement therapy use (HRT, in women only). No model selection for confounders was done, as recommended by the reviewer; all variables were included. At the reviewer’s suggestion, BMI, intakes of total energy, calcium, red meat, processed meat, fiber, coffee, fruit and vegetables were included as continuous variables instead of categorical variables.
However, the problem with the counter-hypothesis above is that it should also result in spurious benefits of alcohol for other causes of death, but it doesn’t. The specificity of alcohol’s benefits for cardiovascular problems is hard to explain by an unobserved confounder, as it has to be equally specific. It is also difficult to fault them for their measure of alcohol use, which mostly used older data, reducing the worry about my counter-hypothesis:
Alcohol consumption was assessed using the validated PLCO Diet History Questionnaire (DHQ) [16], which was introduced into the trial in December 1998 and was completed by approximately 77% of all participants in both arms of the trial. Participants recruited after 1998 completed the DHQ at baseline for the nonscreening arm and approximately 3 years after baseline for the screening arm, whereas previously recruited participants were invited to complete the DHQ in 1999 or 2000.
he DHQ assessed historical drinking by inquiring about the amount of beer (12 ounce bottles or cans: 1 U.S. Department of Agriculture My Pyramid cup equivalent [17]), wine (5 ounce glasses: 1 cup equivalent), and liquor (1.5 ounce shots, including mixed drinks: 1 cup equivalent) the participant consumed per week between the ages of 18 and 24, 25 and 39, 40 and 54 years old, and at 55+ years, respectively. The DHQ also inquired about the amount and frequency the participant drank beer, wine (or wine coolers), and liquor (including liquor in mixed drinks) over the previous summer, as well as the rest of the previous year, to account for seasonal differences. The frequency was converted into days and an average daily alcohol intake of each type of alcohol was calculated as follows…
Another idea is that individuals who tend to have overall weak health avoid alcohol as a self-protection mechanism, and this isn’t related to being close to death. This idea could be tested for using polygenic scores or family history, but it’s not something I’ve seen in a study.
Here’s another large study from Sweden (Licaj et al 2016):
Methods Among 48 249 women at baseline (33 404 at follow-up) in the prospective Swedish Women’s Lifestyle and Health cohort, age 30–49 years at baseline, we used repeated information on alcohol consumption and combined this method with multiple imputation in order to maximise the number of participants and deaths included in the analyses. Multivariable Cox regression models were used to calculate HRs for overall and cause-specific mortality.
Results During >900 000 person/years, a total of 2100 deaths were recorded through Swedish registries. The median alcohol consumption increased from 2.3 g/day in 1991/1992 (baseline) to 4.7 g/day in 2004 (follow-up). Compared with light drinkers (0.1–1.5 g/day), a null association was observed for all categories of alcohol consumption with the exception of never drinkers. The HR comparing never with light drinkers was 1.46 (95% CI 1.22 to 1.74). There was a statistically significant negative trend between increasing alcohol consumption and cardiovascular and ischaemic heart diseases mortality. The results were similar when women with prevalent conditions were excluded.
Conclusions In conclusion, in a cohort of young women, light alcohol consumption was protective for cardiovascular and ischaemic heart disease mortality but not for cancer and overall mortality.
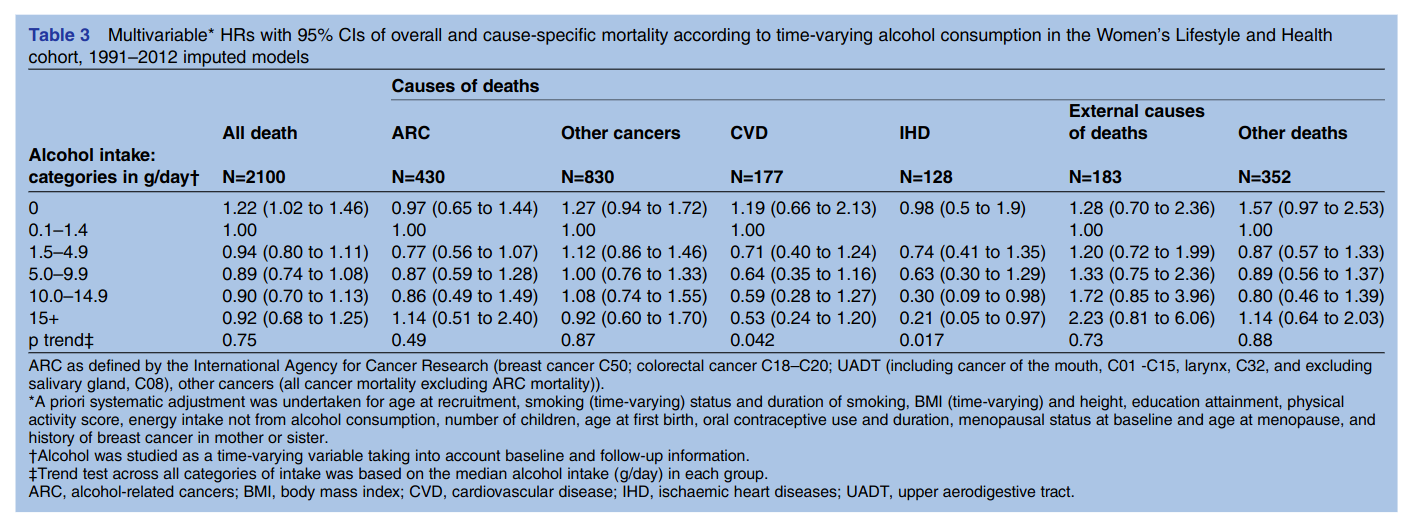
Despite the large sample size, the results were actually mostly uninformative (confidence intervals too large), though showed the same hormesis pattern for overall mortality (“all death”). They didn’t adjust for ethnicity/immigration status as far as I can tell, so it doesn’t remove that worry either. This result was replicated in another large Swedish cohort (Bellavia et al 2014):
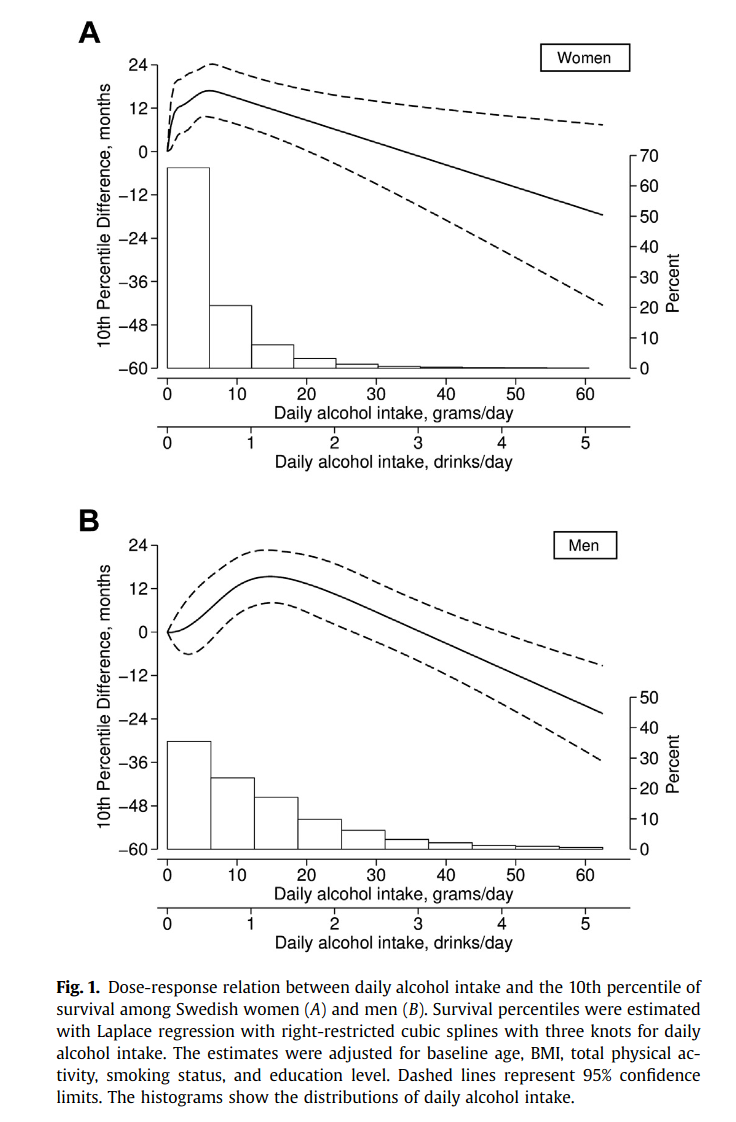
Their plots show that light-moderate drinkers lived about 12-15 months longer.
Conclusions and speculations
We could go on, there’s a study here using the UK Biobank (same results; Ding 2021), a large Chinese one (same results, Zhang 2021), and one from Australia (same pattern, Jayasekara 2014). At this point, we should look at some other kind of evidence to settle matters as more of the same doesn’t really convince us any further. Maybe animal studies? Can we find the alcohol hormesis pattern in rats or pigs? I don’t see any mice studies. What about twin control studies? These naturally control for either half or all the genetic confounding, as well as the rearing environment. I can’t see any twin control studies either. On balance of evidence then, we probably have to accept that there is a hormesis pattern for alcohol and health. This conclusion was also reached by these researchers who reviewed many of the same studies (Skovenbord 2020):
Design/methodology/approach
A review of the evidence from the first observation of a J-shaped association between a moderate alcohol intake and CHD in 1926 to recent studies of the effect of healthy lifestyles (including moderate alcohol intake) on life expectancy free of cardiovascular disease (CVD), cancer and Type 2 diabetes. An update on the biological plausibility of the J-shaped association with focus on recent findings of the association of alcohol intake and blood lipid levels.
Findings
Plausible J-shaped relations between light to moderate alcohol consumption and the risk of CHD, CVD mortality and all-cause mortality have been found in a large number of robust epidemiological studies. Among the potential mechanisms underlying the proposed protective effects are higher levels of high-density lipoprotein lacking apolipoprotein C3, reduced platelet aggregability, increased level of endothelial cell fibrinolysis, increased insulin sensitivity and decreased inflammation.
Originality/value
The existence of a J-shaped association between alcohol consumption and the risk of CHD and all-cause mortality is based on observational evidence and accordingly challenged by a degree of uncertainty leading some public health circles to state: “there is no safe level of alcohol consumption.” The authors propose that communication on the pros and cons of alcohol intake should emphasize the nadir of a J-shaped curve as a healthy range for the general population while advice regarding the consumption of alcohol should be adjusted to factor in the risks and potential benefits for each individual patient considering age, sex, family history, personal drinking history and specific medical history.
A hormesis pattern is not totally crazy from an evolutionary perspective. Humans (not all populations) have adapted to alcohol use for some 5k-15k years. Given the long-time use, it is possible that evolution has found ways to utilize alcohol in a positive way. This would represent another cool case of gene-culture co-evolution.
I suggest considering alcohol consumption as a longevity research topic the next time you argue about effective altruism. It would be very funny if health conscious autists were told to drink more by their doctors in order to live longer. One could get hi-tech about it with automated dispensers attached to the body (alcohol IV drop) that keeps the person at the right level of drunkenness.
Extra: alcohol and brain size
There is a UK Biobank study that looked at alcohol consumption and brain size (Daviet 2022). Since we know that people who drink light to moderately are slightly smarter than those who don’t drink at all, and both are much smarter than those who get addicted, we would expect a weak hormesis pattern here as well, And that seems to be what is seen:
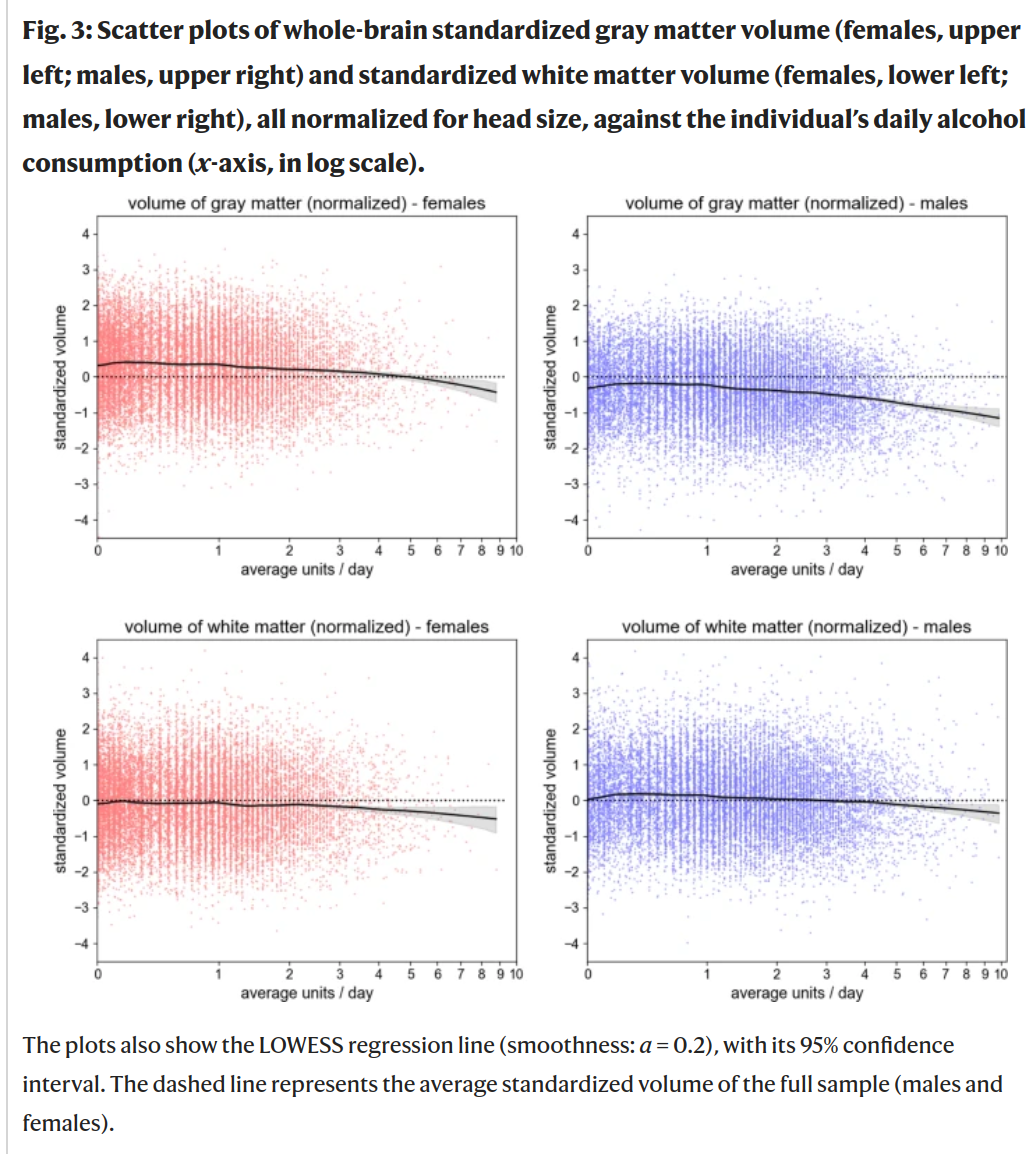
The pattern is very slightly positive in the low consumption zone, most clearly for white matter and men (bottom right).