There’s a new study out of note:
- Xia, R., Jian, X., Rodrigue, A. L., Bressler, J., Boerwinkle, E., Cui, B., … & Fornage, M. (2024). Admixture mapping of cognitive function in diverse Hispanic and Latino adults: Results from the Hispanic Community Health Study/Study of Latinos. Alzheimer’s & Dementia.
INTRODUCTION We conducted admixture mapping and fine-mapping analyses to identify ancestry-of-origin loci influencing cognitive abilities.
METHODS We estimated the association of local ancestry intervals across the genome with five neurocognitive measures in 7140 diverse Hispanic and Latino adults (mean age 55 years). We prioritized genetic variants in associated loci and tested them for replication in four independent cohorts.
RESULTS We identified nine local ancestry–associated regions for the five neurocognitive measures. There was strong biological support for the observed associations to cognitive function at all loci and there was statistical evidence of independent replication at 4q12, 9p22.1, and 13q12.13.
DISCUSSION Our study identified multiple novel loci harboring genes implicated in cognitive functioning and dementia, and uncovered ancestry-relevant genetic variants. It adds to our understanding of the genetic architecture of cognitive function in Hispanic and Latino adults and demonstrates the power of admixture mapping to discover unique haplotypes influencing cognitive function, complementing genome-wide association studies.
Admixture mapping or local ancestry analysis (or regression) is a cool method for finding specific genetic causes of ancestry (race) differences in phenotypes. It is the more advanced version of the global ancestry analyses we have been publishing studies based on in the last couple of years (Kirkegaard et al 2019, Lasker et al 2019, Fuerst et al 2023). Global ancestry analysis asks: are genome-wide ancestry proportions predictive of phenotypes? Local ancestry analysis asks: are there particular regions of the genome where ancestry predicts phenotypes? The latter is more informative since it tells you which genes are involved, and if you know their functions, you know something about the causal pathway of genetic causation. In other words, these are Eric Turkheimer’s worst nightmare.
In their study, they had a large sample of Hispanic subjects from “four US metropolitan areas (Chicago, Illinois; Bronx, New York; Miami, Florida; and San Diego, California)”. Hispanics are great for this analysis because they have a 3-way admixture from European (mainly Iberian), Amerindian (the natives), and African ancestry (from Caribbean former slaves). Hispanics’ admixture is very old which means the ancestry blocks will be smaller, as they statistically tend to breakup every generation, and it has been doing so for about 500 years since their ancestors started mixing at the time of Columbus.
The intelligence testing consisted of some relatively poor and easy tests, as this battery was designed to screen for dementia. The tests were: “the Six-Item Screener (SIS, global mental status), Brief Spanish English Verbal Learning Test (B-SEVLT, verbal learning and memory), Word Fluency Test (WFT, executive and verbal functioning), and Digit Symbol Substitution Test (DSST, psychomotor speed and sustained attention).” Nevertheless, the authors extracted a g factor. I don’t see anywhere they reported the factor loadings, but it is probably not a great g factor, but still better than the individual tests.
Theoretically, admixture mapping should result in something like this:
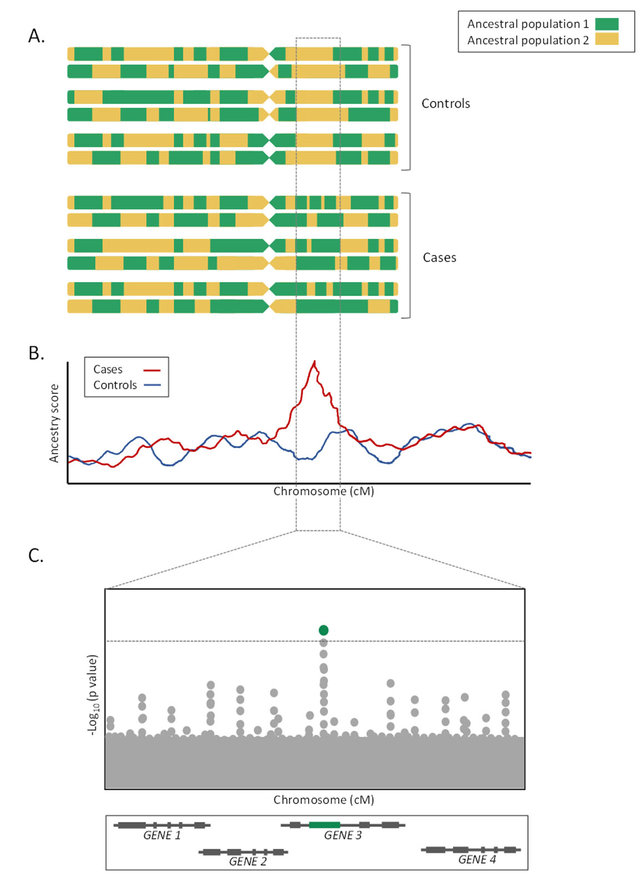
In this hypothetical example, we are studying some kind of disease with a genetic cause that differs by ancestry. But why? By looking around at the genome to see where the cases and controls differ the most in ancestry, one can figure out which genes are causing the difference. In the above, that’s in GENE 3.
The authors used this approach to find genes that explain intelligence differences among the Hispanics. Here’s their table of results:
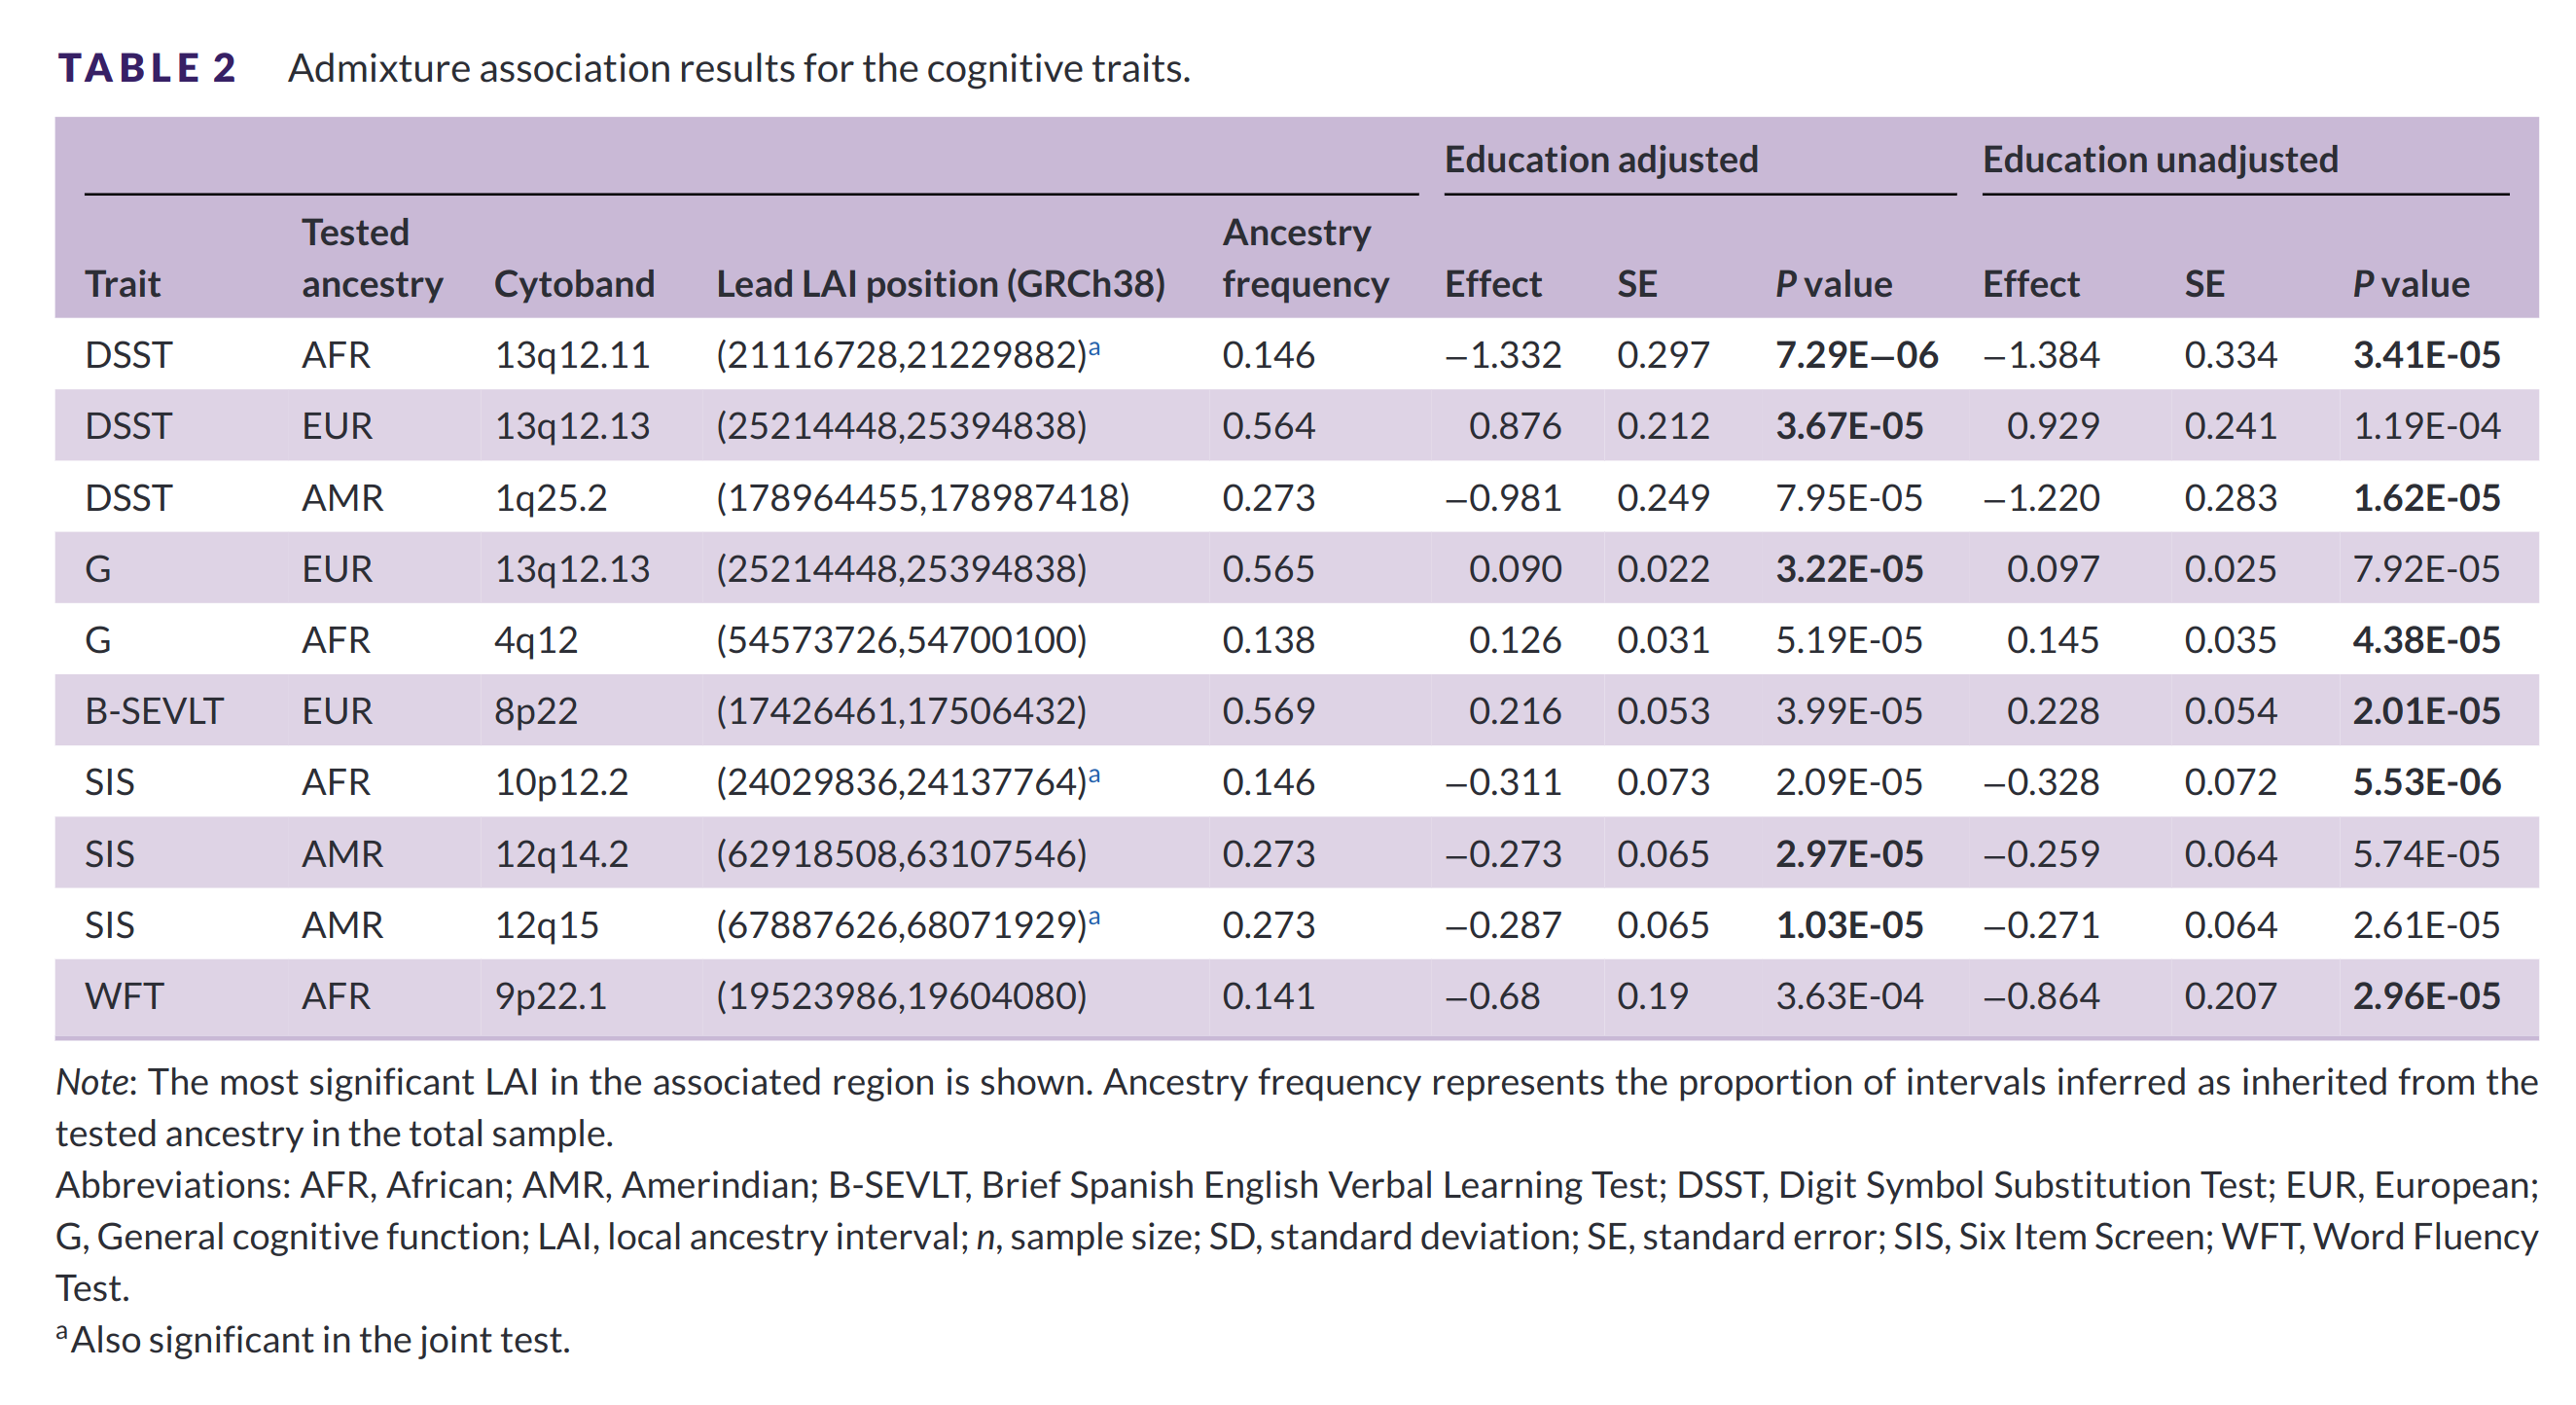
They found 10 regions with a local ancestry effect. Of the 10, only 1 is not the most likely direction given the genetic (hereditarian) model of intelligence. That is to say, the most likely finding according to the model is that Amerindian and African have negative effects if considered to contrast with European. They seem to have tested the ancestries one at a time because their results include hits for all 3 ancestries, whereas if they were doing a multiple regression model, there should only be 2 ancestries with betas since the reference is set to 0. Ignoring this, the directions of results are:
- European: 3 hits, 3 positive effects
- Amerindian: 3 hits, 3 negative effects
- African: 4 hits, 1 positive, and 3 negative effects
What this means is that insofar as predicting intelligence from ancestry is concerned, these 10 regions probably contain causal variants that differ in frequency by ancestry. In 9 of the 10 cases, the direction is what the genetic model would consider the most likely. If evolution has resulted in different levels of intelligence in the 3 ancestries (races), then we should be able to find the exact genes responsible for this.
It should be noted that a hereditarian model does not predict that every local ancestry effect will show the EUR>AFR/AMR pattern. It can be that evolution happened to select more for some intelligence increasing genes in some populations. In other words, if Europeans have higher genetic intelligence than Africans, it doesn’t mean they have better versions of all genetic variants that cause higher intelligence, just on average more than half of them (again, skipping some complexity of uneven effect sizes and frequency differences). In this particular case, it seems that Africans have more of some favorable genetic variant near the 4q12 region (the long arm of chromosome 4). The authors note:
The strongest association with G in the overall sample in the 4q12 region was observed with rs78537672, which was similarly strongly associated in the Mainland and Caribbean subgroups. Within the admixture peak boundaries, rs2855775 showed the strongest association with G in the overall sample. This SNP is common in African ancestry (AF = 0.13) but rare in the other ancestries (AF = 0.01). It is located in an intron of KIT. rs73816436 showed the strongest association with G in the Caribbean subgroup and showed differentiated allele frequencies among continental ancestries, being polymorphic in African ancestry (AF = 0.04) but extremely rare or absent in other ancestries. None of these SNPs were in LD with each other.
In other words, the most likely candidate is close to the gene called KIT. This gene does a lot of stuff, including protecting against cancer. One particular variant, rs2855775, was more common in Africans (13%) than in the other ancestries (1%), and seems to have a positive effect on intelligence.
Importantly, the authors replicated the findings in other datasets and GWASs. This is important because local ancestry analysis consists of testing a large number of genomic regions for association, and even controlling for the multiple-testing, there can still be quirks of the dataset that result in spurious findings:
We attempted replication of associations for the prioritized variants in independent cohorts of Black, White, and Hispanic/Latino participants with cognitive data, and in two large GWAS from the CHARGE consortium (Table S5 in supporting information). Several variants showed evidence of replicated association (P < 0.05; i.e., same cognitive test, same direction of association, and same ancestral background as the original association in HCHS/SOL), including rs78537672 (G), rs78934697 (WFT), and rs9551193 (DSST). Notably, in a PheWAS analysis in the UK Biobank using GWASAtlas, the strongest trait association for rs9551193 was with a cognitive trait (prospective memory test, P = 6 × 10⁻⁴). Additionally, rs78537672 showed consistent associations with other cognitive traits besides G in ARIC Black participants. Several variants showed evidence of association in the same direction but with different cognitive traits or in another ancestral background as the original association in HCHS/SOL, including variants on chr1q25, 10p12.2, 12q14.2, 12q15, and 13q12.11. Finally, a few variants showed association with cognitive traits in at least one replication cohort but in the opposite direction as in HCHS/SOL.
The authors also supplied some admixture plots in their supplementary files:
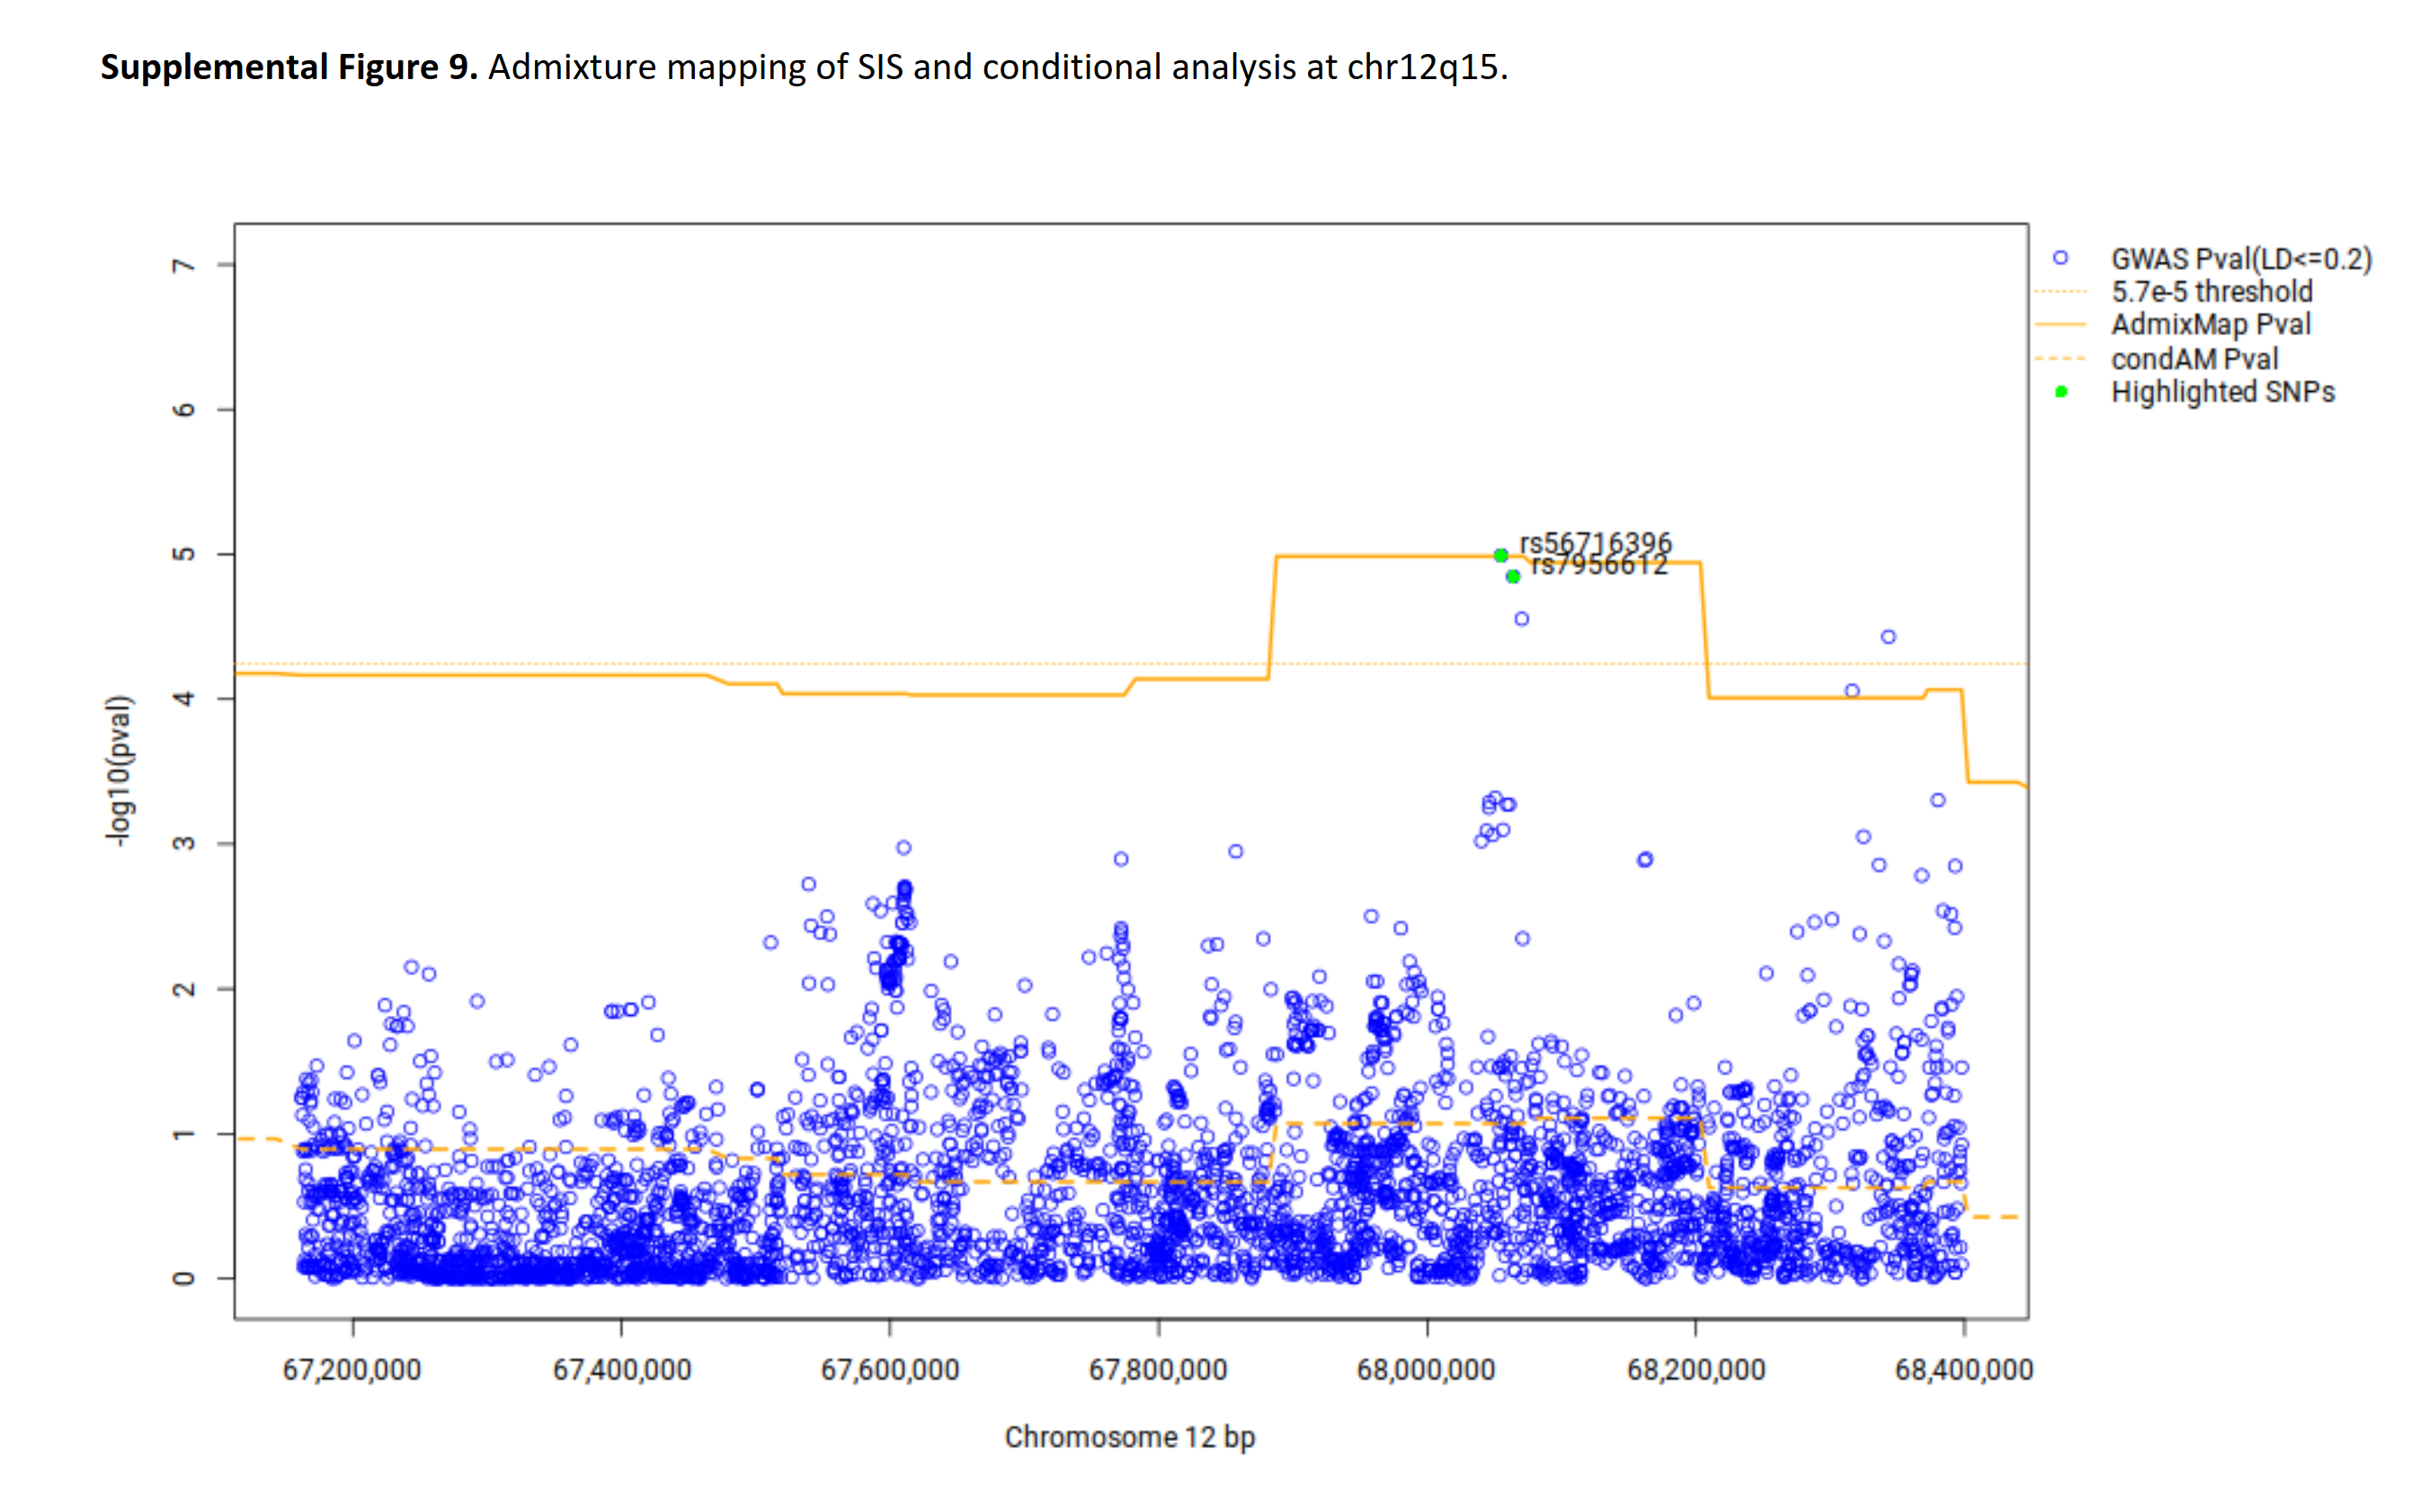
They don’t look very convincing, and it appears the dotted line is misplaced (should be at 5.7 but seems to be at 4.3). I suspect the reason that the ancestry spike isn’t so obvious is that they zoomed too far in so that the individual dots are more clearly distinguishable.
Still, taken together, this is an important first step in finding the specific causal regions that explain why races differ in intelligence. In the future, many more such regions will be found. When many have been found, one could start putting together a model for how it works exactly if one is so inclined. It matters which genes are found. For instance, the main hypothesis that egalitarians have in this area is that discrimination based on skin color causes intelligence differences (“colorism”). If so, then we expect genes that are involved in skin color differences to light up in these analyses. If, on the other hand, the causes of the racial gaps are the same as the causes between individuals within races, then the same genes will be found and they will be related to stuff like neuron formation, oxygen supply, damage repair, myelination, and whatever other biological functions explain why some people are smarter than others.