David Reich’s team has a new kickass preprint out:
- Akbari, A., Barton, A. R., Gazal, S., Li, Z., Kariminejad, M., Perry, A., … & Reich, D. (2024). Pervasive findings of directional selection realize the promise of ancient DNA to elucidate human adaptation. bioRxiv, 2024-09.
We present a method for detecting evidence of natural selection in ancient DNA time-series data that leverages an opportunity not utilized in previous scans: testing for a consistent trend in allele frequency change over time. By applying this to 8433 West Eurasians who lived over the past 14000 years and 6510 contemporary people, we find an order of magnitude more genome-wide significant signals than previous studies: 347 independent loci with >99% probability of selection. Previous work showed that classic hard sweeps driving advantageous mutations to fixation have been rare over the broad span of human evolution, but in the last ten millennia, many hundreds of alleles have been affected by strong directional selection. Discoveries include an increase from ~0% to ~20% in 4000 years for the major risk factor for celiac disease at HLA-DQB1; a rise from ~0% to ~8% in 6000 years of blood type B; and fluctuating selection at the TYK2 tuberculosis risk allele rising from ~2% to ~9% from ~5500 to ~3000 years ago before dropping to ~3%. We identify instances of coordinated selection on alleles affecting the same trait, with the polygenic score today predictive of body fat percentage decreasing by around a standard deviation over ten millennia, consistent with the Thrifty Gene hypothesis that a genetic predisposition to store energy during food scarcity became disadvantageous after farming. We also identify selection for combinations of alleles that are today associated with lighter skin color, lower risk for schizophrenia and bipolar disease, slower health decline, and increased measures related to cognitive performance (scores on intelligence tests, household income, and years of schooling). These traits are measured in modern industrialized societies, so what phenotypes were adaptive in the past is unclear. We estimate selection coefficients at 9.9 million variants, enabling study of how Darwinian forces couple to allelic effects and shape the genetic architecture of complex traits.
David Reich’s group deserves much credit for pushing the open science promise in ancient genomics. They spend considerable effort collecting genomes from many studies, aggregating the data into a consistent format, and making it publicly available. Here I mean really publicly available, as in literally anyone can download it without signing up or agreeing to censorship terms, having an approved academic email, or being a ‘bona fide’ researcher (which also means the former, of course). So if you are a hobbyist or work in a different field, you can download the data too and look at some traits the authors didn’t look at, or try another method.
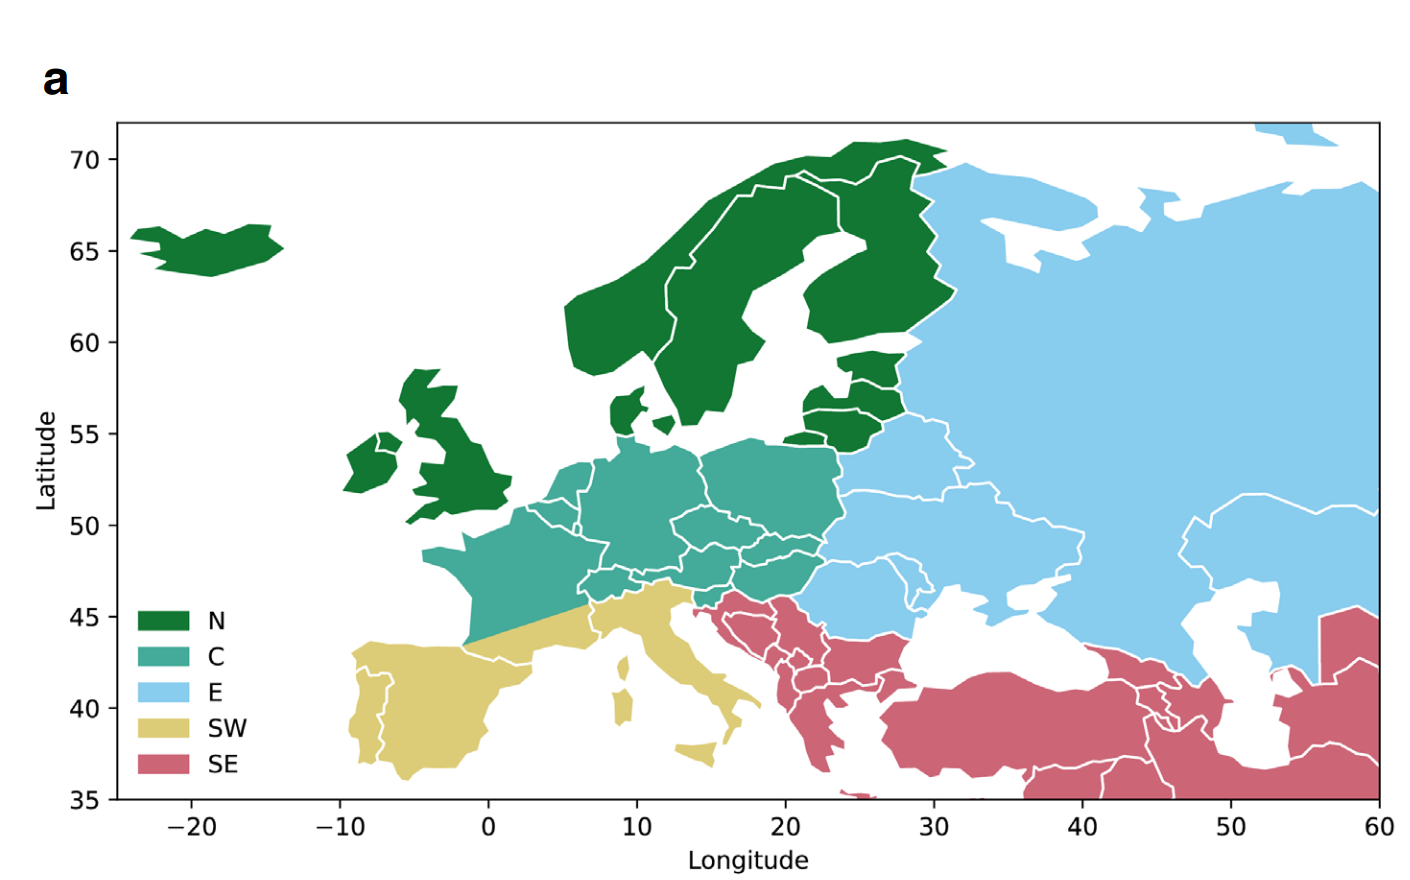
In their new paper, they had a close look at recent evolution in their largest subset that of “West Eurasians”, which basically means the people who historically lived in this area:
Given the large scale of the data — 8,433 genomes spread across 14,000 years — one can employ powerful methods to find alleles (variants of some gene, usually a single letter difference) that have changed faster than would be expected by the various migrations and population turnovers, as well as random chance (genetic drift). After finding 100s of such alleles, they checked what they seem to code for to see what evolution was ‘thinking’. The simplest approach is looking at single alleles of some importance that show large changes:
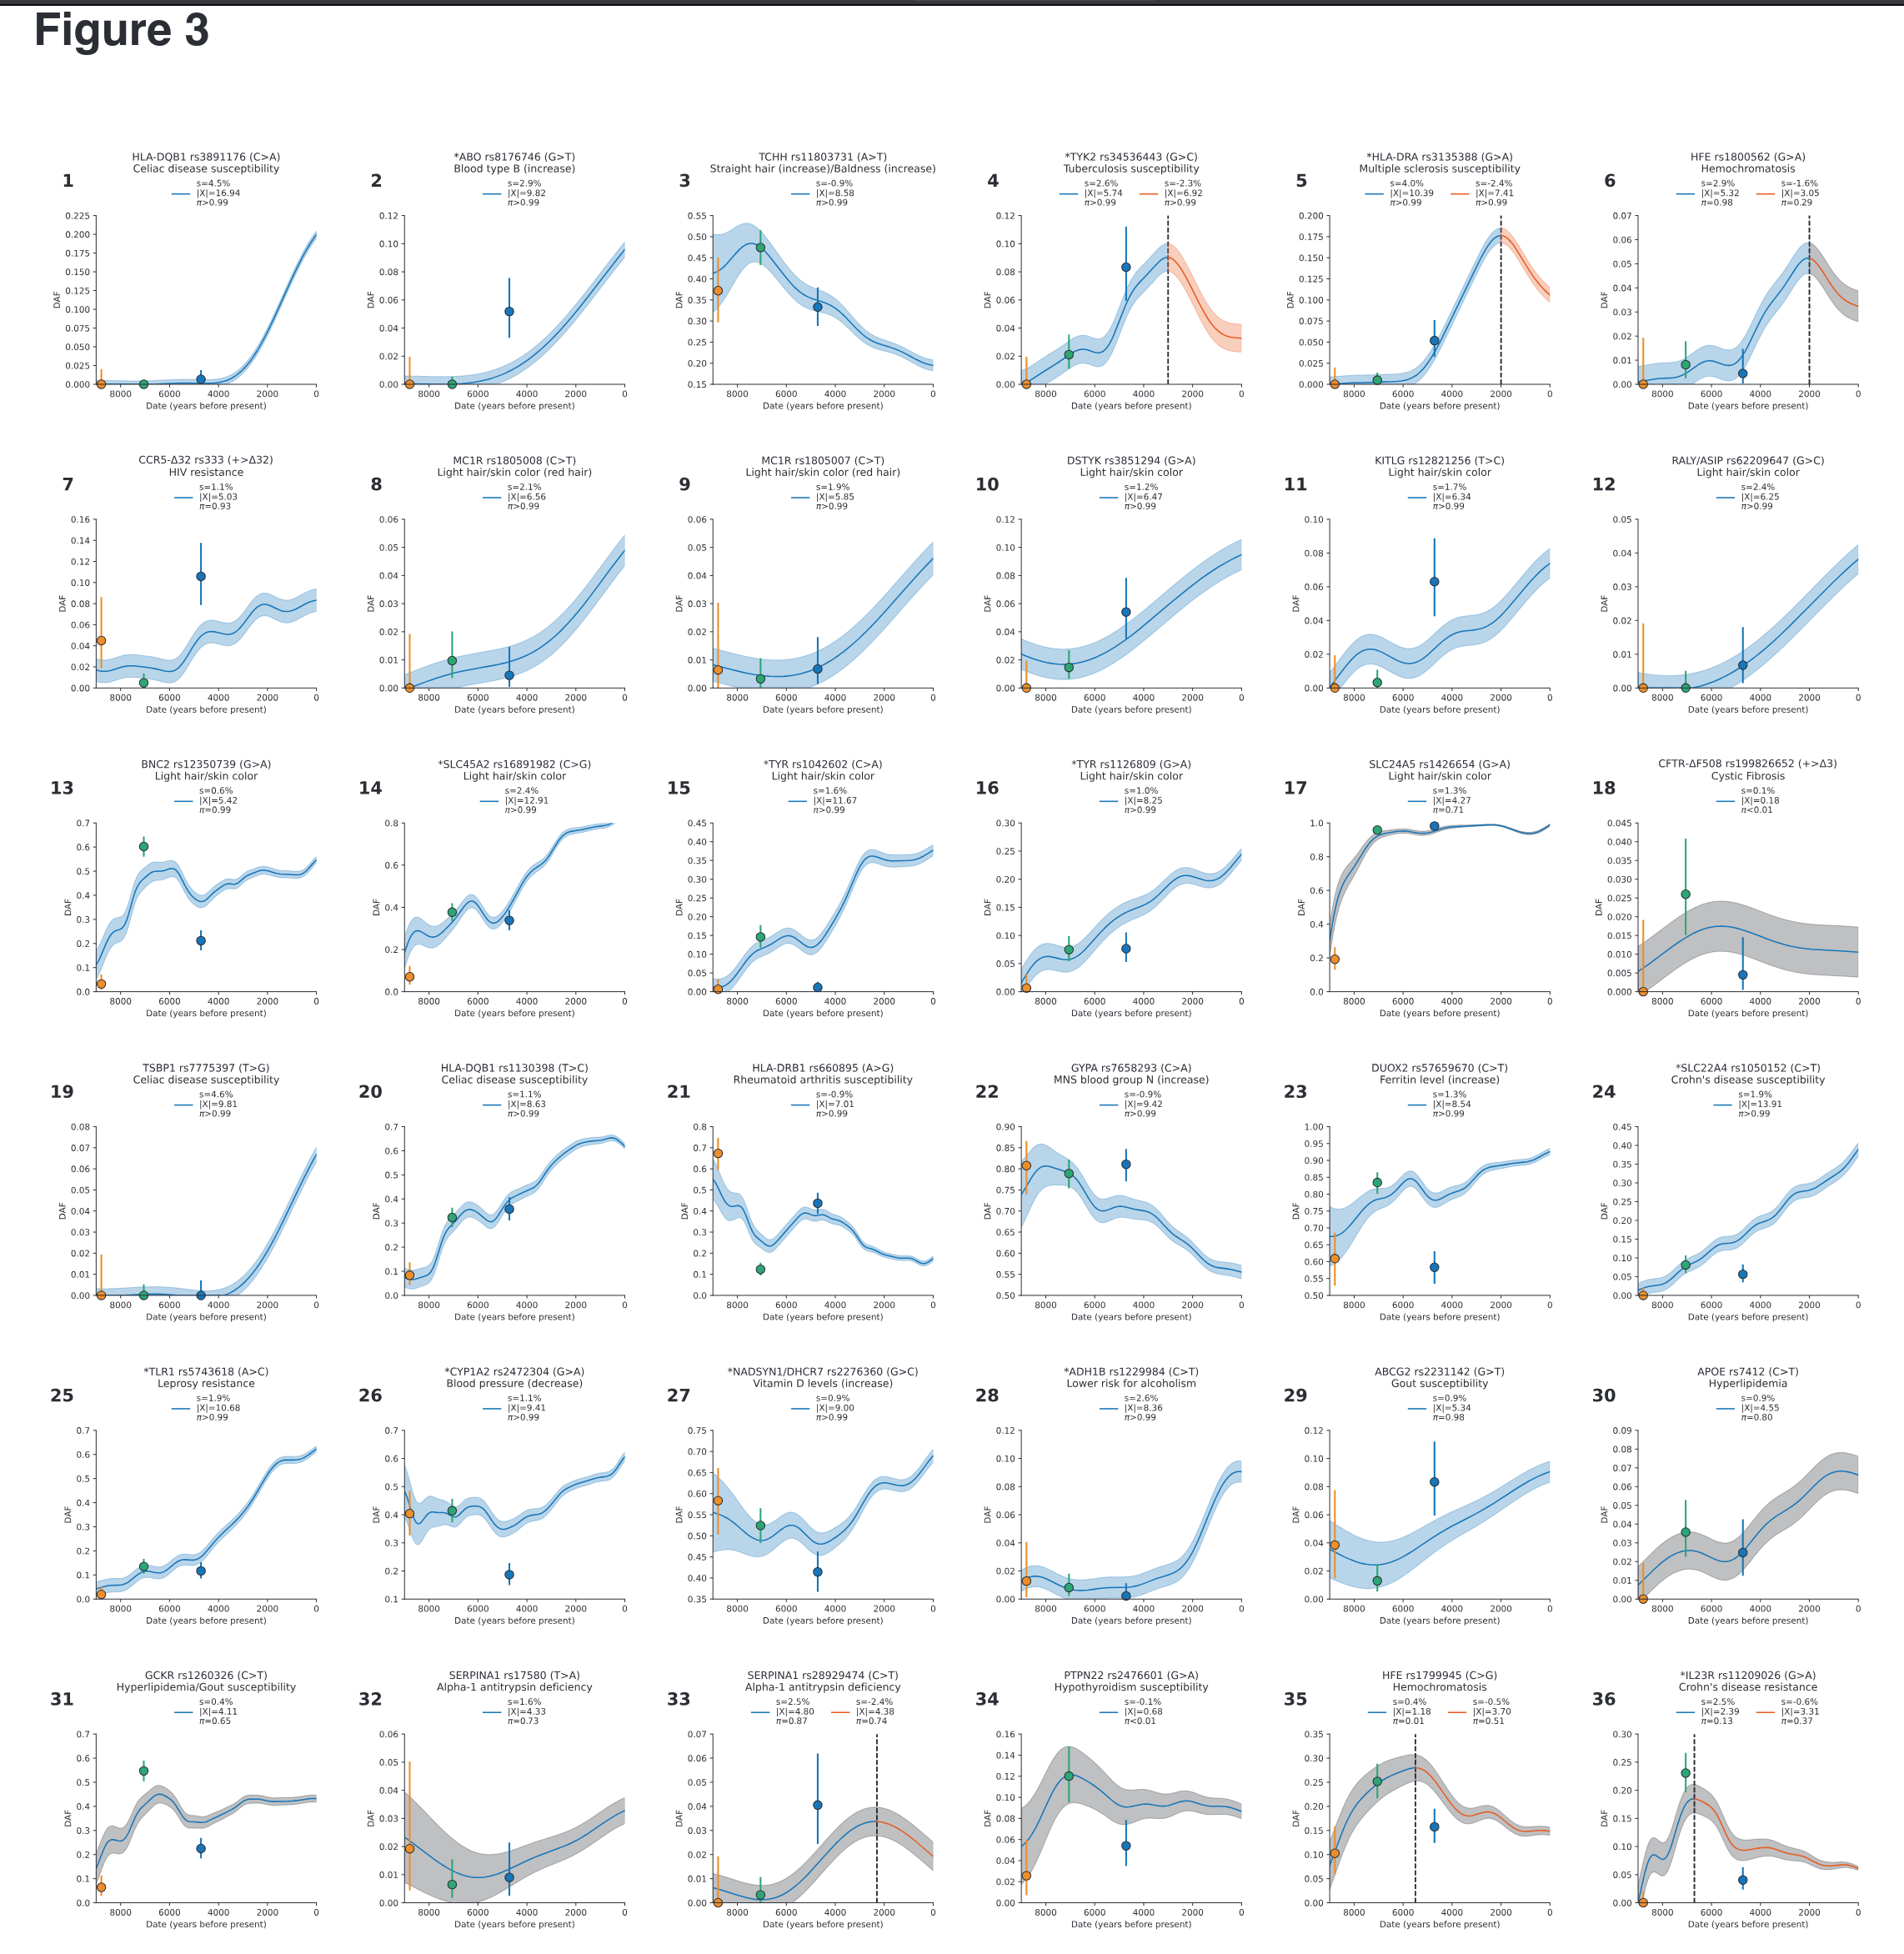
They provide some helpful interpretations, for instance:
TCHH: Selection for an allele that reduced male pattern baldness (panel 3). An allele at missense SNP rs11803731 (A>T) in TCHH is a strong predictor of straight hair and male pattern baldness in Europeans. The derived allele T is rare in African and East Asian populations, and has been hypothesized to have been positively selected, analogous to the straight-hair EDAR allele in East Asians35. We observe an opposite trend: the derived allele was negatively selected (s = -0.9%, p>99%), decreasing from ~50% to ~20% in the past 7000 years. This implies a 1.8% decrease in predisposition to baldness over this period.
Selection for light skin at 10 loci (panels 8-17). We find nine loci with genome-wide signals of selection for light skin, one probable signal, and no loci showing selection for dark skin.
There was seemingly a lot of selection for visible phenotypes, at least, unless these alleles also have some other effects that were even more important.
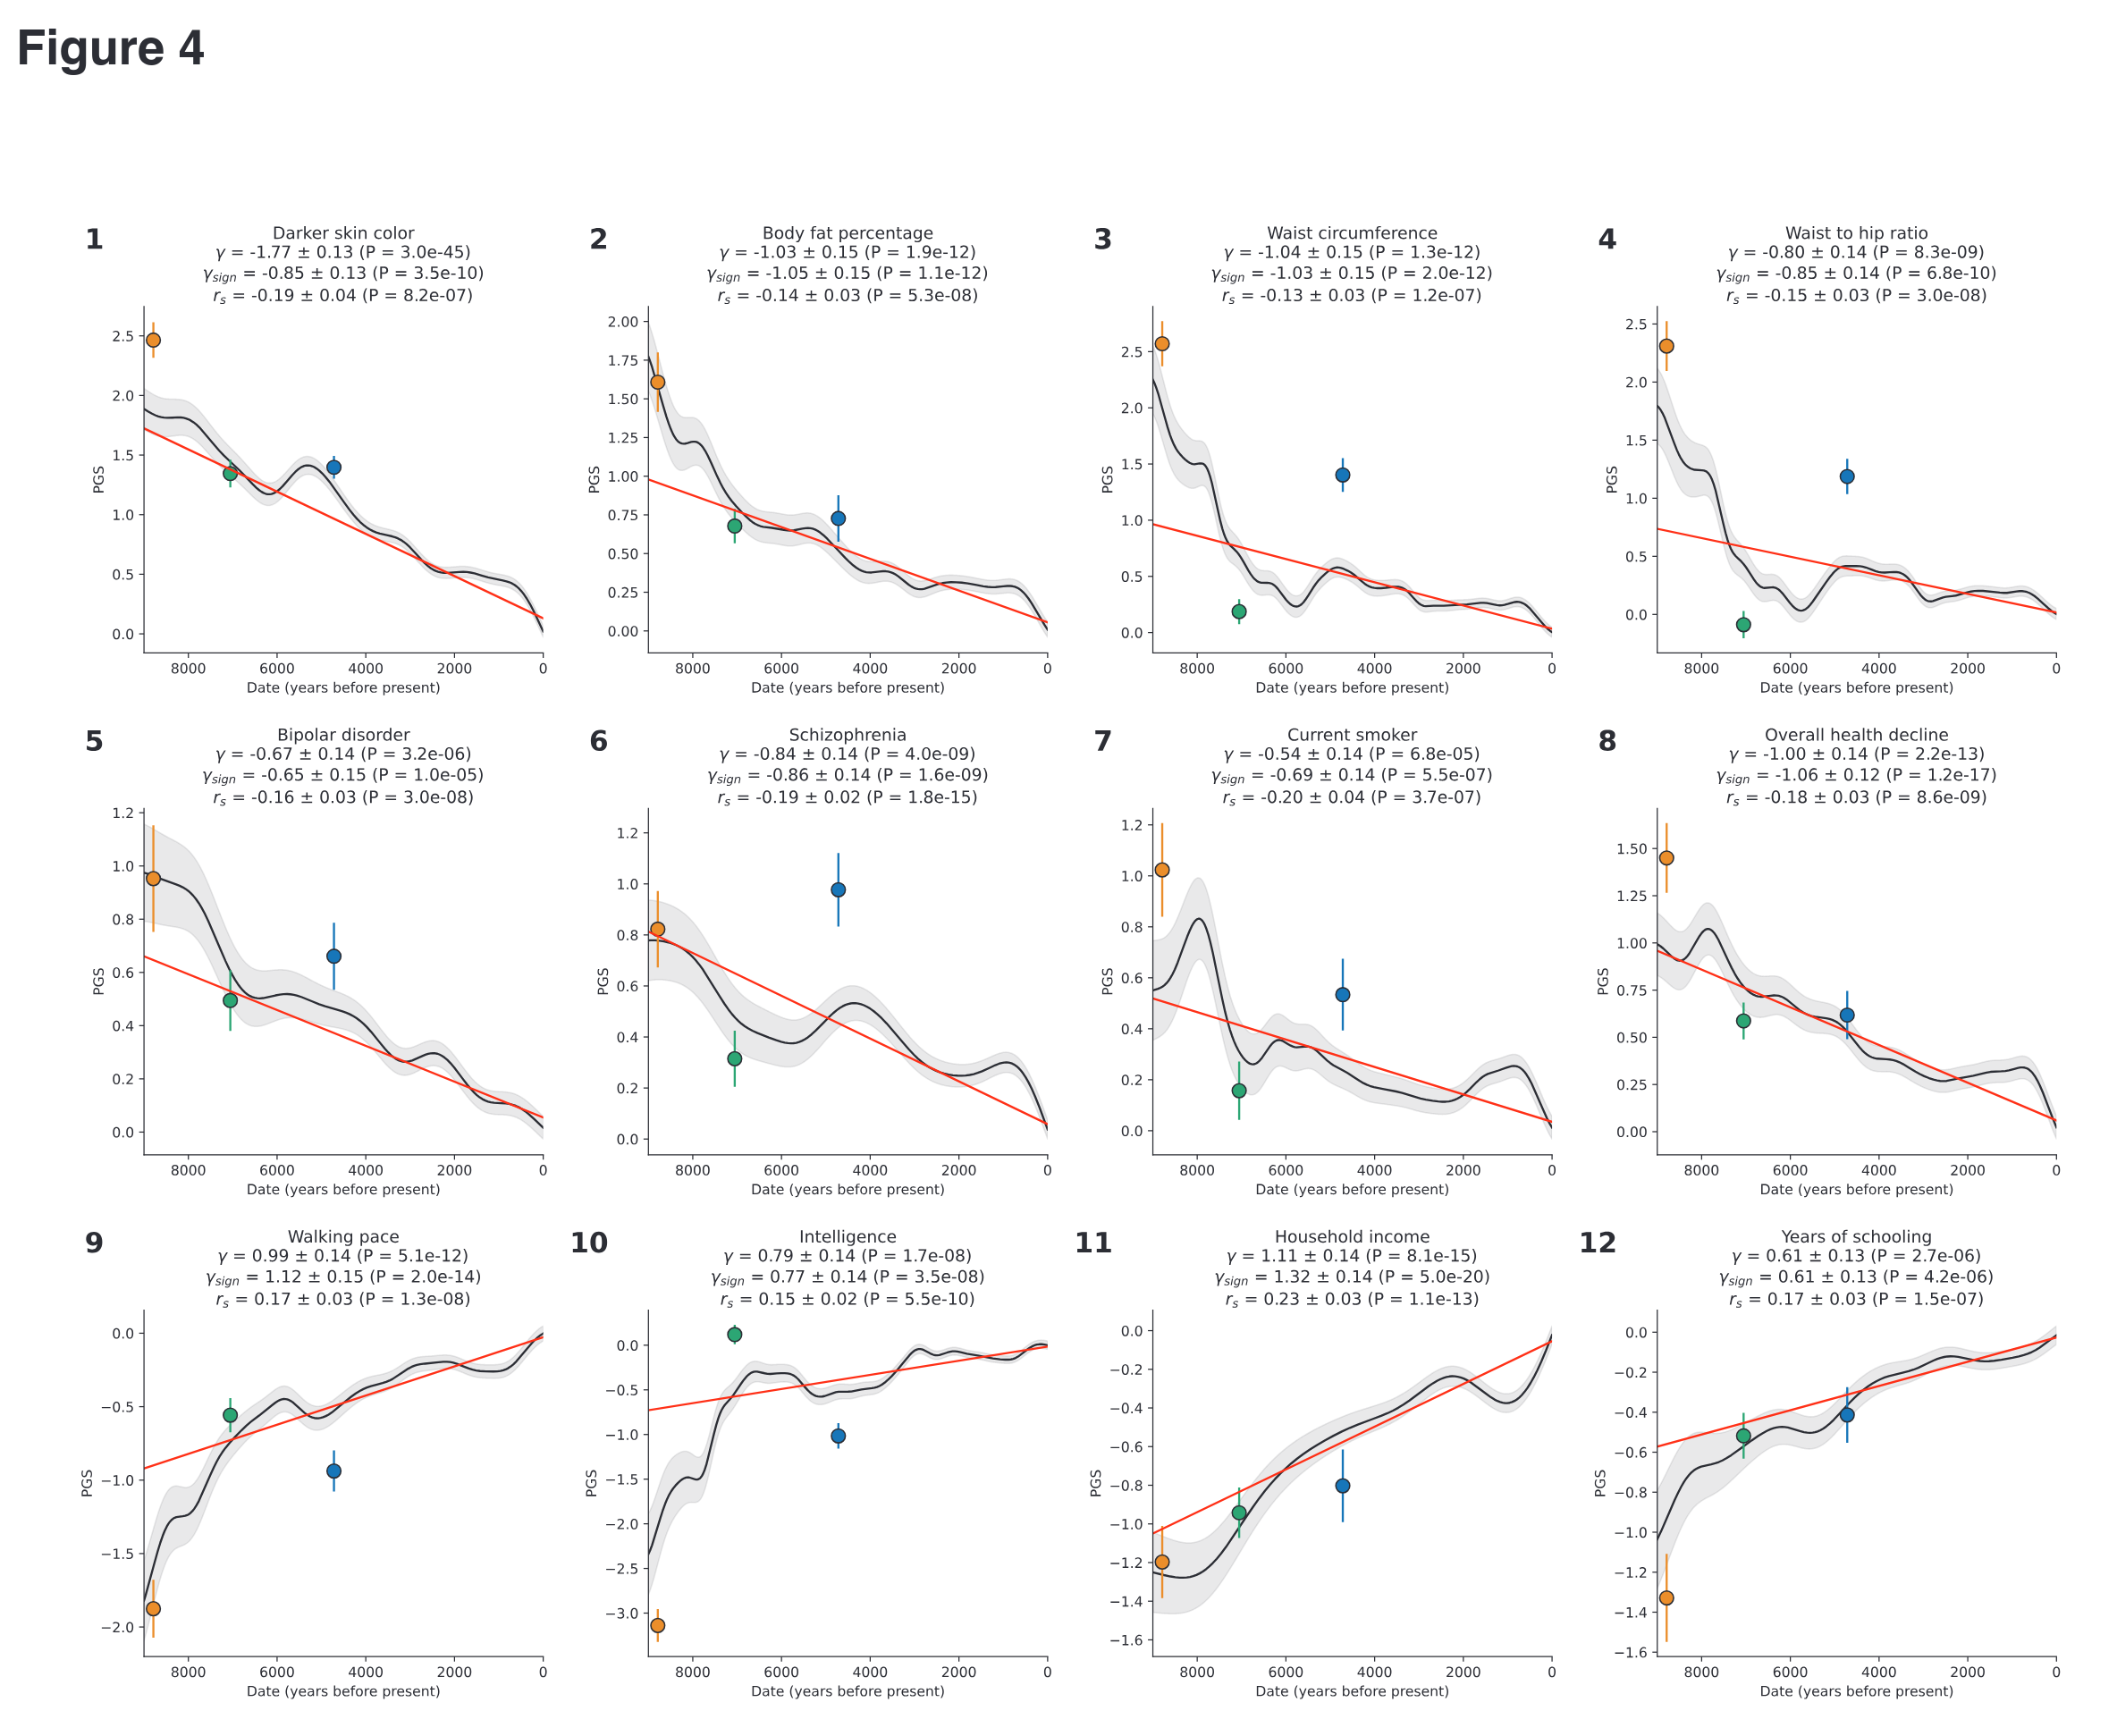
More importantly, in the next step, they aggregated the signal for many variants into a polygenic score and see how it changed over time. They don’t pull any punches about the phenotypes being examined:
To note about the colors:
Circles represent frequencies in Western Hunter-Gatherers (orange), Early European Farmers (green), and Steppe Pastoralists (blue).
West Eurasians are an admixture of 3 older populations, and so it is very informative to examine the polygenic scores of each of these by themselves, as well as the ongoing natural selection (including sexual) over time. For instance, it appears that the farmers from Anatolia (green) were markedly less schizophrenic-prone than the hunter-gatherers and the Indo-Europeans (blue, the Aryans, Yamnaya). Despite the Indo-Europeans coming in with elevated schizophrenia polygenic scores, schizophrenia was under continuous selection to be bred out.
Most interesting is that the hunter-gatherers appear to be much duller than the farmers, and even the Indo-Europeans aren’t all that impressive, despite having great success in displacing the locals (northern European populations are about 50% descended from them). However, if we look at the social status polygenic scores, we see that the Indo-Europeans do quite well. One interpretation here could be that Indo-Europeans had good non-cognitive traits, though not particularly high intelligence. The inference is based on the idea that social status, and polygenic scores for this, of this reflects a mixture of intelligence and non-cognitive traits (e.g. being reliable, prosocial etc.). Thus, if one removes the intelligence part, the left-over part reflects these social status causing unmeasured non-cognitive traits. This method was previously used directly by way of a GWAS subtraction. Scott Alexander gave a positive spin on these in a post from 2021:
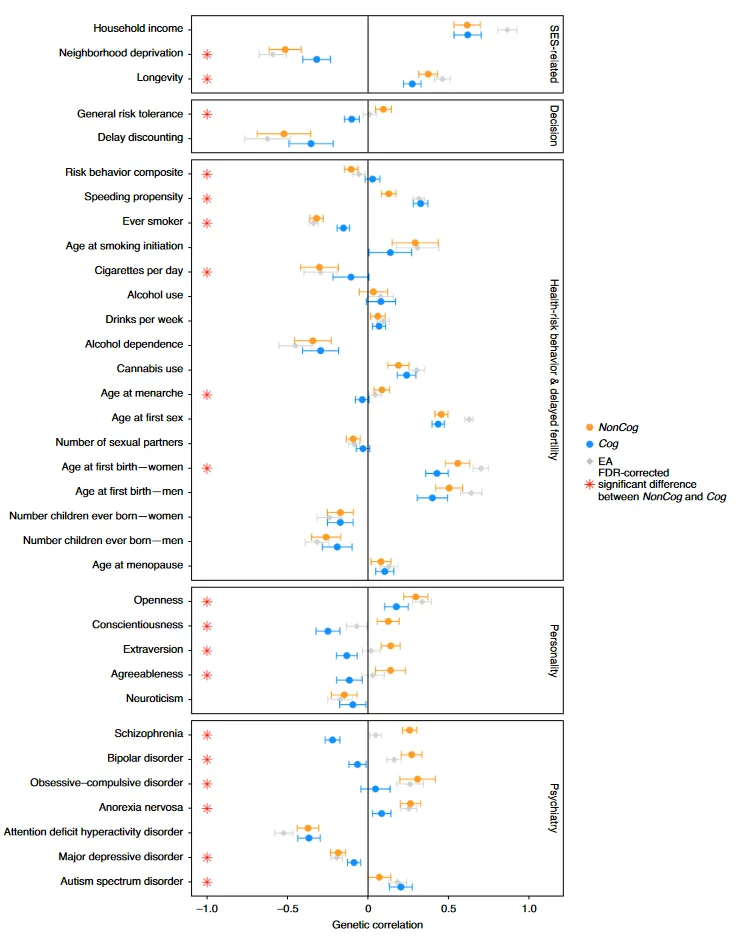
So for instance, we see that if one takes the EA3 (educational attainment GWAS 3) polygenic scores, subtracts the IQ GWAS scores, one ends up with scores that predict the general factor of personality directions (higher openness, conscientiousness, extroversion, agreeableness, emotional stability). These are the same ones we know from other research to be somewhat associated with ‘winning in life’. However, the left-over scores also predicted various kinds of mental illness. Scott Alexander interpreted this as there being some hidden benefit to these. I am more inclined to think that mentally ill people self-selected into longer university educations to some extent. The jury is still out on this interpretation, however. Anyway, my point is that using the same reasoning, we can hypothesize that Indo-Europeans had some compensating non-cognitive traits that were key to them winning the demographic war over the farmer-hunter-gatherer team (as they had mixed previously, with mostly farmers winning).
Inferences about the direction of evolution and related group differences can be questioned on the basis of potential bias in the training of the GWAS. These GWASs are exclusively trained on modern Europeans (British, mostly English), so maybe some sneaky bias entered the picture somehow e.g. ascertainment bias, or uncorrected population stratification. Population stratification bias means that the model will pick up on some ancestry signal which predicts an outcome, not for genetic reasons, but rather because it works as a proxy for some unmeasured environmental cause. The typical example is the use of chop sticks. If one did a GWAS on the use of chop sticks, the model would find genetic variants that are common in Asian people, even though these don’t actually cause using chop sticks in some direct causal sense, but because they are proxies for being raised in an Asian culture using these (as far as I know, there is no empirical demonstration of this though).
One way to deal with the potential population stratification bias is to use results from more stringent GWASs. For instance, one can use those based on sibling pairs (within family GWAS). Since sibling pairs have almost the same ancestry (but not entirely), this design controls for most of the possible unmeasured stratification correlated environmental confounding if such exists. Here’s their sibling GWAS results:
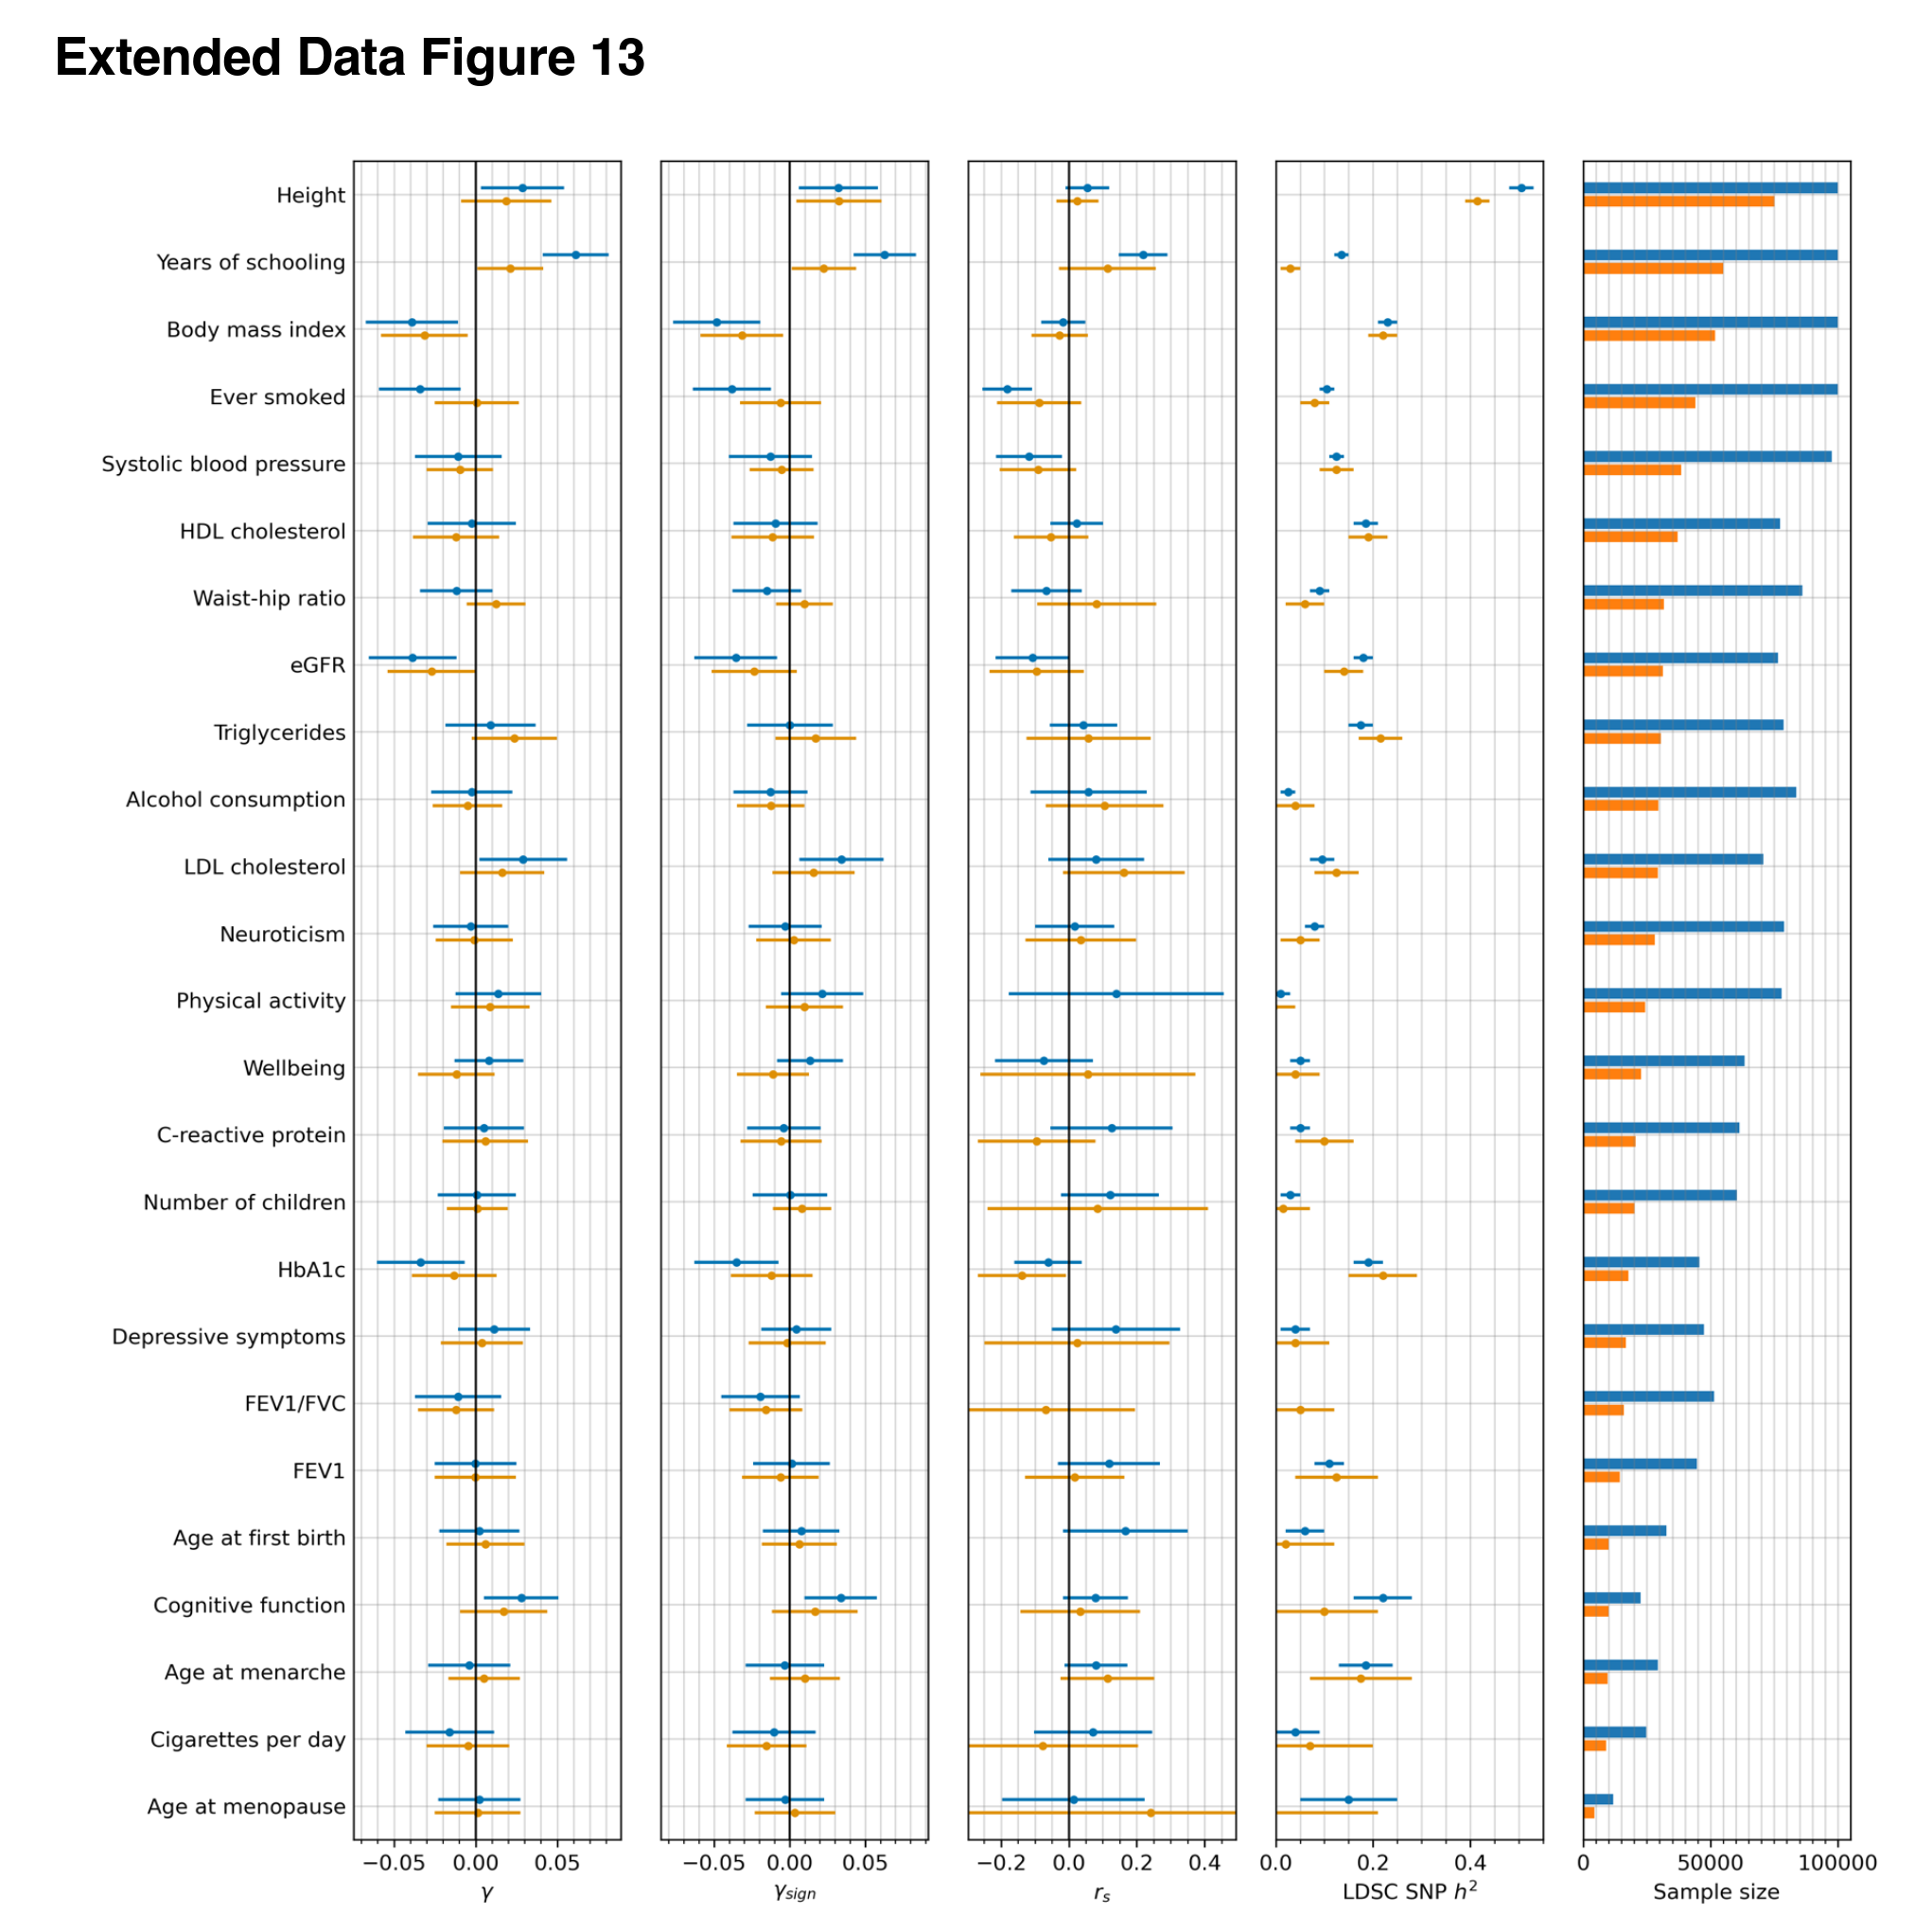
The figure is a little complicated to understand, here’s the caption:
Extended Data Figure 13: Consistency of polygenic selection signals using effect sizes estimated from both GWAS of unrelated people, and sibling-based GWAS [66]. The first three columns show estimates for each of the three polygenic tests of selection. The fourth column replicates Figure 5 from [66], and shows the estimated SNP heritability h2 by LDSC. The fifth column shows the sample sizes for both GWAS of unrelated people (blue) and sibling-based GWAS (orange). Error bars indicate the 95% confidence interval, which is often larger for the sibling-based GWAS due to limited sample size.
Specifically, the three first columns mean:
We used three statistics to test for coordinated selection on alleles affecting the same trait. First, we computed a polygenic score (PGS) for each GWAS: a linear combination of allelic values, weighted by estimated effect size. We evaluated whether the change in PGS over time, 𝛾, (which we scaled so one-unit corresponds to a one standard deviation change over ten millennia) is more than could be expected by genetic drift alone. To test if the observed deviation is significant, we repeated the test 100 times with randomly flipped signs of GWAS effect sizes, to correct for LD among neighboring sites. As a second test, we repeated the procedure without using the magnitudes of the GWAS effects, and instead only the sign, generating a statistic 𝛾sign that may be less affected by concerns about transferability of PGS across groups [12,56–58]. Third, we performed a SNP-by-SNP comparison for each trait, using cross-trait LD Score Regression (LDSC) to estimate genetic correlation (rs) between selection summary statistics and GWAS summary statistics59, accounting for non-independence of SNPs. We computed a standard error from a Block Jackknife to test if this correlation is significantly different from zero. We find high Pearson’s correlation for all three tests (75-316, 91%; Extended Data Figure 7).
So the basic estimate is y, which is the change in standard deviations of the polygenic score. y-sign is the same, but with a maybe more robust version of the scores, and rs is the selection speed.
For those of us interested in the evolution of intelligence, we look for the rows with cognitive function and years of schooling. Note that since the sibling GWAS is quite small, it has little signal (see the detected heritability column). Naturally, when the scores are poor predictors, it is hard to find selection with them. Nevertheless, we see that of the 3+3 tests for selection for education/intelligence, all 6 are positive, and 2/3 of the years of schooling sibling GWAS tests have p < .05 (if only marginally). Insofar as the sibling results are concerned, then, it appears we can still see the selection signal despite lower power because the scores are so bad. To note, there is also some evidence of height selection, but it is less convincing, perhaps because the selection was weaker than for intelligence/education-related traits.
Another way to deal with population stratification bias is to use GWASs trained on an unrelated (that is, distant) population. Like previously, the data seems to come from the Japanese biobank. Here’s the results in comparison:
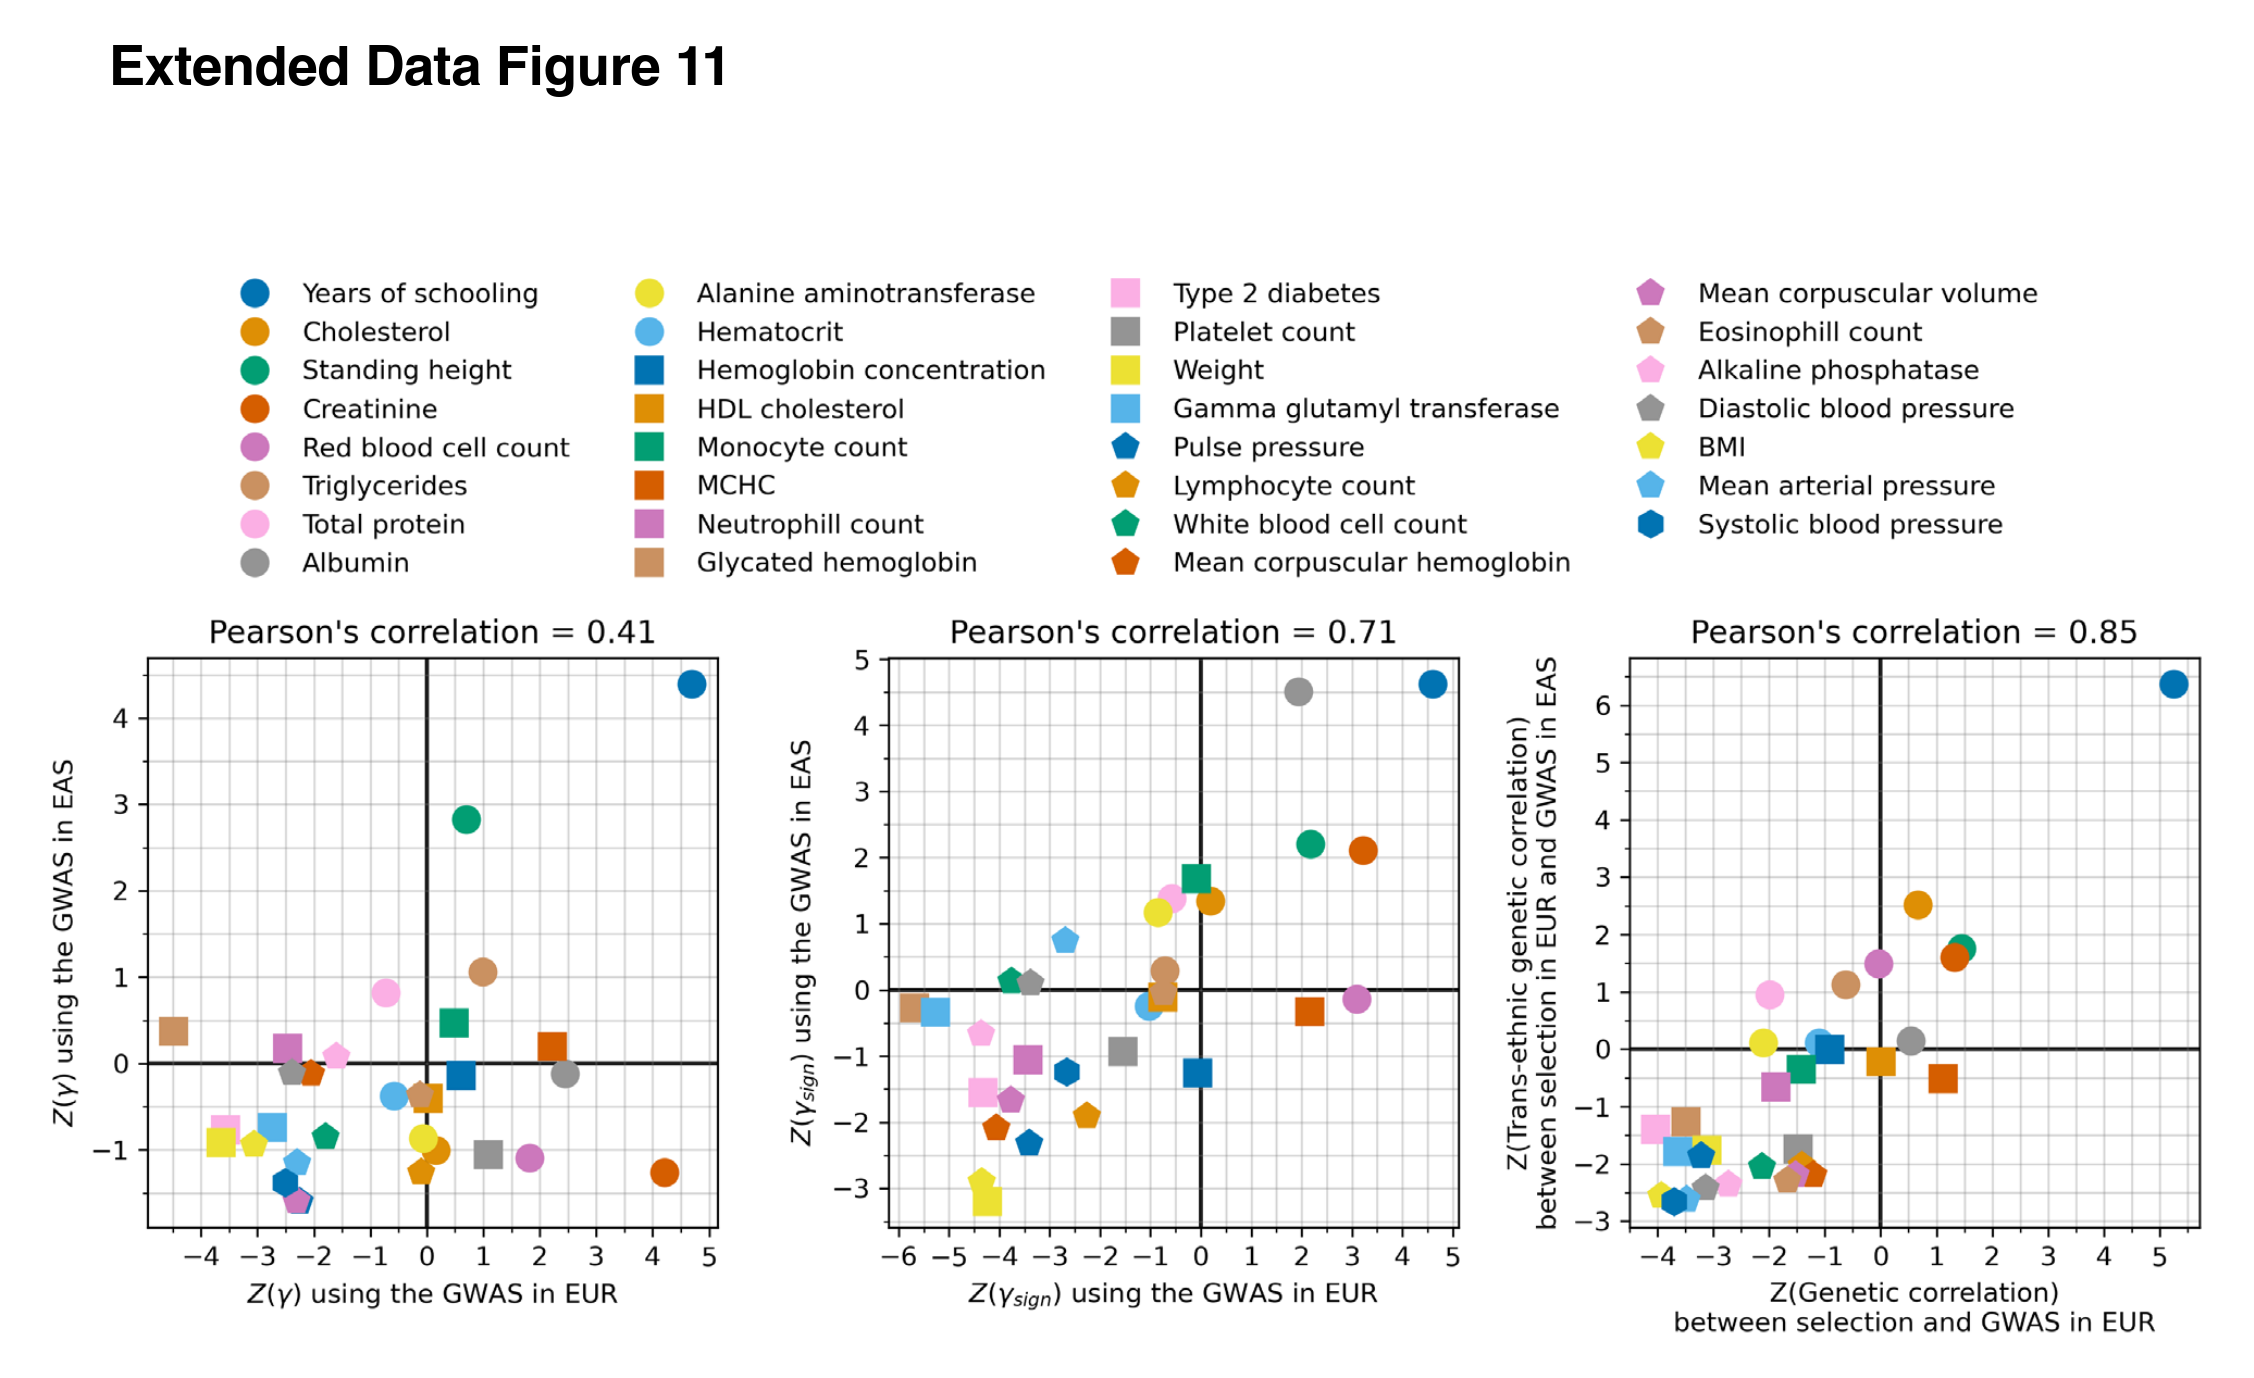
The blue dot in the top corner, the phenotype with the strongest evidence of positive selection, is years of education (EA), and this is true across all 3 methods. The agreement between datasets isn’t perfect (r’s 0.41, 0.71, 0.85), of course, since the East Asian GWASs are much smaller than the European ones, so we expect a lot random error, plus the effects of correcting for whatever population stratification affected the results based on European GWASs. The consistency of the results are, however, “very difficult to explain as an artifact of population structure.” as the authors put it. That is, it is difficult to see how these results don’t show that natural selection for higher intelligence/education happened for West Eurasians for these phenotypes in the last 14,000 years.
Taken all together, the results seem to vindicate the hypotheses in the 2009 book, The 10,000 Year Explosion by Henry Harpending and Greg Cochran:
An alternative explanation for this paradox [lack of evidence of alleles going to fixation] is to hypothesize that West Eurasians have been experiencing qualitatively more and different natural selection in the Holocene than in earlier periods because of rapidly changing lifestyles and economies. Without a comparable time transect before the advent of food production and societies with high population densities, it is impossible to test this directly. However, this hypothesis is consistent with our evidence of particular intense selection for blood-immune-inflammatory traits, and our evidence that selection for these traits becoming even stronger in the Bronze Age than it was in earlier periods.
On this note, I will say that the authors do not appear to be keen on citing prior research on these topics. Though their new paper has 220 citations and runs 53 pages (plus a 124 page supplement), the Harpending and Cochran book is not cited, the study from March this year using a partially overlapping dataset (2625 genomes) and methods by Davide Piffer and myself is not cited, the Yunus Kuijpers and colleages study (also partially overlapping dataset) from 2022 is not cited, and the pioneering first study from 2017 by Michael Woodley and colleagues is not cited. Since this is preprint, some oversights can perhaps be forgiven, but one does wonder about whether this is a deliberate move to avoid stirring the pot while at the same time moving the Overton Window in line with David Reich’s famous 2018 New York Times article.