A friend sent me this study yesterday, so let’s cover it here:
- Taddess, B., Zhang, L., & Trejo, S. (2025). Leveraging Genomic Data to Document Within-Race Attractiveness Penalties Among Black Americans. OSFpreprints
In recent years, scholars of racial inequality have increasingly sought to move beyond simply quantifying discrete racial disparities and instead measure social stratification as a function of continuous racialized characteristics which vary both within and between racial groups. In this paper, we draw on a sample of genotyped respondents from the Add Health study and construct genetic similarity proportions, individual-level measures that correlate with racialized physical features that vary across the expansive family tree of humanity (skin tone, facial structure, hair texture, etc.). We then investigate the relationship between these proportions and interviewer-rated physical attractiveness among self-identified Black Americans (N=2,087). Our findings highlight the existence of substantial attractiveness penalties related to having higher levels of Sub-Saharan African (as opposed to European) genetic similarity.
Yes, you are reading it right. It is a woke-phrased admixture study for attractiveness among Americans in the Add Health study. They rely on interviewer ratings of attractiveness (these data are public):
We begin by examining racial disparities in interviewer-rated attractiveness using the Add Health data. In Waves I, II, III, and IV of the Add Health study, in-home interviewers were asked to rate the physical attractiveness of each respondent using a Likert scale measure with five categories: ‘very unattractive’, ‘unattractive’, ‘about average’, ‘attractive’, ‘very attractive’.Figure 1 contains four bar charts, each of which displays the average attractiveness ratings off our self-identified racial groups: White Americans, Black Americans, Asian/Pacific Islander Americans, and Hispanic Americans. Panels A and B display each race’s average attractiveness score, whereas Panels C and D display the fraction of respondents of a given race rated in the highest attractiveness category. While Panels A and C display unadjusted values, Panels C and D display values which are residualized on interviewer fixed effects. Although White Americans tend to have the highest attractiveness ratings, we observe only small average differences across racial groups – in line with previous work using interviewer-reported survey measures (28). For instance, the unadjusted difference in the attractiveness score of White and Black Americans is just 0.095 standard deviations (SD). These modest results stand in stark contrast to the substantial attractiveness disparities observed in the large-scale revealed preference analyses of dating app data (2);** fortunately, the results from our subsequent GSP analysis offer some insight into this apparent empirical puzzle.
Figure 1 is missing from the preprint (also from version 1) so I can’t show it. And just what exactly is GSP?:
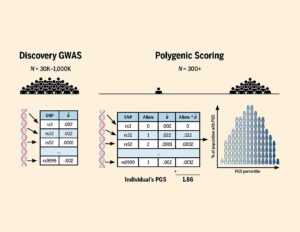
Genetic similarity proportions (GSPs (9)), also known as genetic ancestry proportions, have a wide range of applications in human genomics, including in the study of gene-ancestry interaction effects (10, 11) and in the analysis of historical human admixture events (12). (Genetic admixture refers to genomic mixing of previously isolated populations.)
Right, so it’s the latest newspeak on race/ancestry. There has been a trend in the last few years to keep changing the accepted nomenclature. One recent idea was to force people to stop talking about admixture or ancestry, as this very inappropriately suggest the existence of ‘pure’ races or ancestries. Instead, one should talk about distances to ‘prototypical’ members of some groups. There is some truth to this, of course every population/race is a mix of whatever prior populations it was formed from. Nevertheless, it is possible to estimate an individual’s composition from several fairly distinct ancestry origins, sub-Saharan Africans, Pacific Islanders, Europeans, and so on. This is what admixture analysis attempts to do, and it’s the same thing that 23andme and other consumer genomics companies give their customers. I don’t see what the newspeak helps, but clearly it didn’t prevent these authors from doing this study.
Anyway, their main results are shown in the somewhat cryptic figure 2:
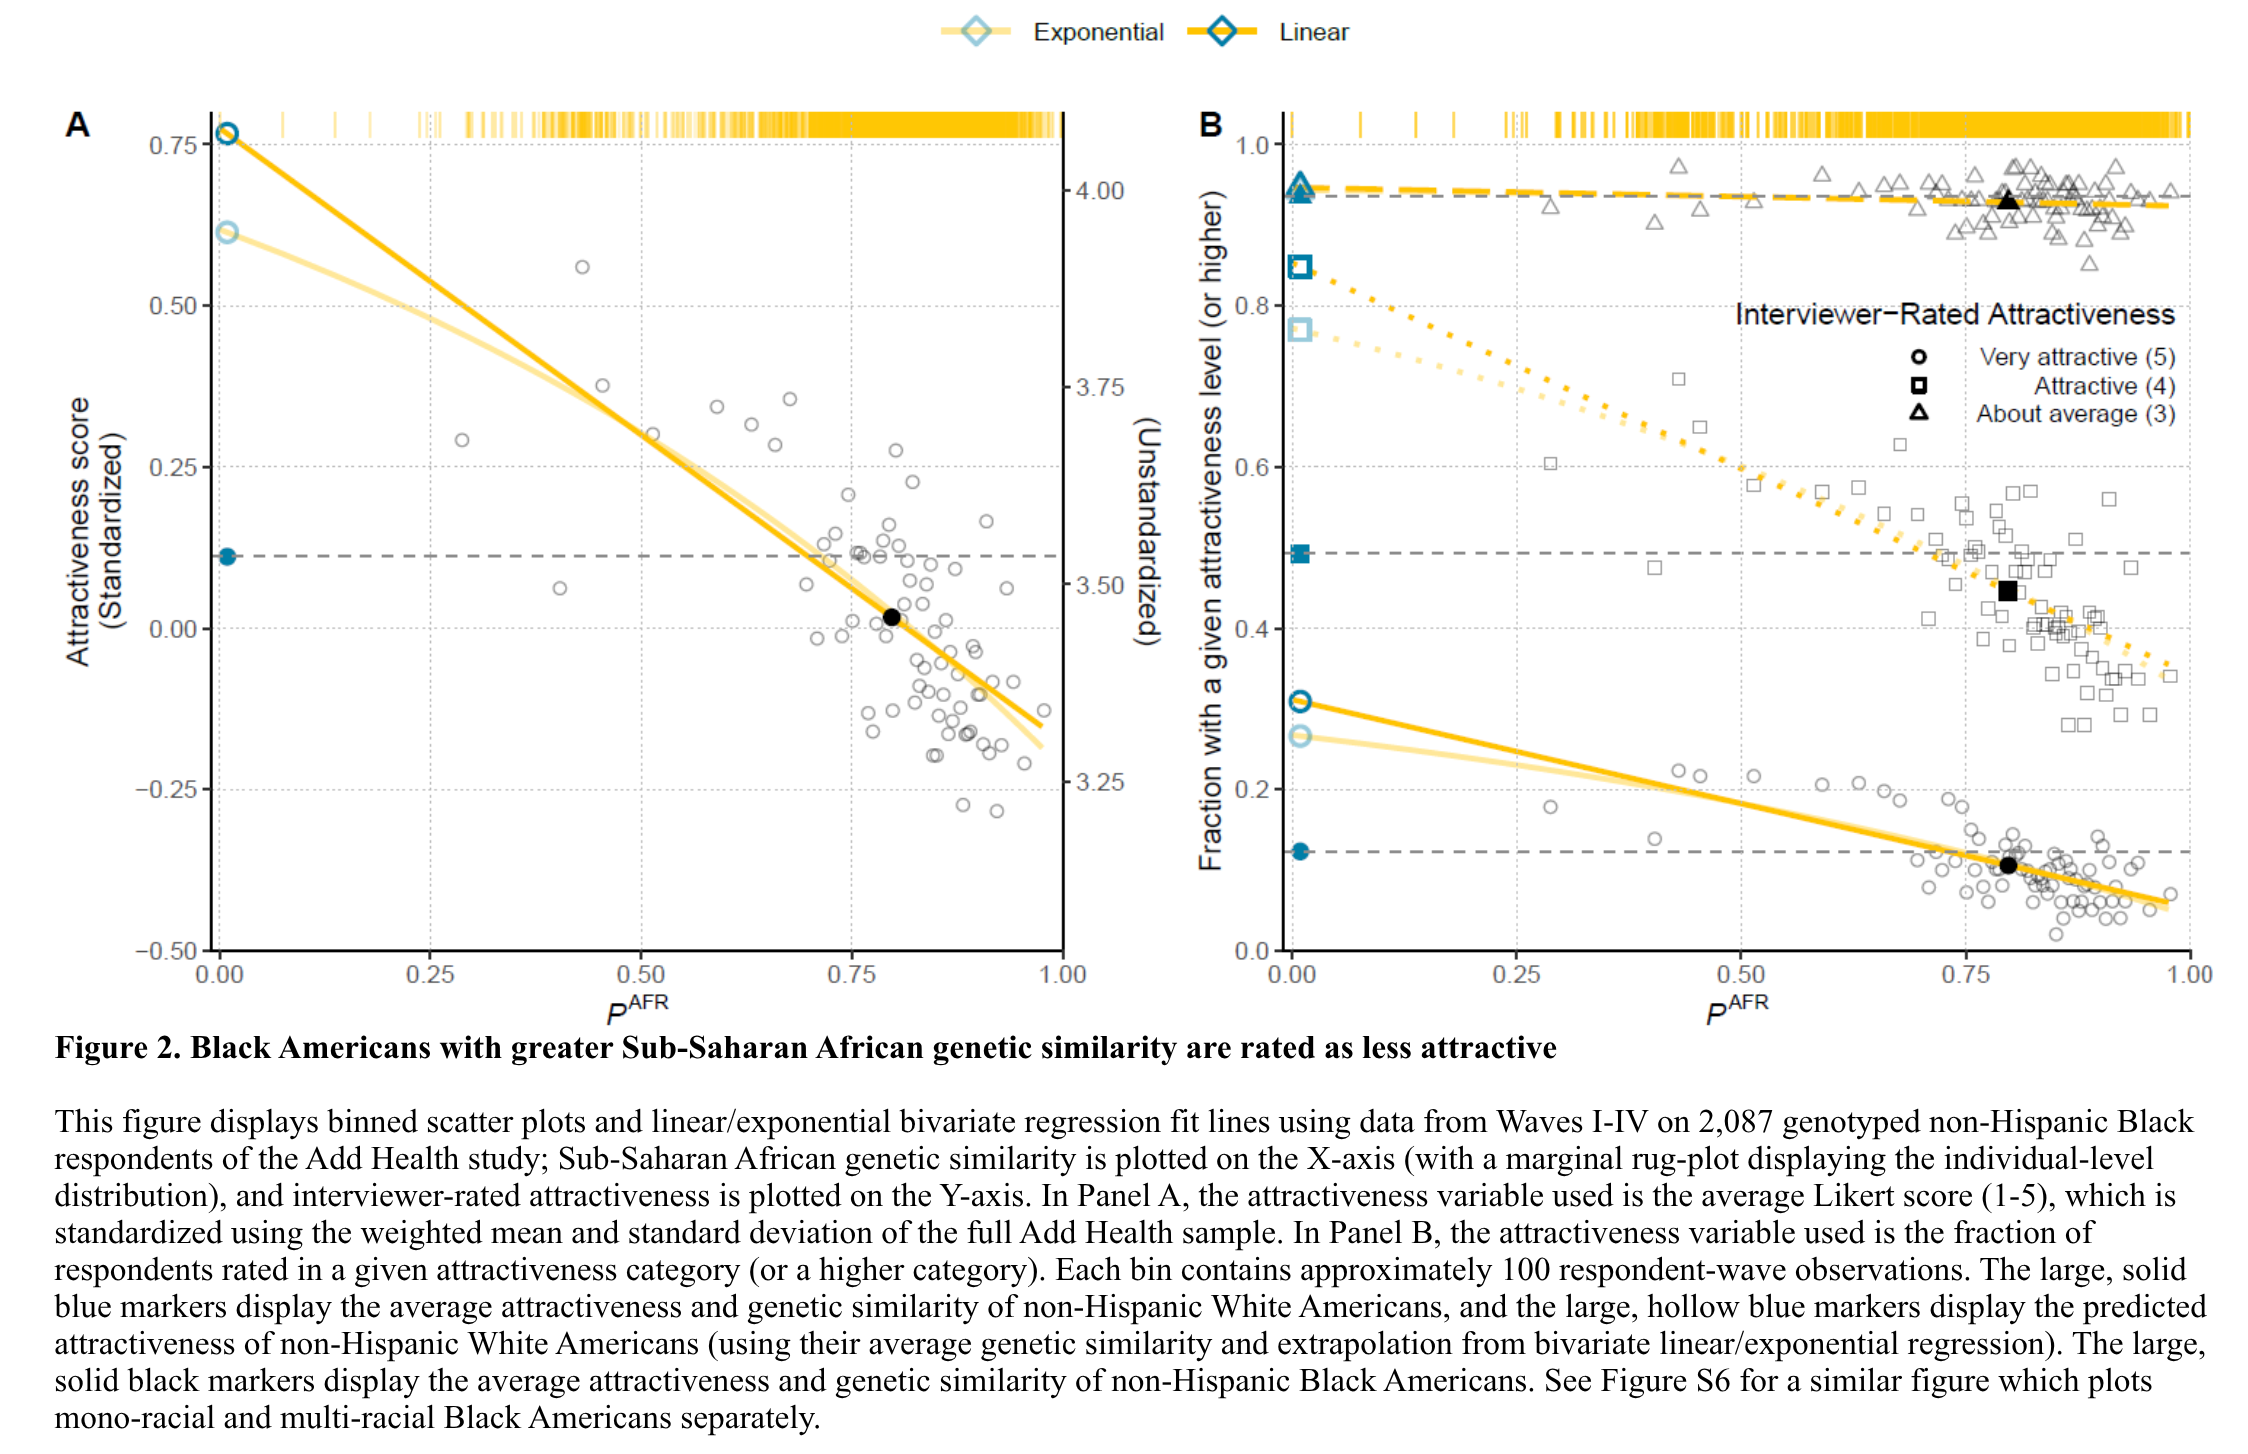
I think the left plot is easier to interpret. Here the ratings of people on the scale explained above were converted to numeric values (standardized) so one can fit quantitative regressions on them. The regression line presumably shows the expected relationship (looks like it is mostly linear). From the slope, we can see that the difference between 0% and 100% African ancestry corresponds to about 1 standard deviation in unattractiveness. The two solid dots show the White and Black means taken as 2 groups, with the Black one only being about 0.10 or so deviations below the White one. The table of models show about the same thing:
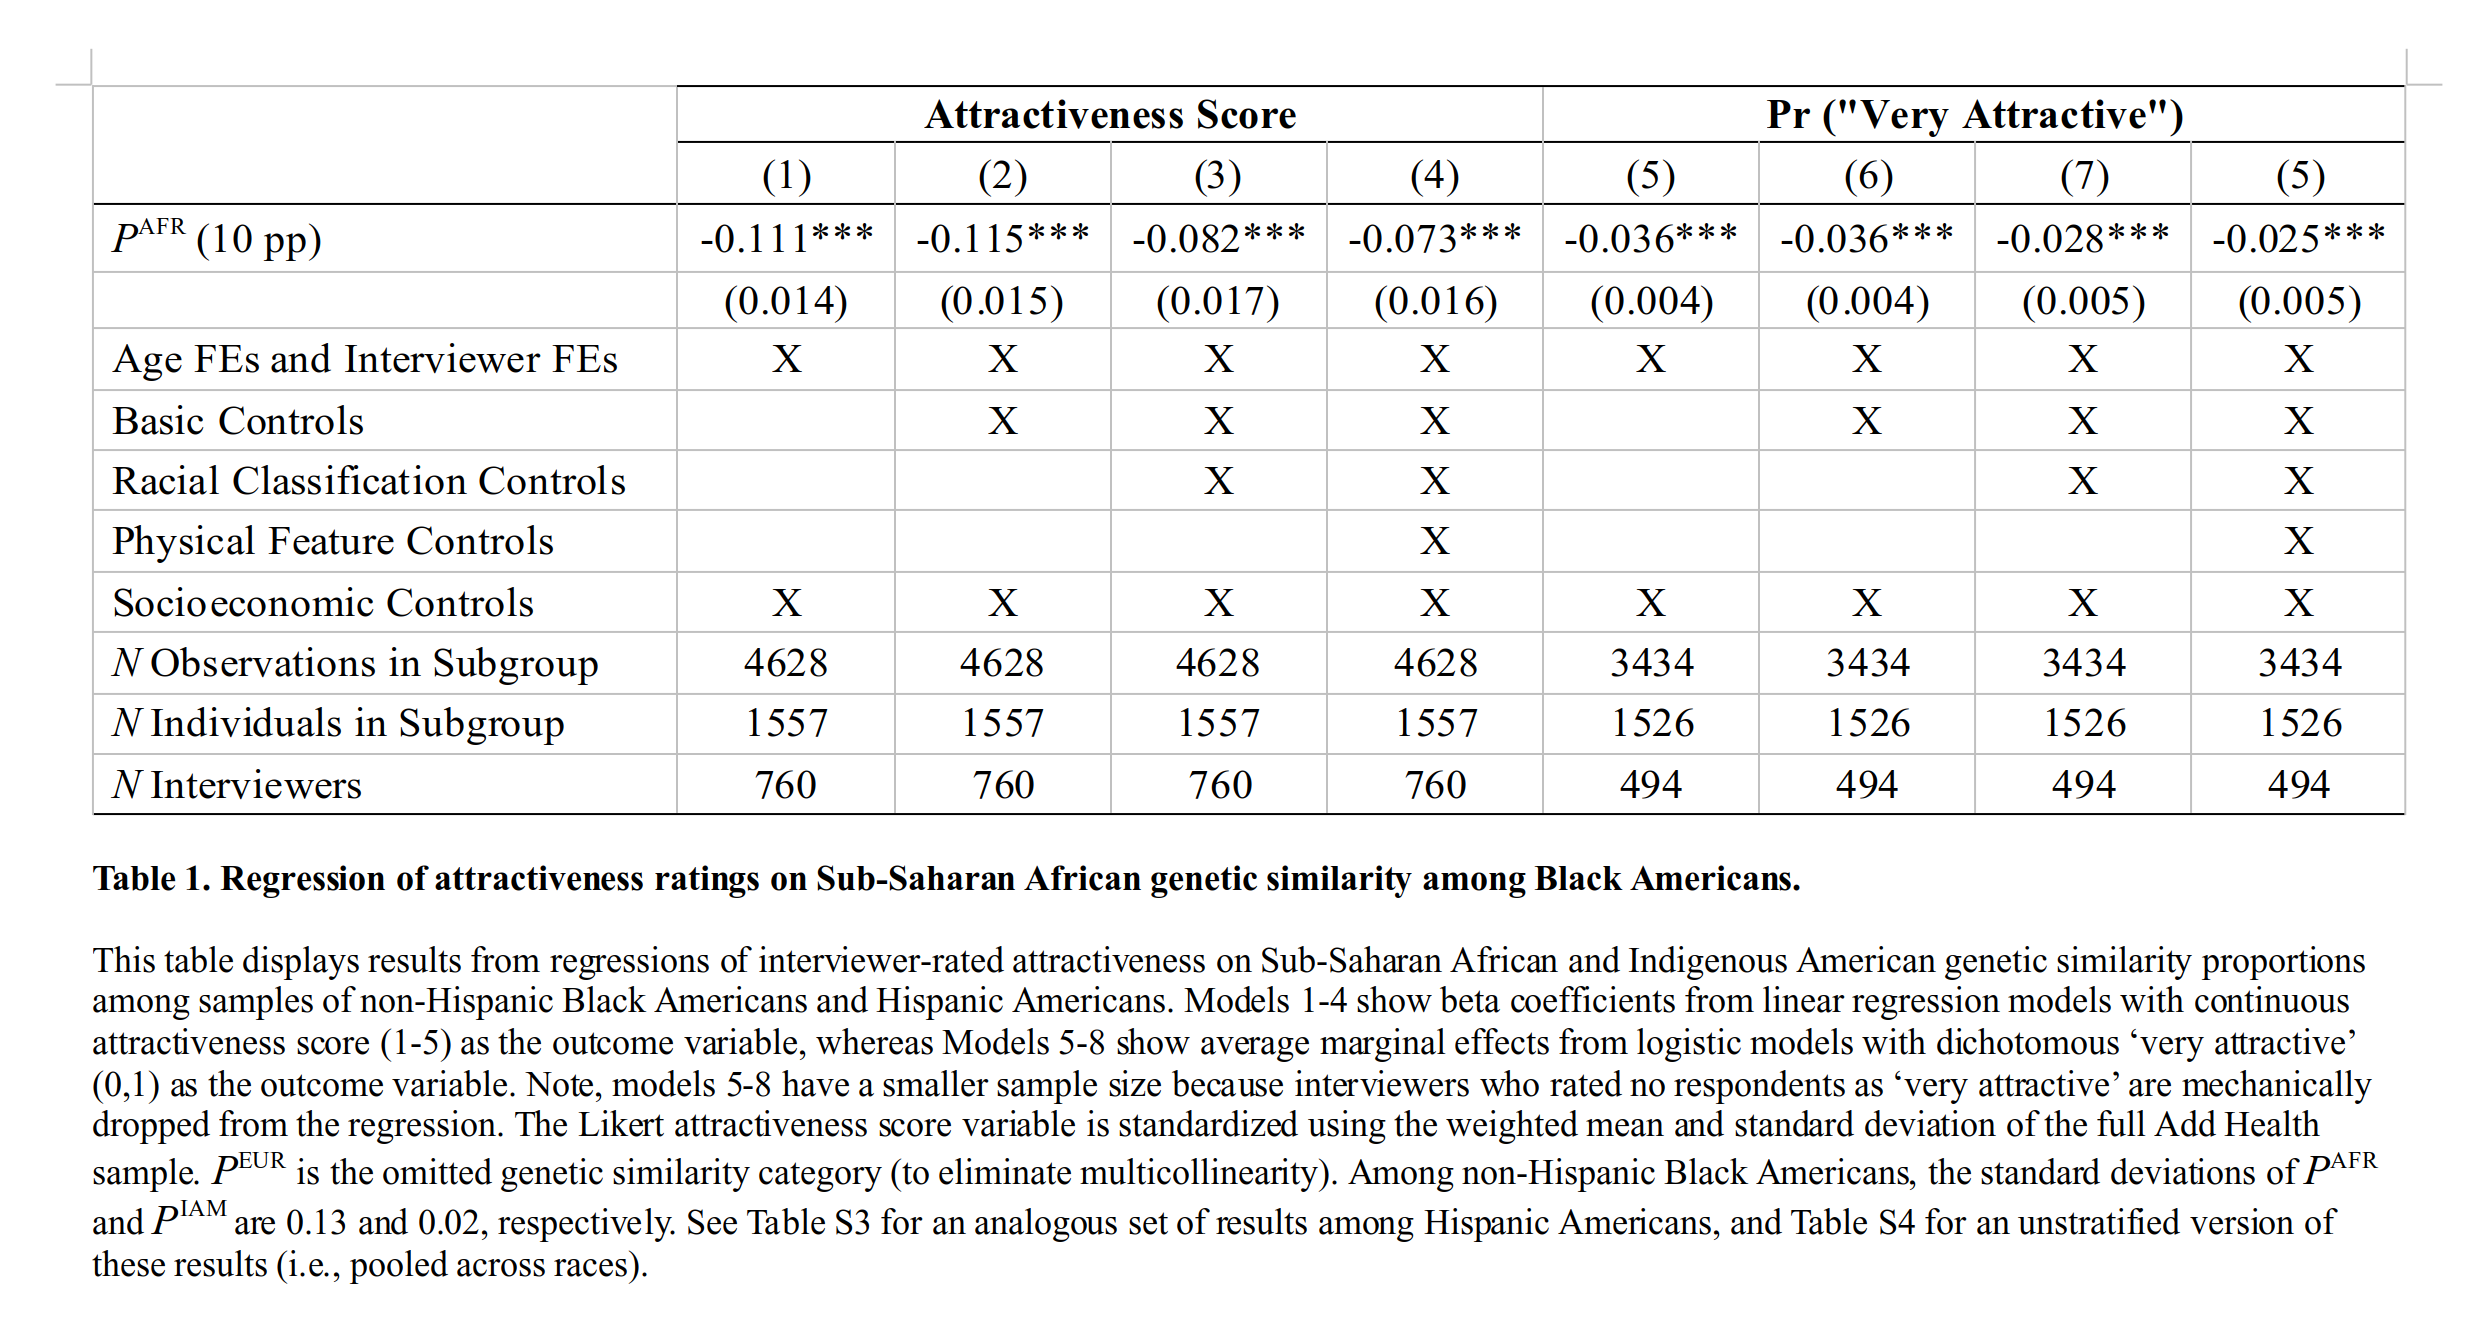
Models 1-4 predict the z-scored attractiveness value, and models 5-8 use logistic regression to predict the highest rating (corresponding to the right plot above for the circles). As such, we can see that the ancestry predicted gap is somewhere from 1.11 SD to 0.73 SD depending on which controls or mediators you want to include.
The mystery here is that if African ancestry predicts lower attractiveness, and African Americans (Blacks) have about 0.80 more African ancestry than White Americans, then by admixture’s effect they should be about 0.80 SD lower in attractiveness. Yet the unadjusted gap between the groups is only 0.10 SD, a big discrepancy. Trying to explain these incongruent numbers is the goal of the study (“the predicted Black-White disparity in attractiveness score is over eight times as large as the measured Black-White disparity”). So what is their proposed explanation?:
In particular, our within-race analysis revealed strong penalties of Sub-Saharan African genetic similarity, which, combined with the very large difference in Sub-Saharan African genetic similarity between Black and White Americans, would lead us to expect Black-White attractiveness disparities far larger in magnitude than we, in fact, observe. This suggests an important limitation of survey-based attractiveness measures: they may suffer from social desirability bias (41, 42). That is, reviewers adjust their responses, either consciously or subconsciously, so as not to produce large average differences in attractiveness ratings across racial groups. Nonetheless, this correction appears to be relatively coarse; while interviewers are able to almost entirely eliminate unsavory average differences in attractiveness between racial groups, their responses nonetheless still show them penalizing Black Americans with high amounts of Sub-Saharan African genetic similarity. If survey-based measures suffer from this form of social desirability bias, then subsequent analyses will substantially understate the true magnitude of Black-White attractiveness disparities. In addition, these findings illustrate how discrete correction procedures fail to successfully mitigate stratification based on a continuous set of underlying dimensions.
Interviewers are cooking the books, they suggest, giving affirmative action ratings to African Americans as a group, but not to more African-looking people within the Black group. In regular social psychology terms, this is an explanation based on differential standards or within-group norming. This kind of effect has been found many times which I have written about before (reference group effect).
They also considered another simpler option: maybe it’s just that interviewers were Whites and prefer their own racial standards? Also no:
Black interviewers impose stronger penalties onto Black respondents than White interviewers do; while among Black interviewers a 10 percentage point (pp) increase in Sub-Saharan African genetic similarity is associated with an 0.159 SD decrease in attractiveness score and a 5.3 pp increase in the probability of being rated as ‘very attractive’, these relationships attenuate to 0.064 SD and 1.7 pp among White interviewers (but nonetheless remain statistically significant). Similarly, the magnitude of Sub-Saharan African genetic similarity attractiveness penalties is the largest in the South, smaller in the Northeast, and smaller still in the Midwest; finally, in the West, there exists no statistically detectable attractiveness penalty.
Thus, those interviewers who were more familiar with Blacks show a stronger effect, both in terms of their own race (Blacks know more Blacks than Whites), and where they did the ratings (stronger effect in the South, which has more Blacks).
They tried poking at some of the mediation using ‘machine learning’ which is here just elastic net, which is just linear regression again but with penalization (cue the meme):
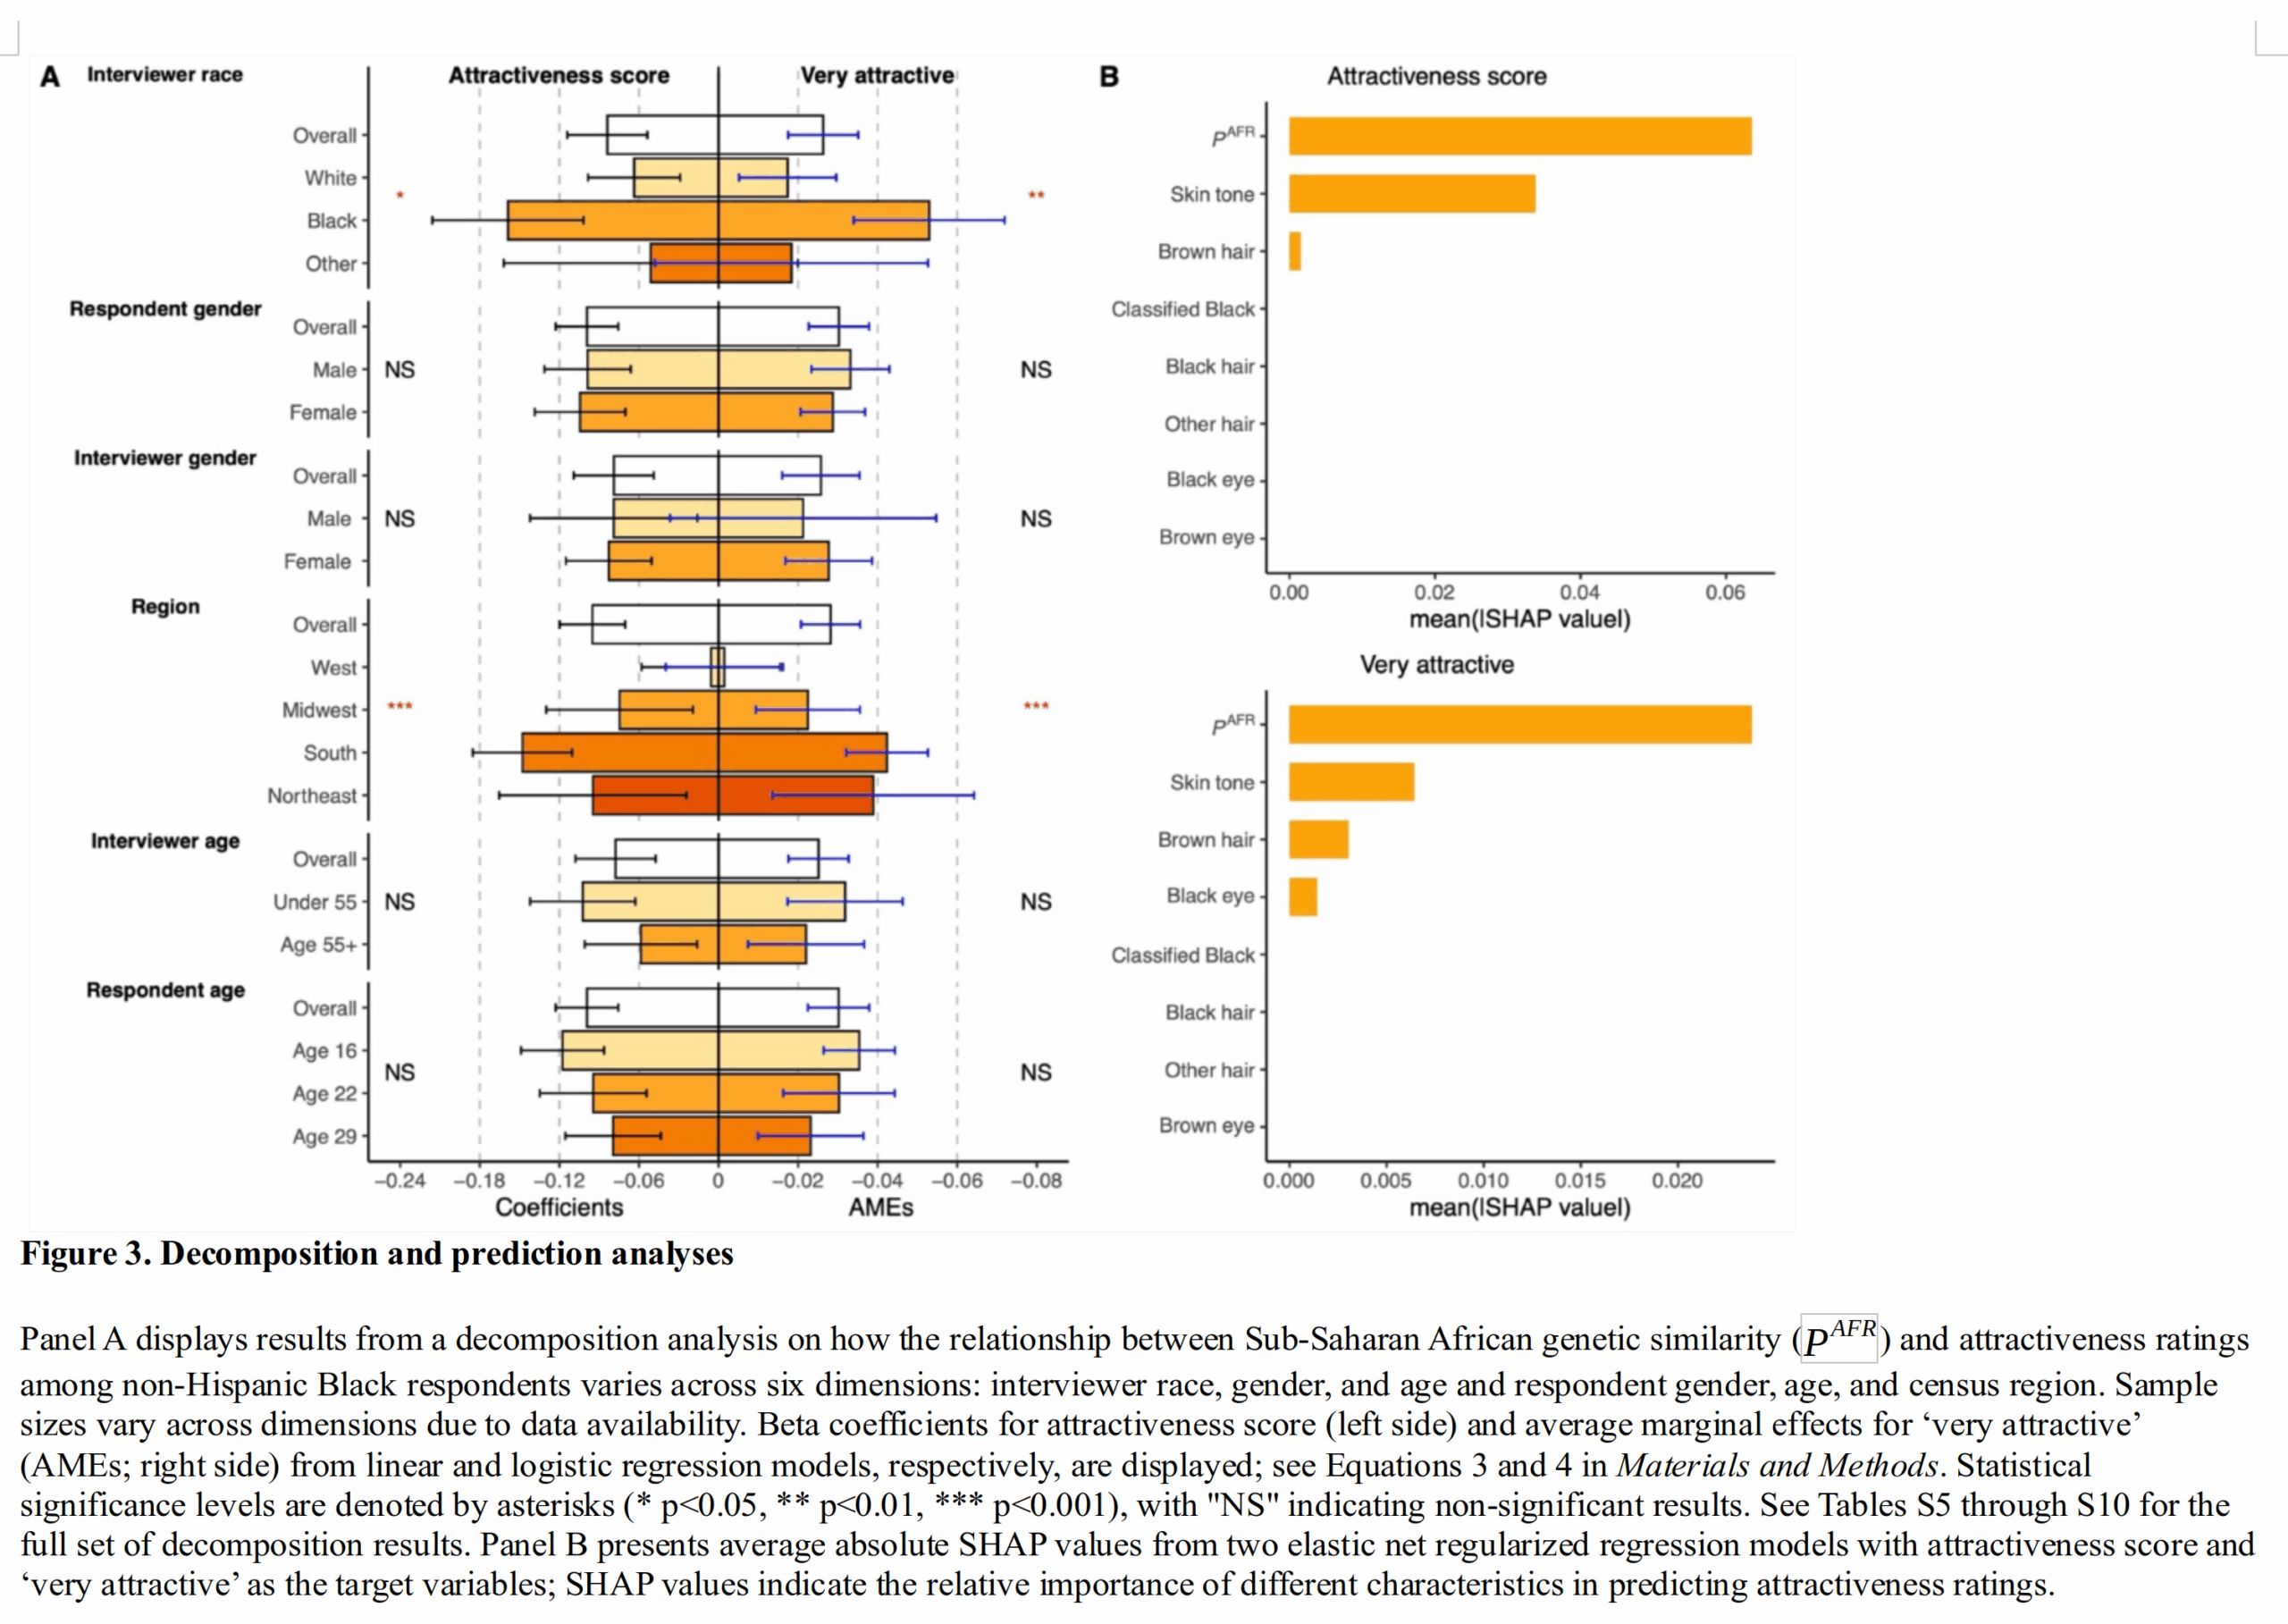
(I)SHAP is a kind of way to interpret black box models by looking at local linear effects. In this case, they seem just interested in using them to compare variable importance (there are other metrics for this that work with regression models, and this model isn’t a black box to begin with). Anyway, their results showed that ancestry dominates the other variables, though skin tone was about half as important as ancestry. It is in fact a bit strange that ancestry has stronger effects than the mediators. How could ancestry affect beauty if not through race-related visual phenotypes, which would be mainly skin, hair, and eye color? It suggests some of the effect is related to other appearance traits, such as obesity, dressing nicely, or hair styling.
The authors think admixture analysis is quite great:
Our results also have substantial methodological implications. The superior predictive power of GSPs compared to other measures of physical features (e.g., skin tone), as well as their desirable measurement properties, highlight their strength as a new tool for social scientists interested in measuring and studying processes of racialization. Notably, we argue GSPs represent a complement to – and not a replacement of – existing survey strategies for quantifying the many continuous dimensions of race. In addition, many studies that lack measures of racialized physical features and racial classification (for instance, the Health and Retirement Study (43) nonetheless have collected genetic data, meaning the use of GSPs may aid the continuing expansion of scholarship on continuous (rather than discrete ) racial stratification.
Remember again that GSP is just racial ancestry estimates based on genetics.
Given this kind of work, you may expect the authors to be supremely racist, probably some old White man who should be fired. However, first author Beza Taddess looks like this:

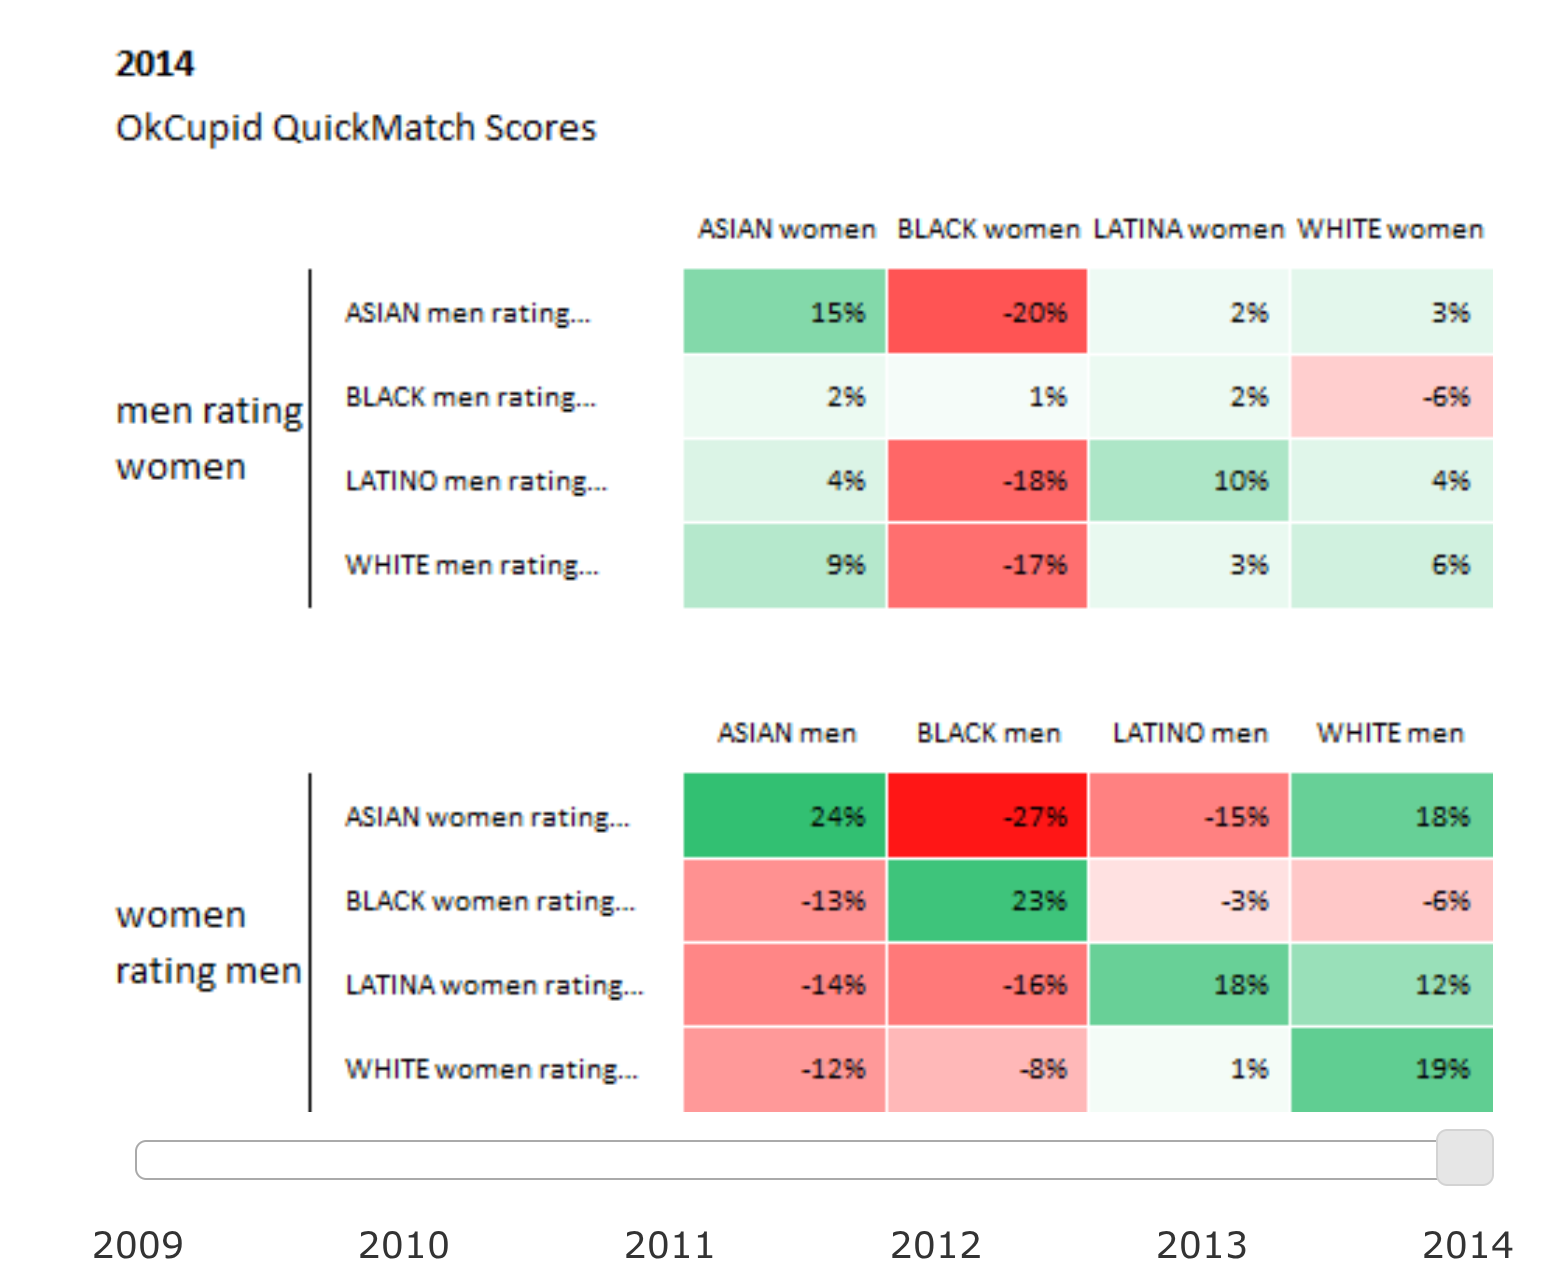
The admixture regression combined with their affirmative action for attractiveness ratings model perhaps explains why Africans are so disfavored as potential mates on the notoriously superficial dating apps. They didn’t mention the OKCupid results (2014), but they look like this:
These aren’t anomalies because later studies found results like these (Facebook dating):
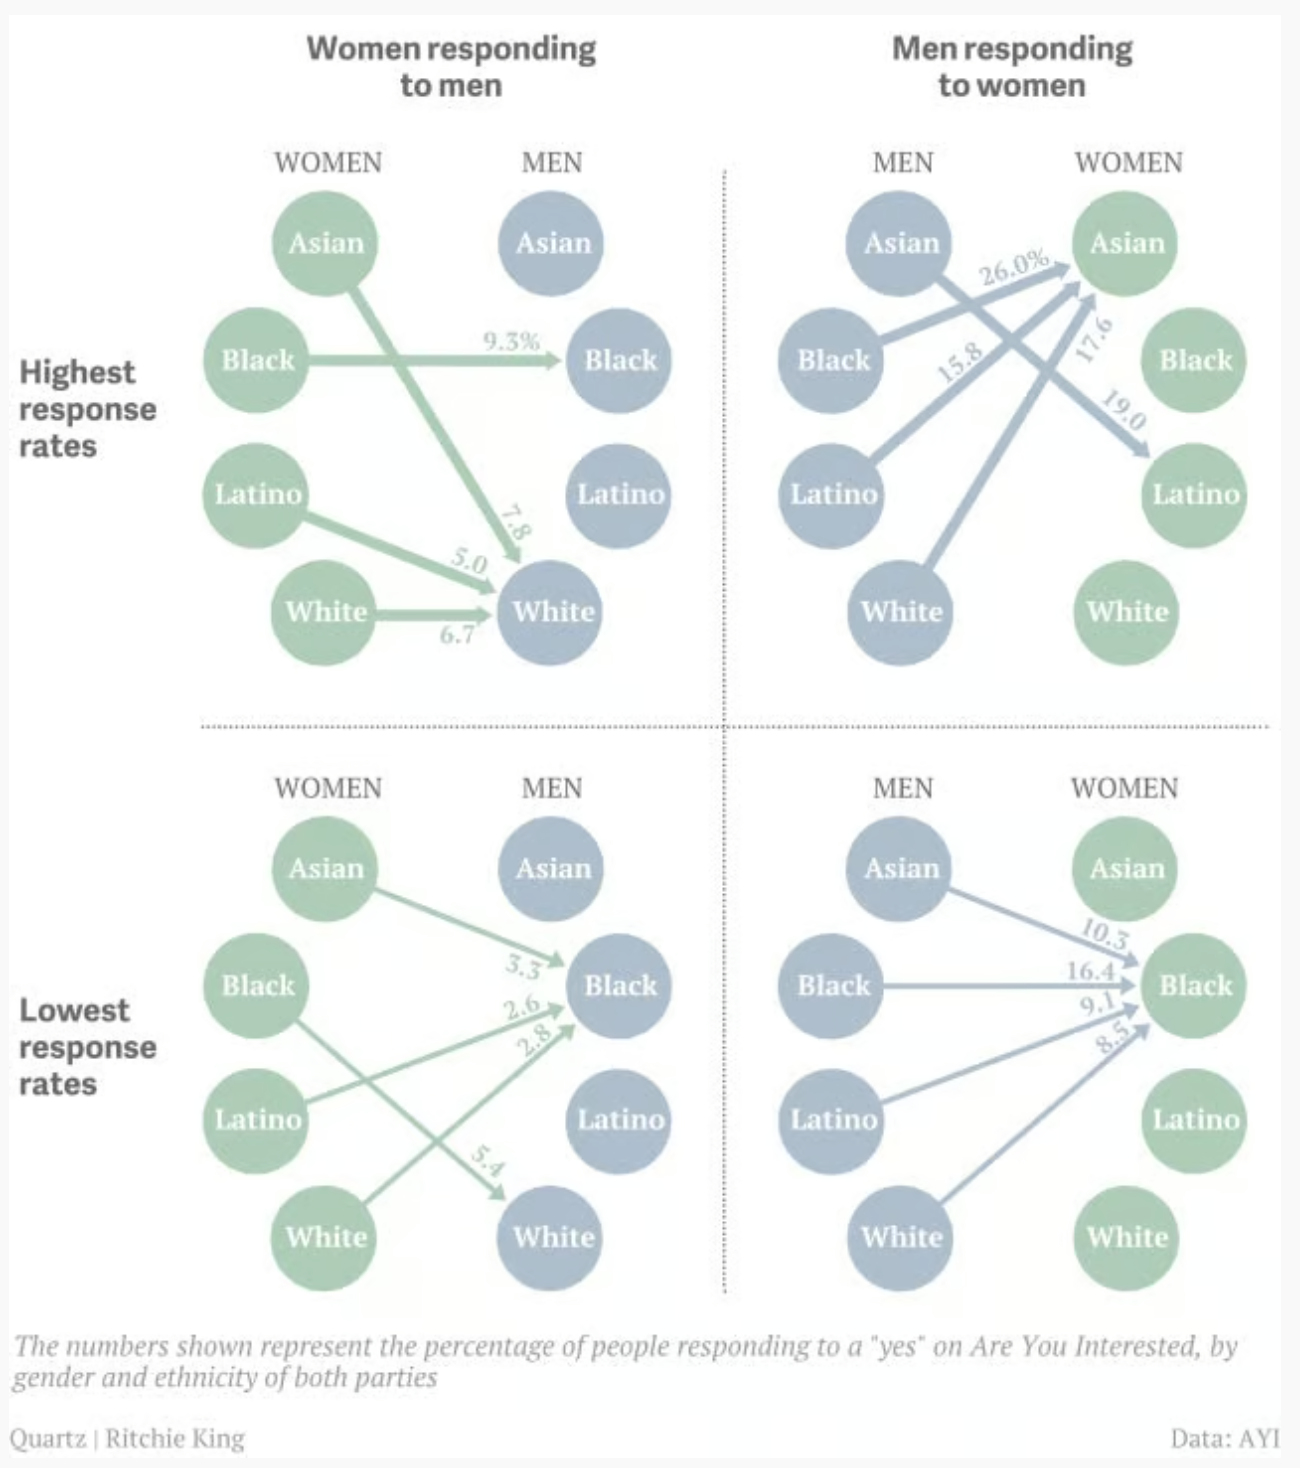
Women prefer White men, and men prefer Asian women. The exception to this is that Black women prefer Black men.
And just for good measure, they didn’t cite a prior study that used the same dataset to examine race differences in attractiveness. This was by Satoshi Kanazawa. He got into a lot of problems for writing a blogpost about it in 2011. His mistake was perhaps that he wasn’t a Black woman and didn’t phrase things in woke language. In fact, his post has been memory-holed, so it was hard to find a link to the actual article. However, BuzzFeed used to have a picture of the entire post here (it seems everybody refused to link directly to it). There is an attempted debunking here. Anyway, his chief finding was these plots:
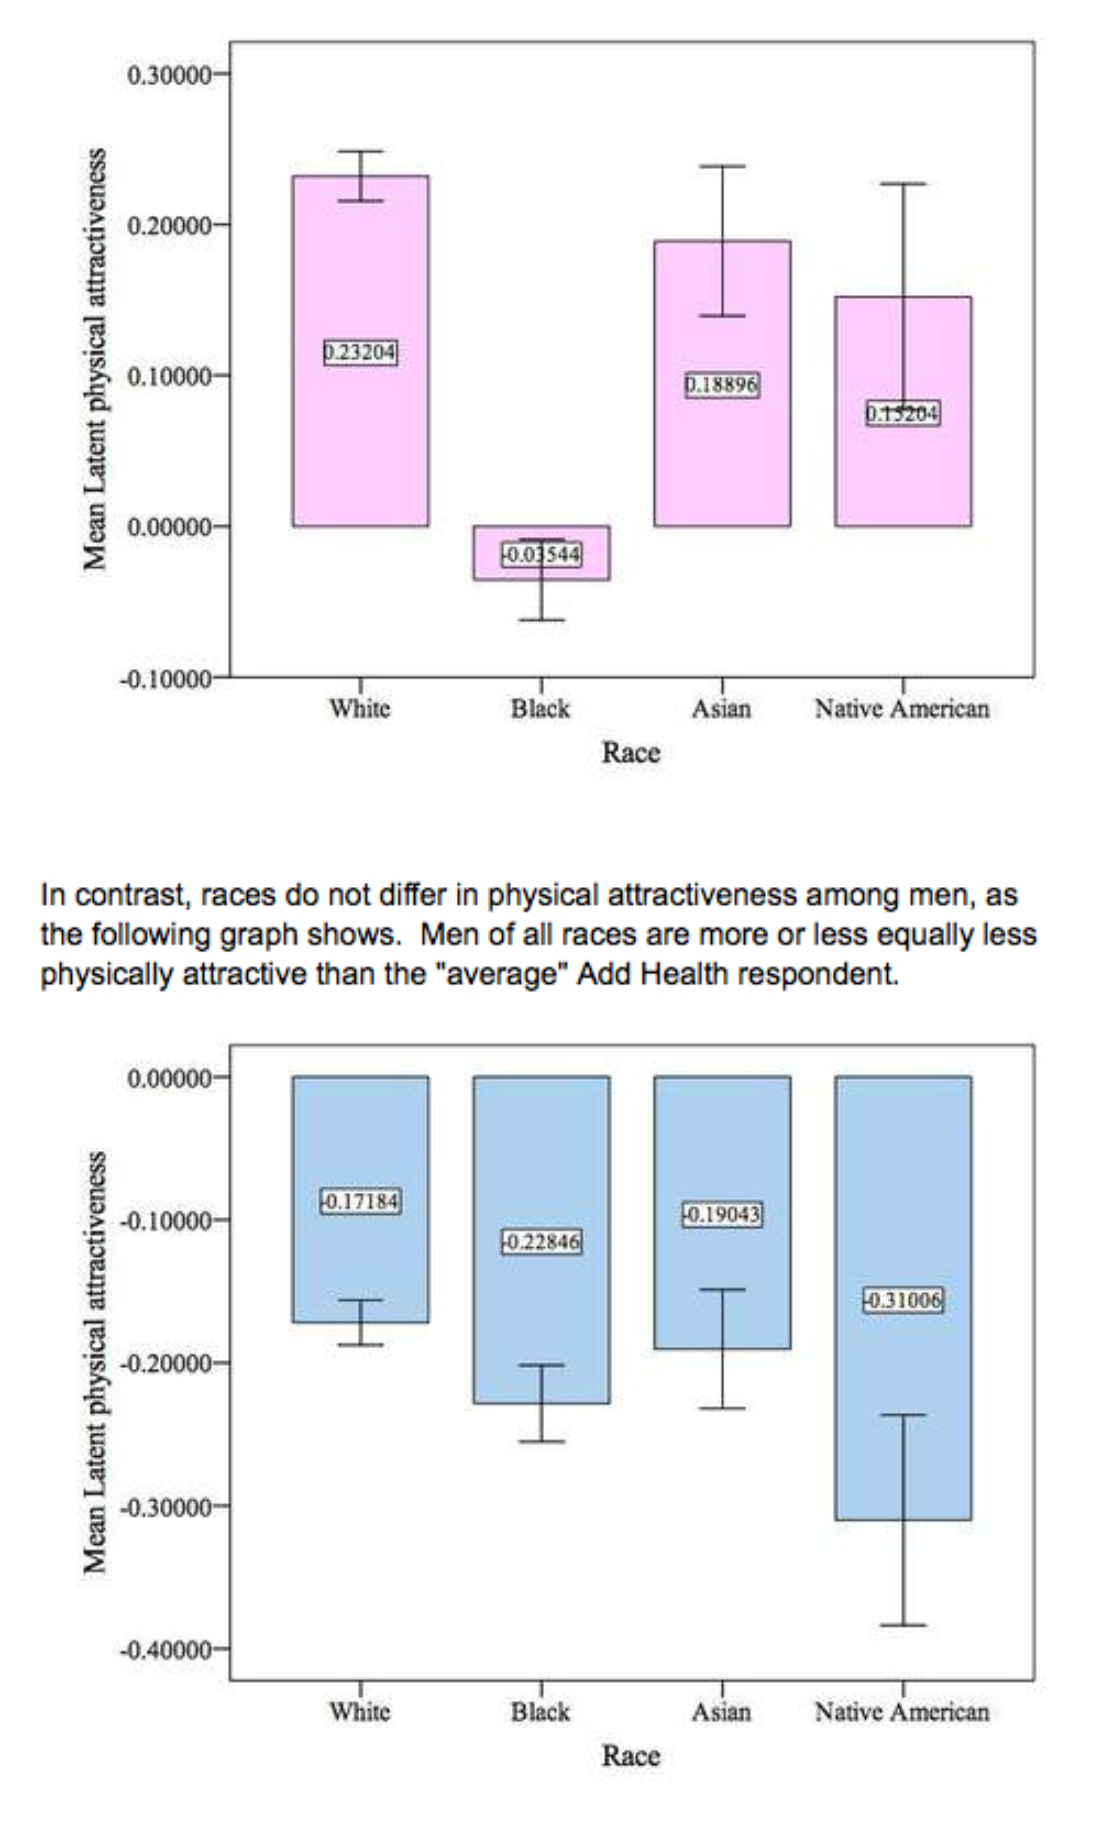
Basically his results showed that Black women had particularly low attractiveness ratings. I post his results here because I oppose censorship, so now they will be more difficult to hide, even if they should be questioned. Since the data is mostly public, any reader can download the data.