Working with the IMDB data, we can also have another look at who makes the best movies. I previously examined this using the best foreign film category from the American Oscars. This approach precludes a comparison with USA itself, and any countries that Americas don’t include for political reasons. As we previously saw with the IMDB ratings, the distribution of scores changes over time, that is, declines. This change affects the distribution itself:
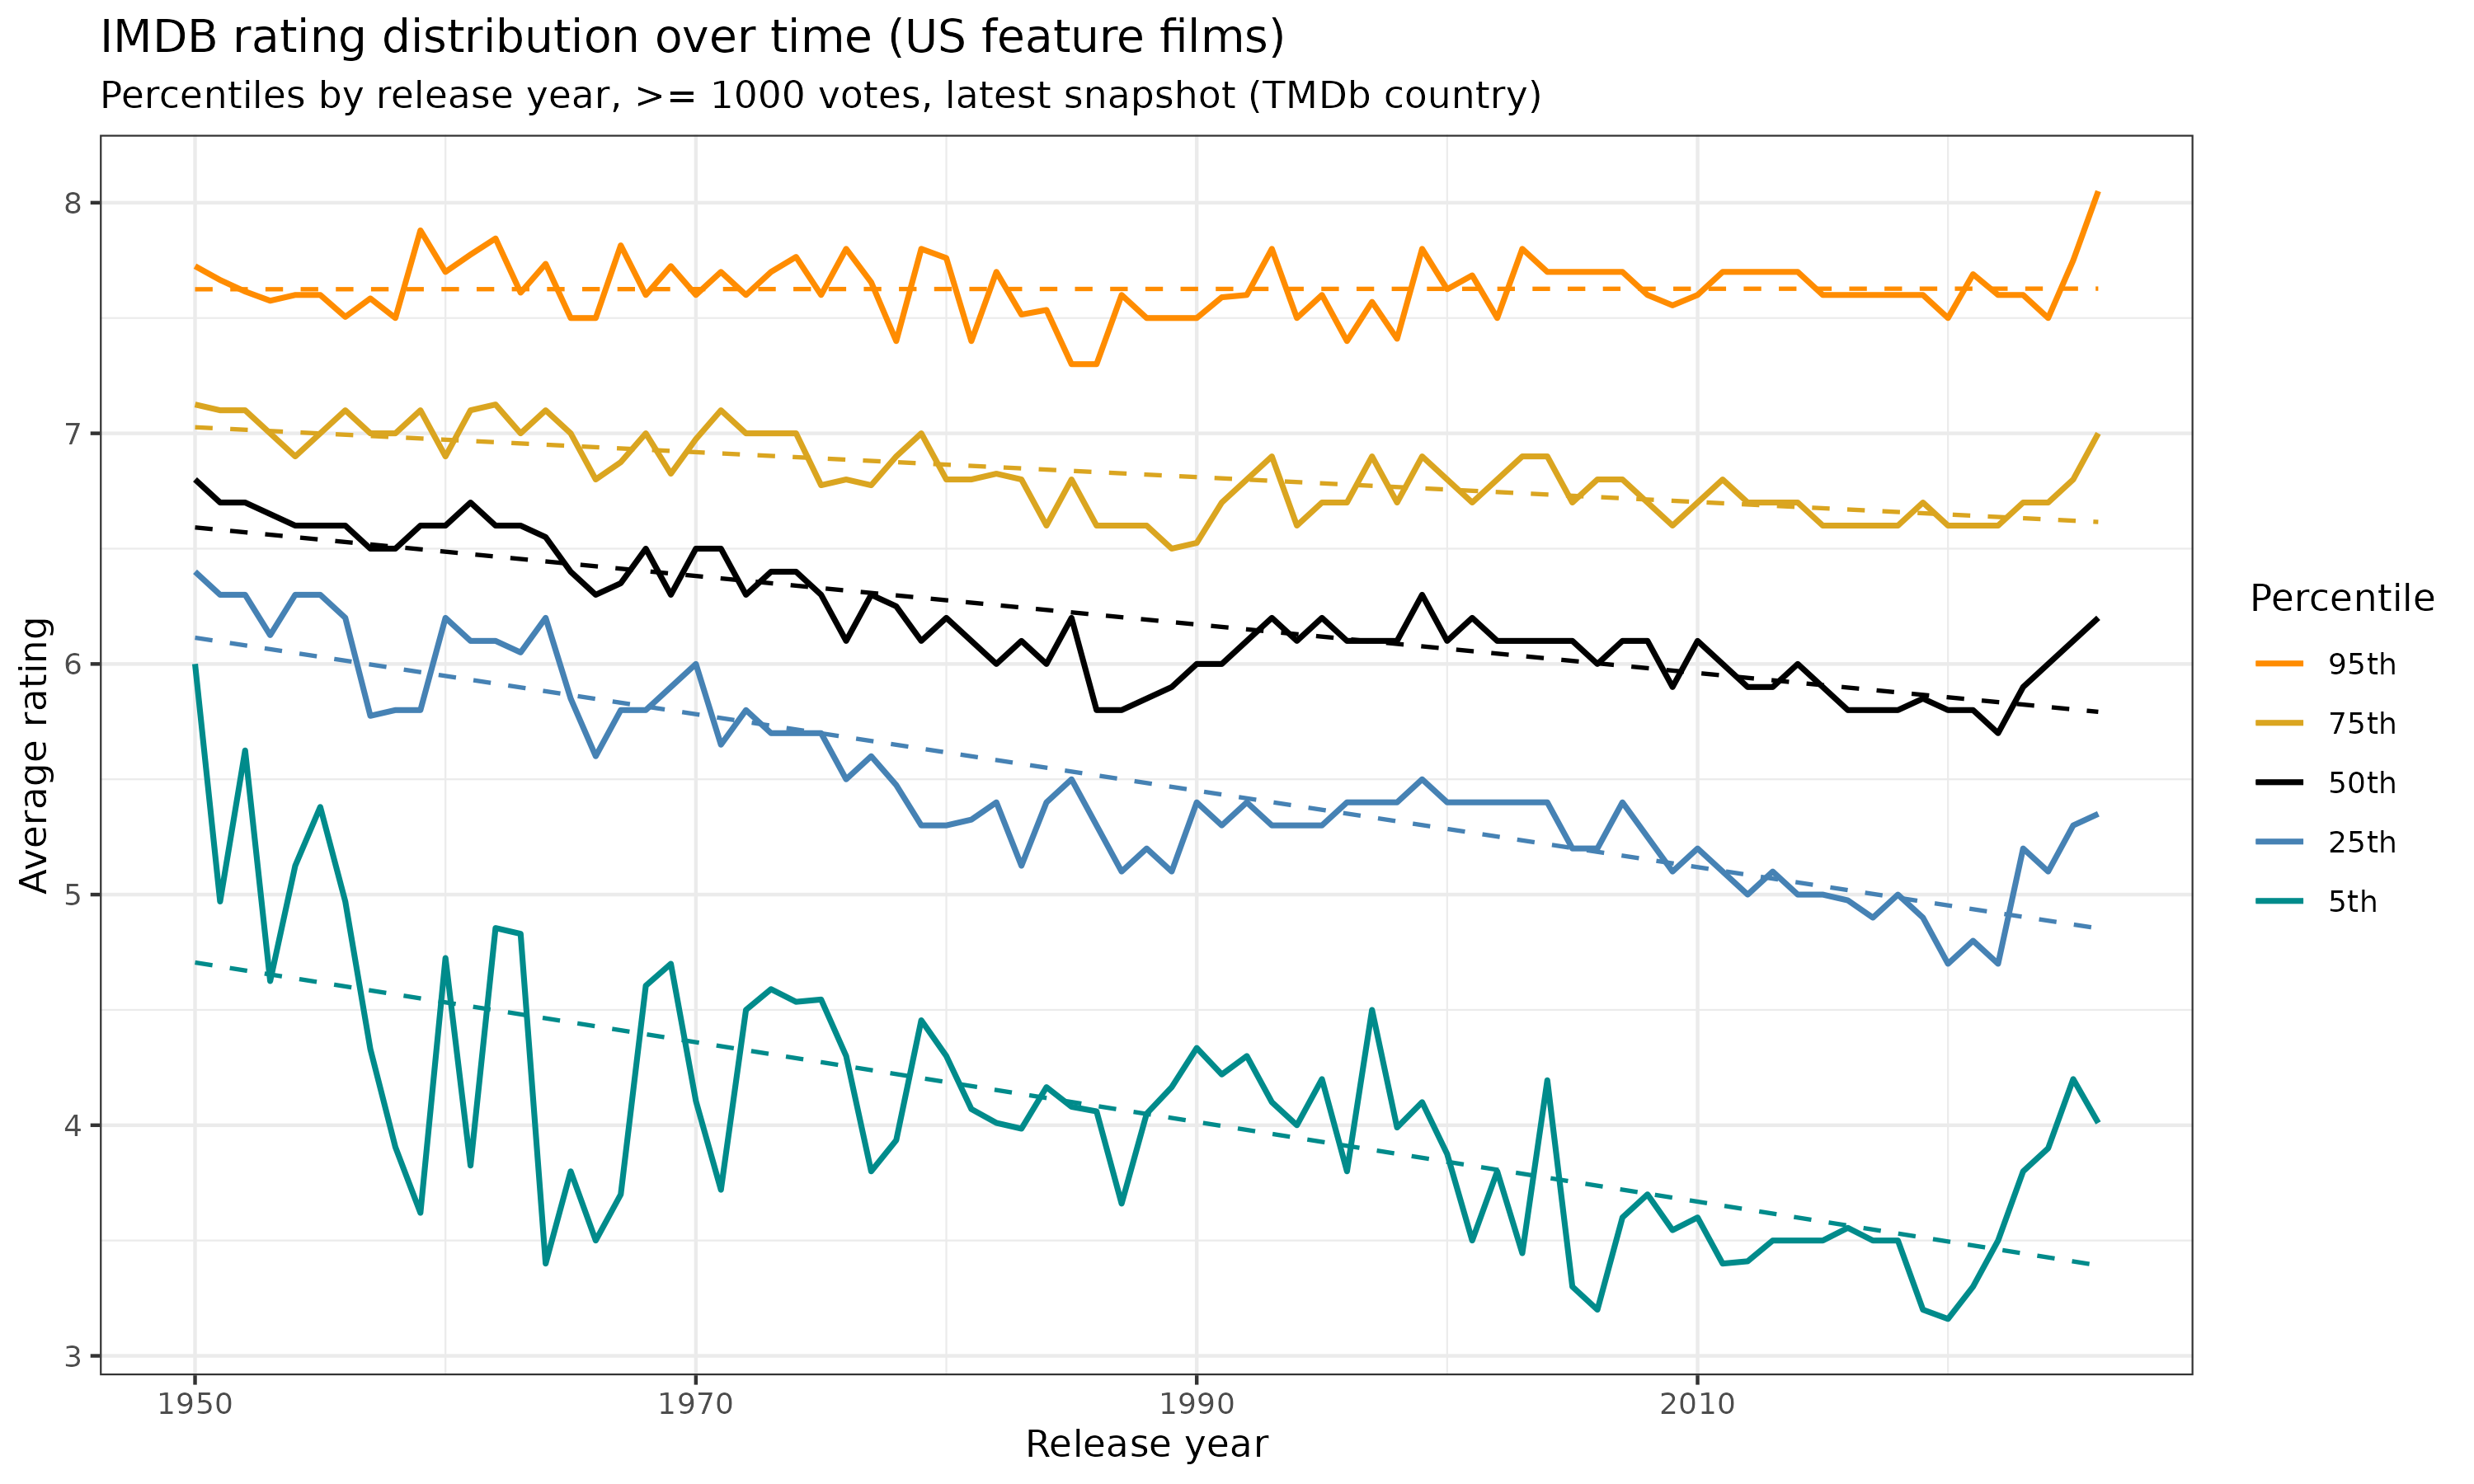
Looking at this, can see that the median (and mean) movie is declining in ratings, but the top 5% is not. The bottom 5% is declining at about twice the speed as the overall trend. This also means the variation in quality is increasing, consistent with a lowering barriers to entry model (people who had a half-baked idea for a movie in 1980 probably didn’t secure funding for this and couldn’t afford the equipment themselves, but in 2010, they could).
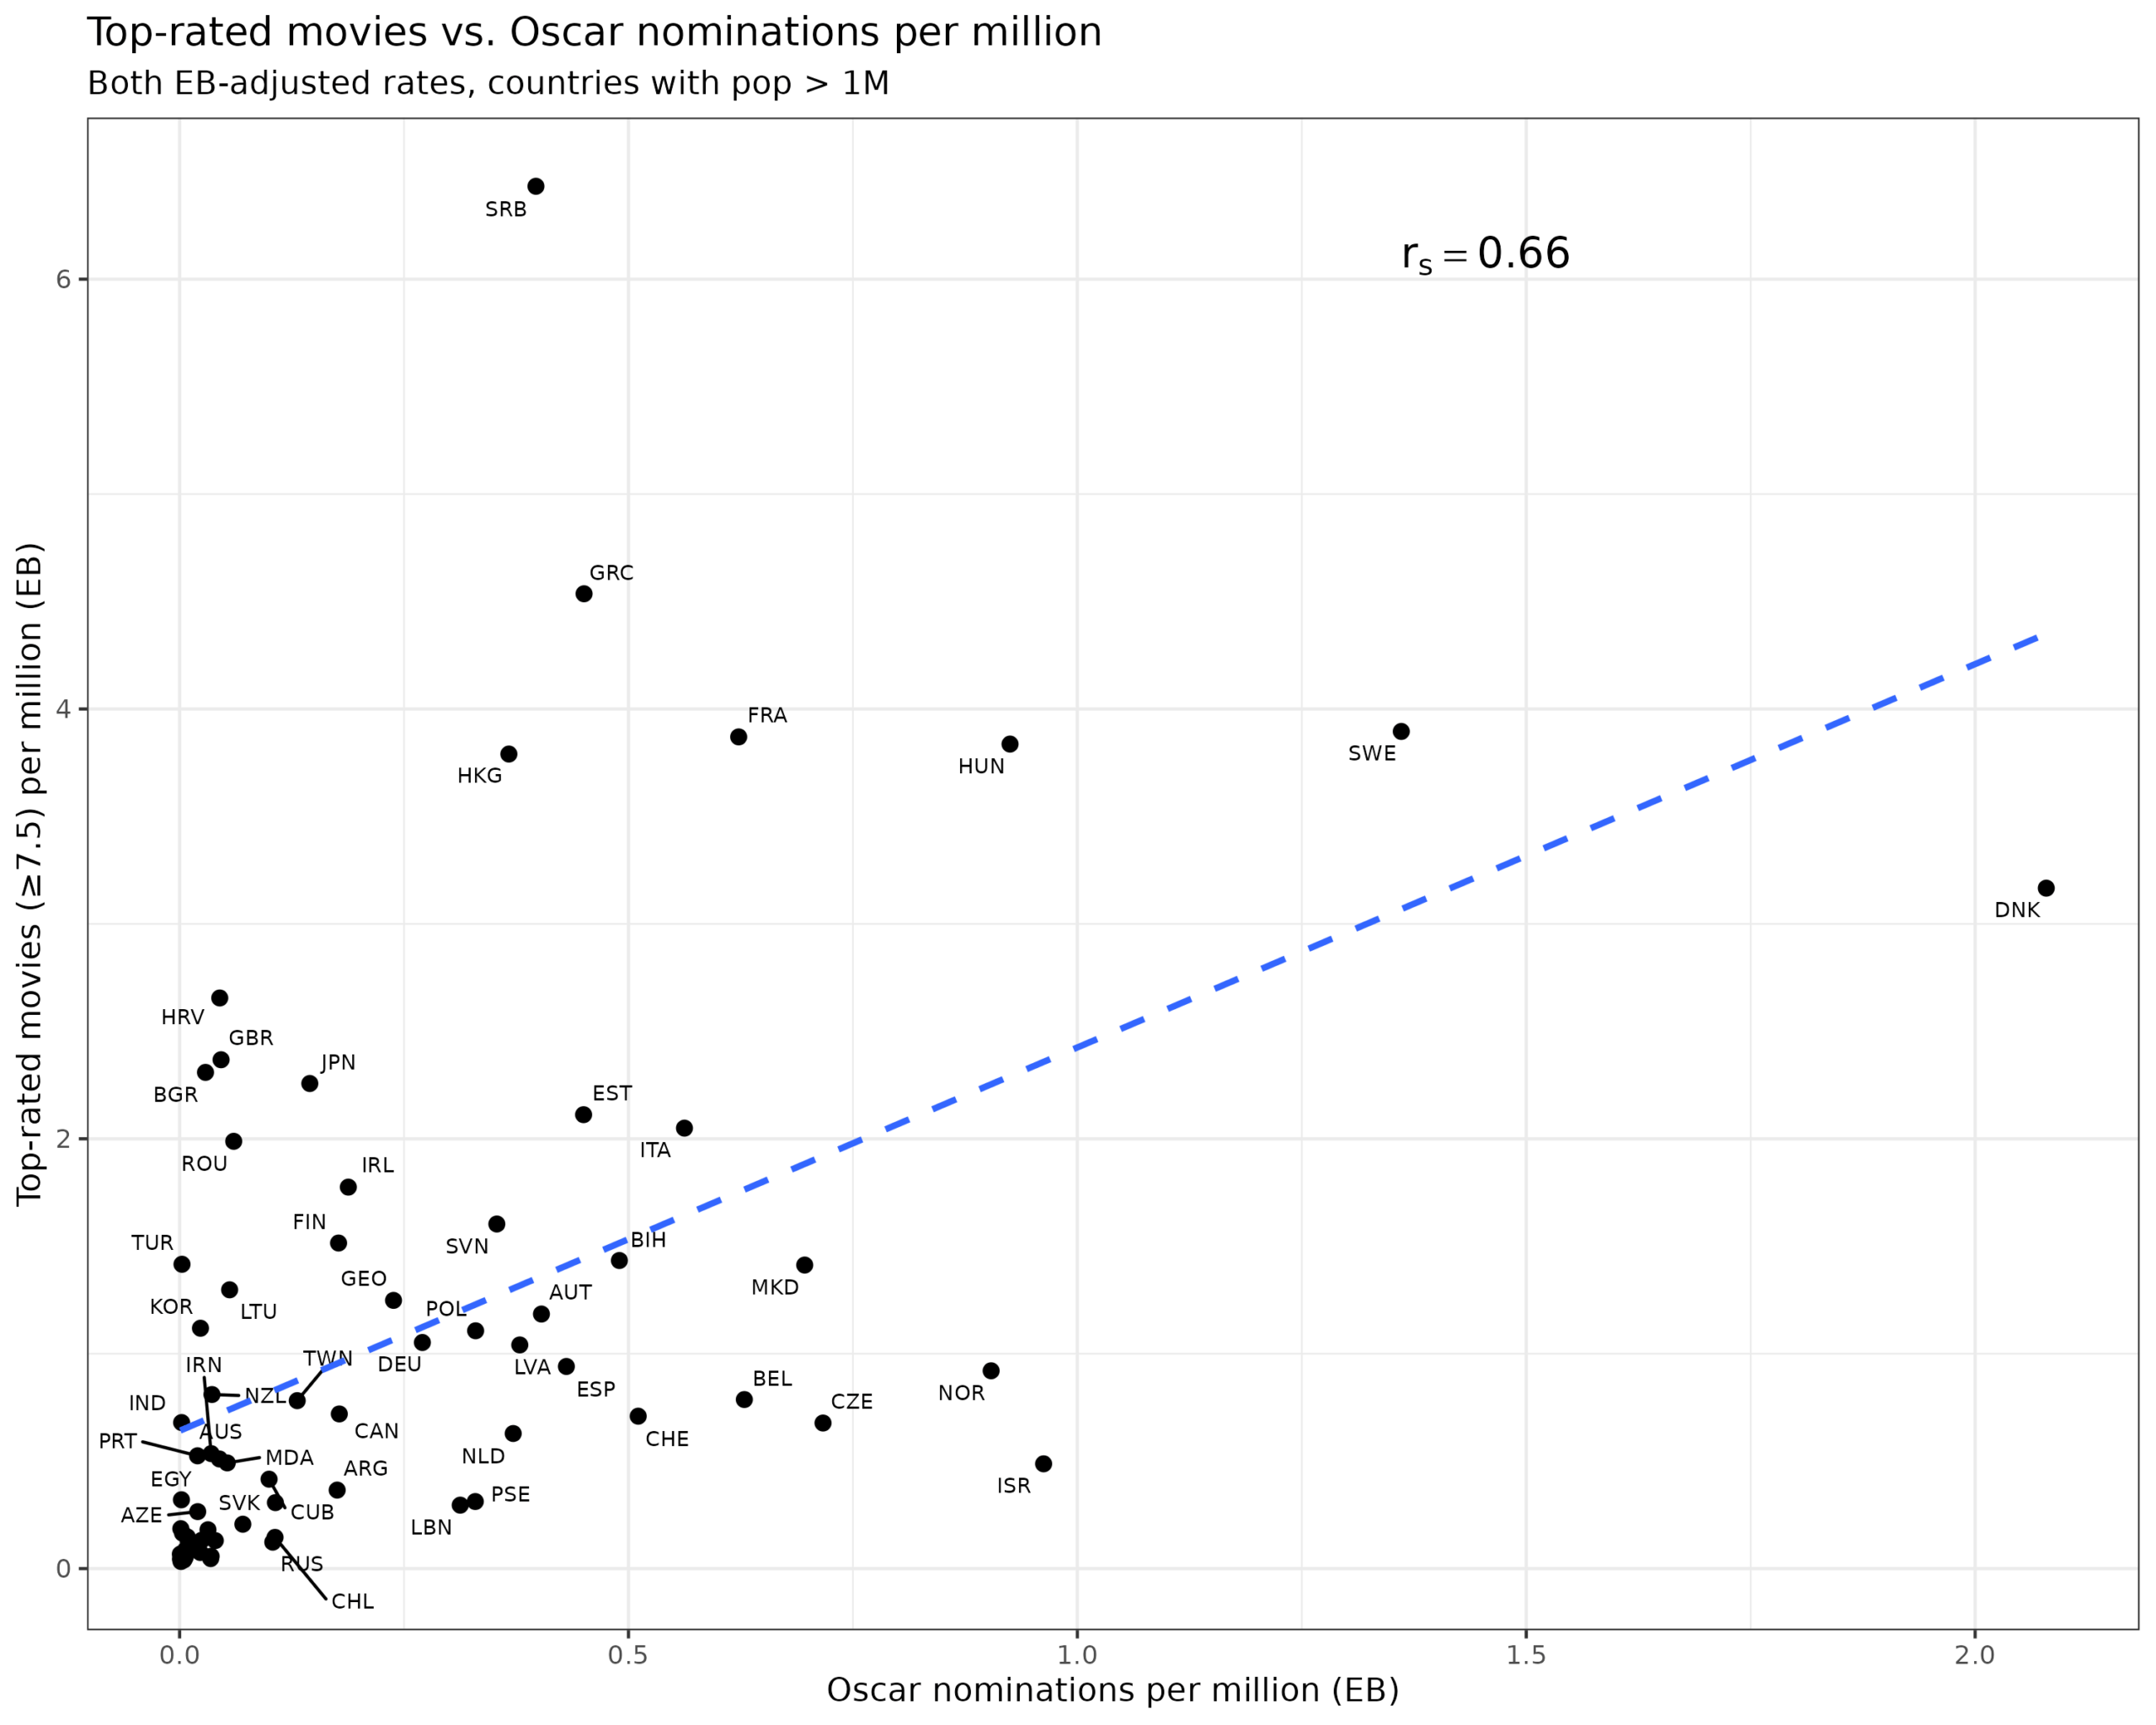
Anyway, if we want to know which country makes the best movies per capita, then we need a working definition of best movies. The more strict we make it, the fewer movies will be available for statistical estimation of country rates, so there is a trade-off. I went with the relatively broad definition of 7.5+ rating on IMDB with at least 1000 votes. If we plot the Oscar (best foreign) nominations per million vs. top movies per million, we get this not very nice looking plot:
The Oscar nominations is a relatively small dataset, and we can’t be more inclusive there to improve precision. Top movies, we can change the criteria to include more or fewer as we wish. Better perhaps is to look at the total number of movies produced with at least 1000 votes. It is important to do some kind of vote count filtering because otherwise the data will be full of unknown indie movies with 9 votes (all of them friends of the makers) and mean ratings of 9.5. Top movies vs. all movies per million:
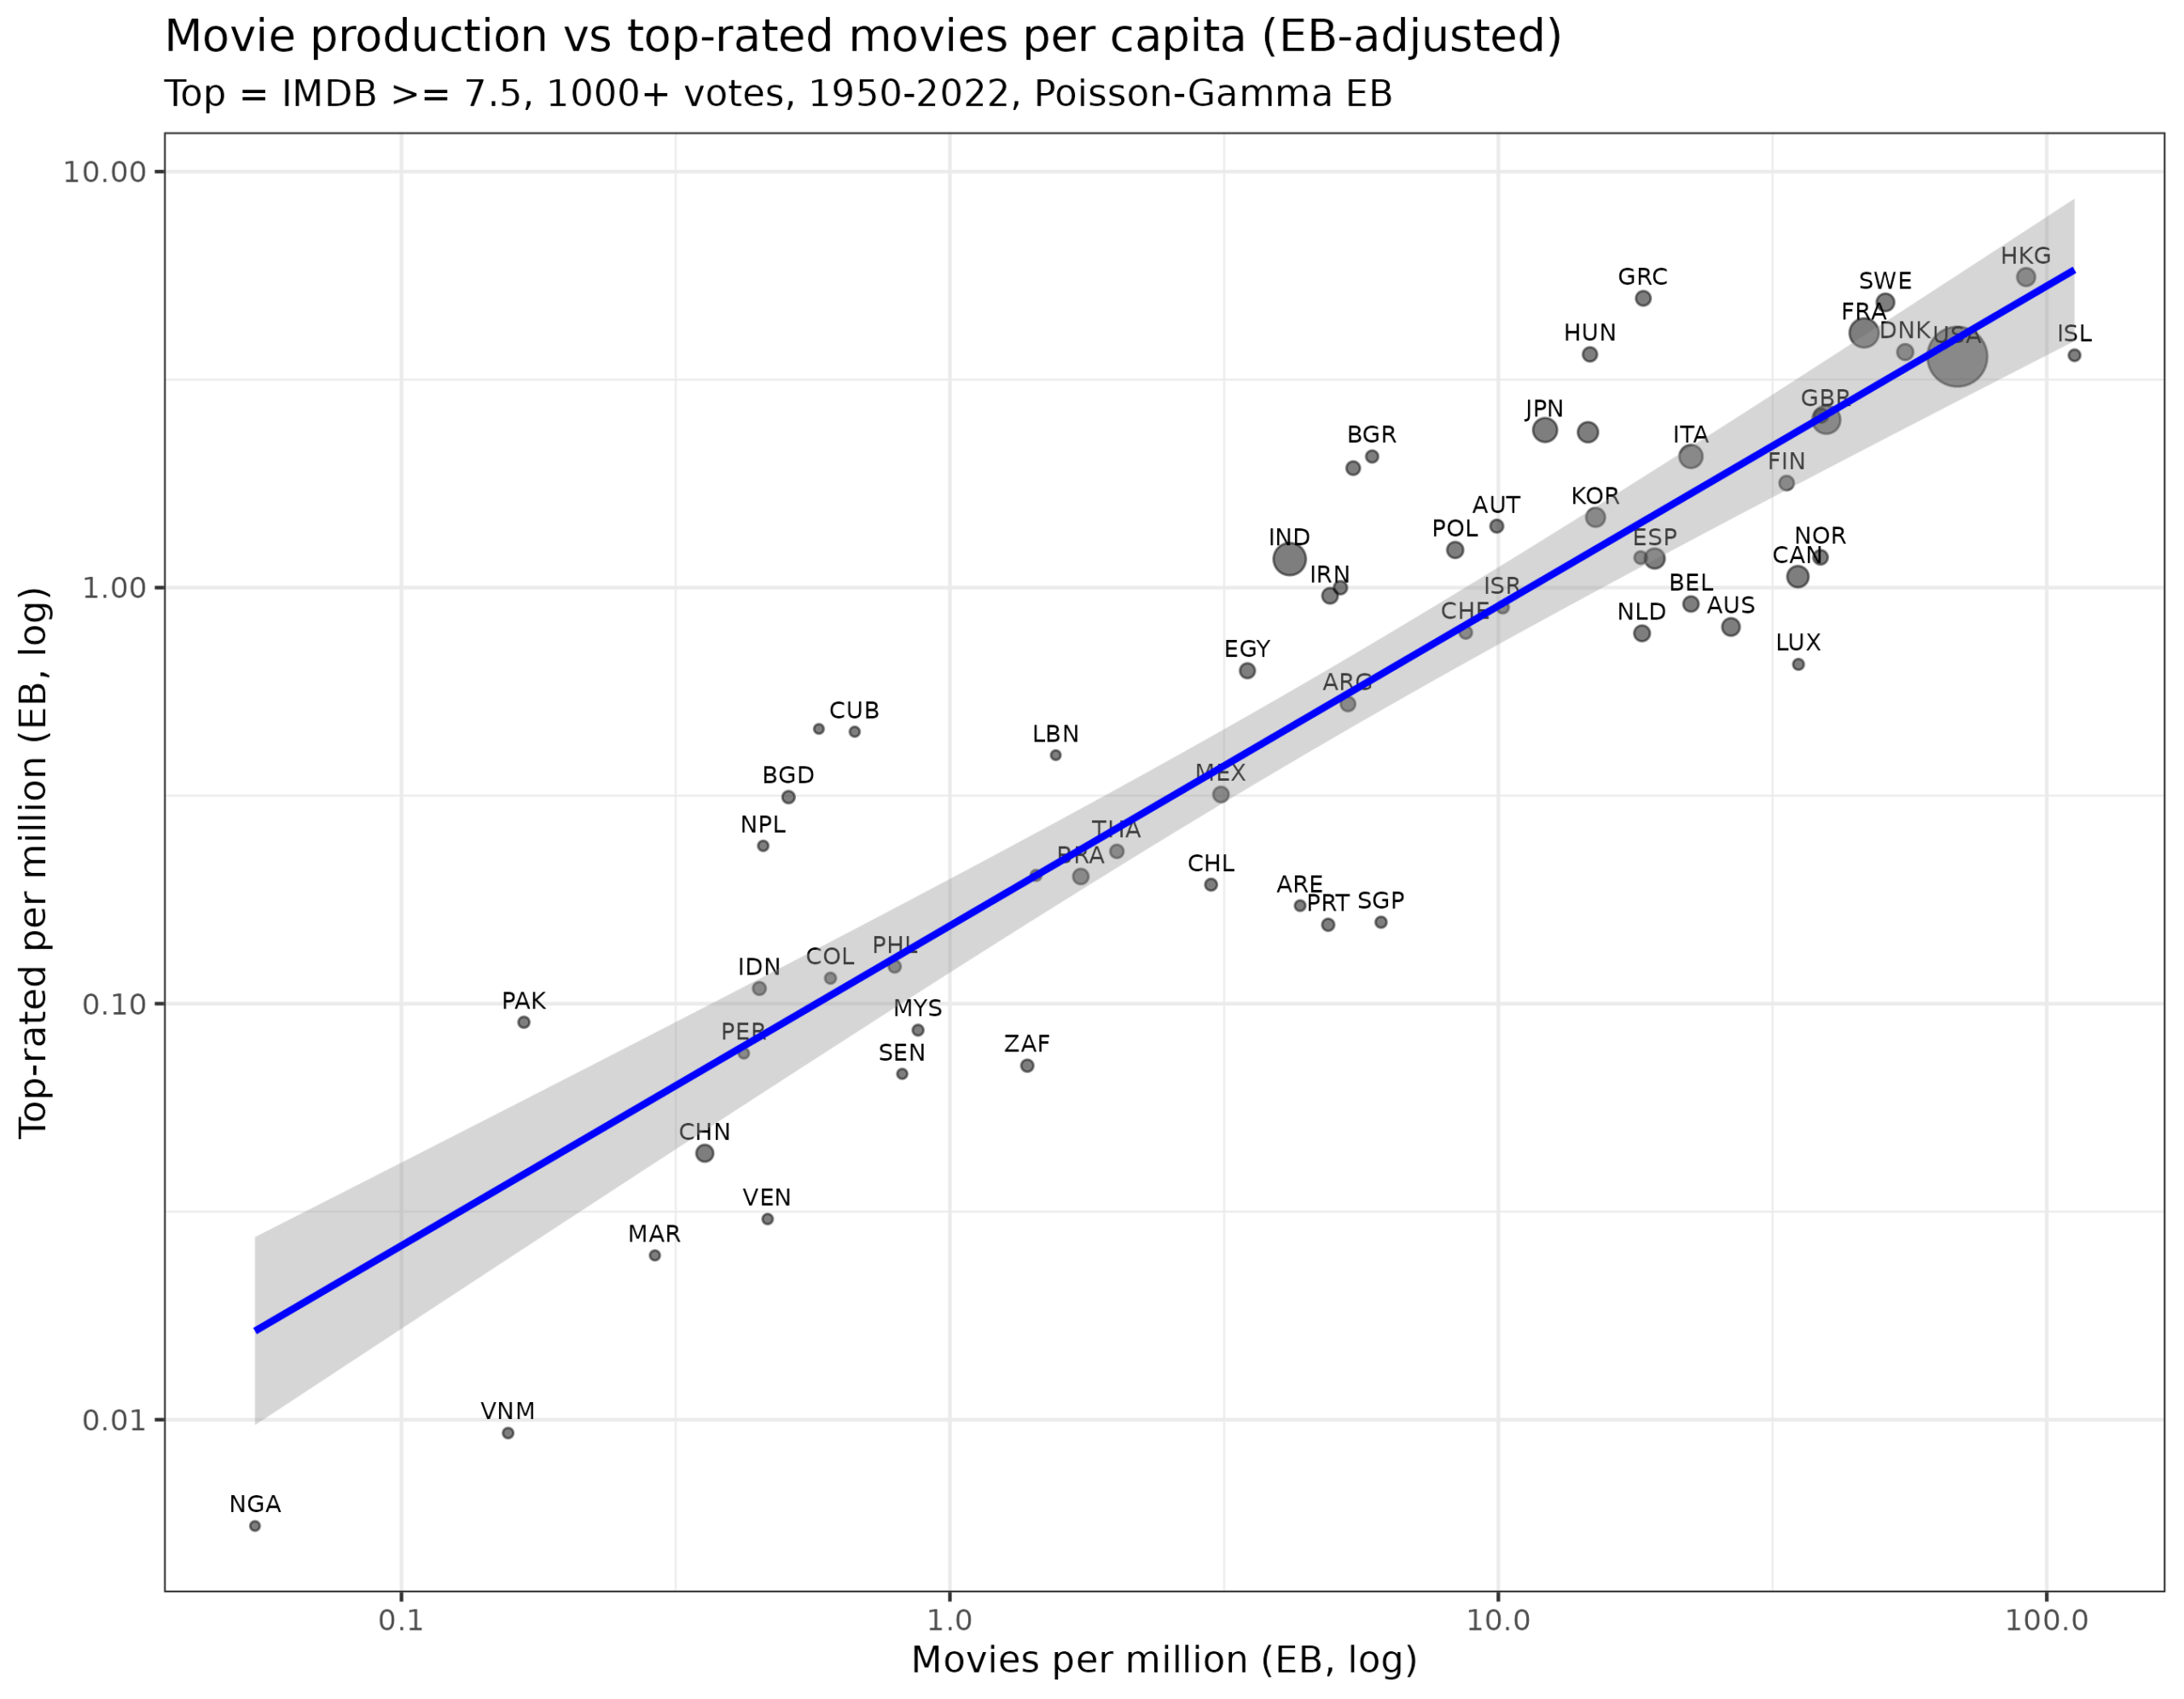
Like the other analyses, these rates are adjusted towards the mean using the empirical Bayes shrinkage method. This is because otherwise small population countries would dominate the top lists due to luck (every random semi-independent island with a population size of 50k who made one ‘top movie’ would rank in the top 10). In general, we see that there is probably little to gain from trying to subset to top movies versus just including everything produced by that country. It works the same way in science. Counting publications in top journals vs. just counting everything produces essentially the same country differences. Note also the log10 scale of the plot. Tiny Iceland (ISL) really does produce 10x the number of movies as Israel (ISR) and Austria (AUT), and over 100 times more than 3rd world countries. Granted, some of this is because no one bothers to add their movies to the Anglo-centric IMDB and vote 1000 times.
Also looking at the plot, we see that countries with more top movies than one would expect tend to have either extreme language barriers (East Asians) or ethnocentric peoples. India, for instance, produces ostensibly lots of top movies (about the same rate as Norway and Spain), to the point that using IMDB’s search engine has become unhelpful since results are full of high-rated Indian movies. Now, maybe I just don’t like Indian movies, but I figure Indians tend to just use the scale differently than other countries, that is, their ratings are inflated. Greece also shows the same pattern. The top rated Greek movie is World Gone Mad (Tis kakomoiras, 1963) with a mean rating of 8.8. This ranks it roughly the same as Pulp Fiction, Lord of the Rings, Forest Gump and so on. Perhaps this is a secret gem that only Greeks understand, but probably not. The movie doesn’t even have an English Wikipedia page and all text reviews of it on IMDB appear to be written by Greeks.
Since it is unclear exactly what metric is best, I correlated them with some other metrics of production per person:
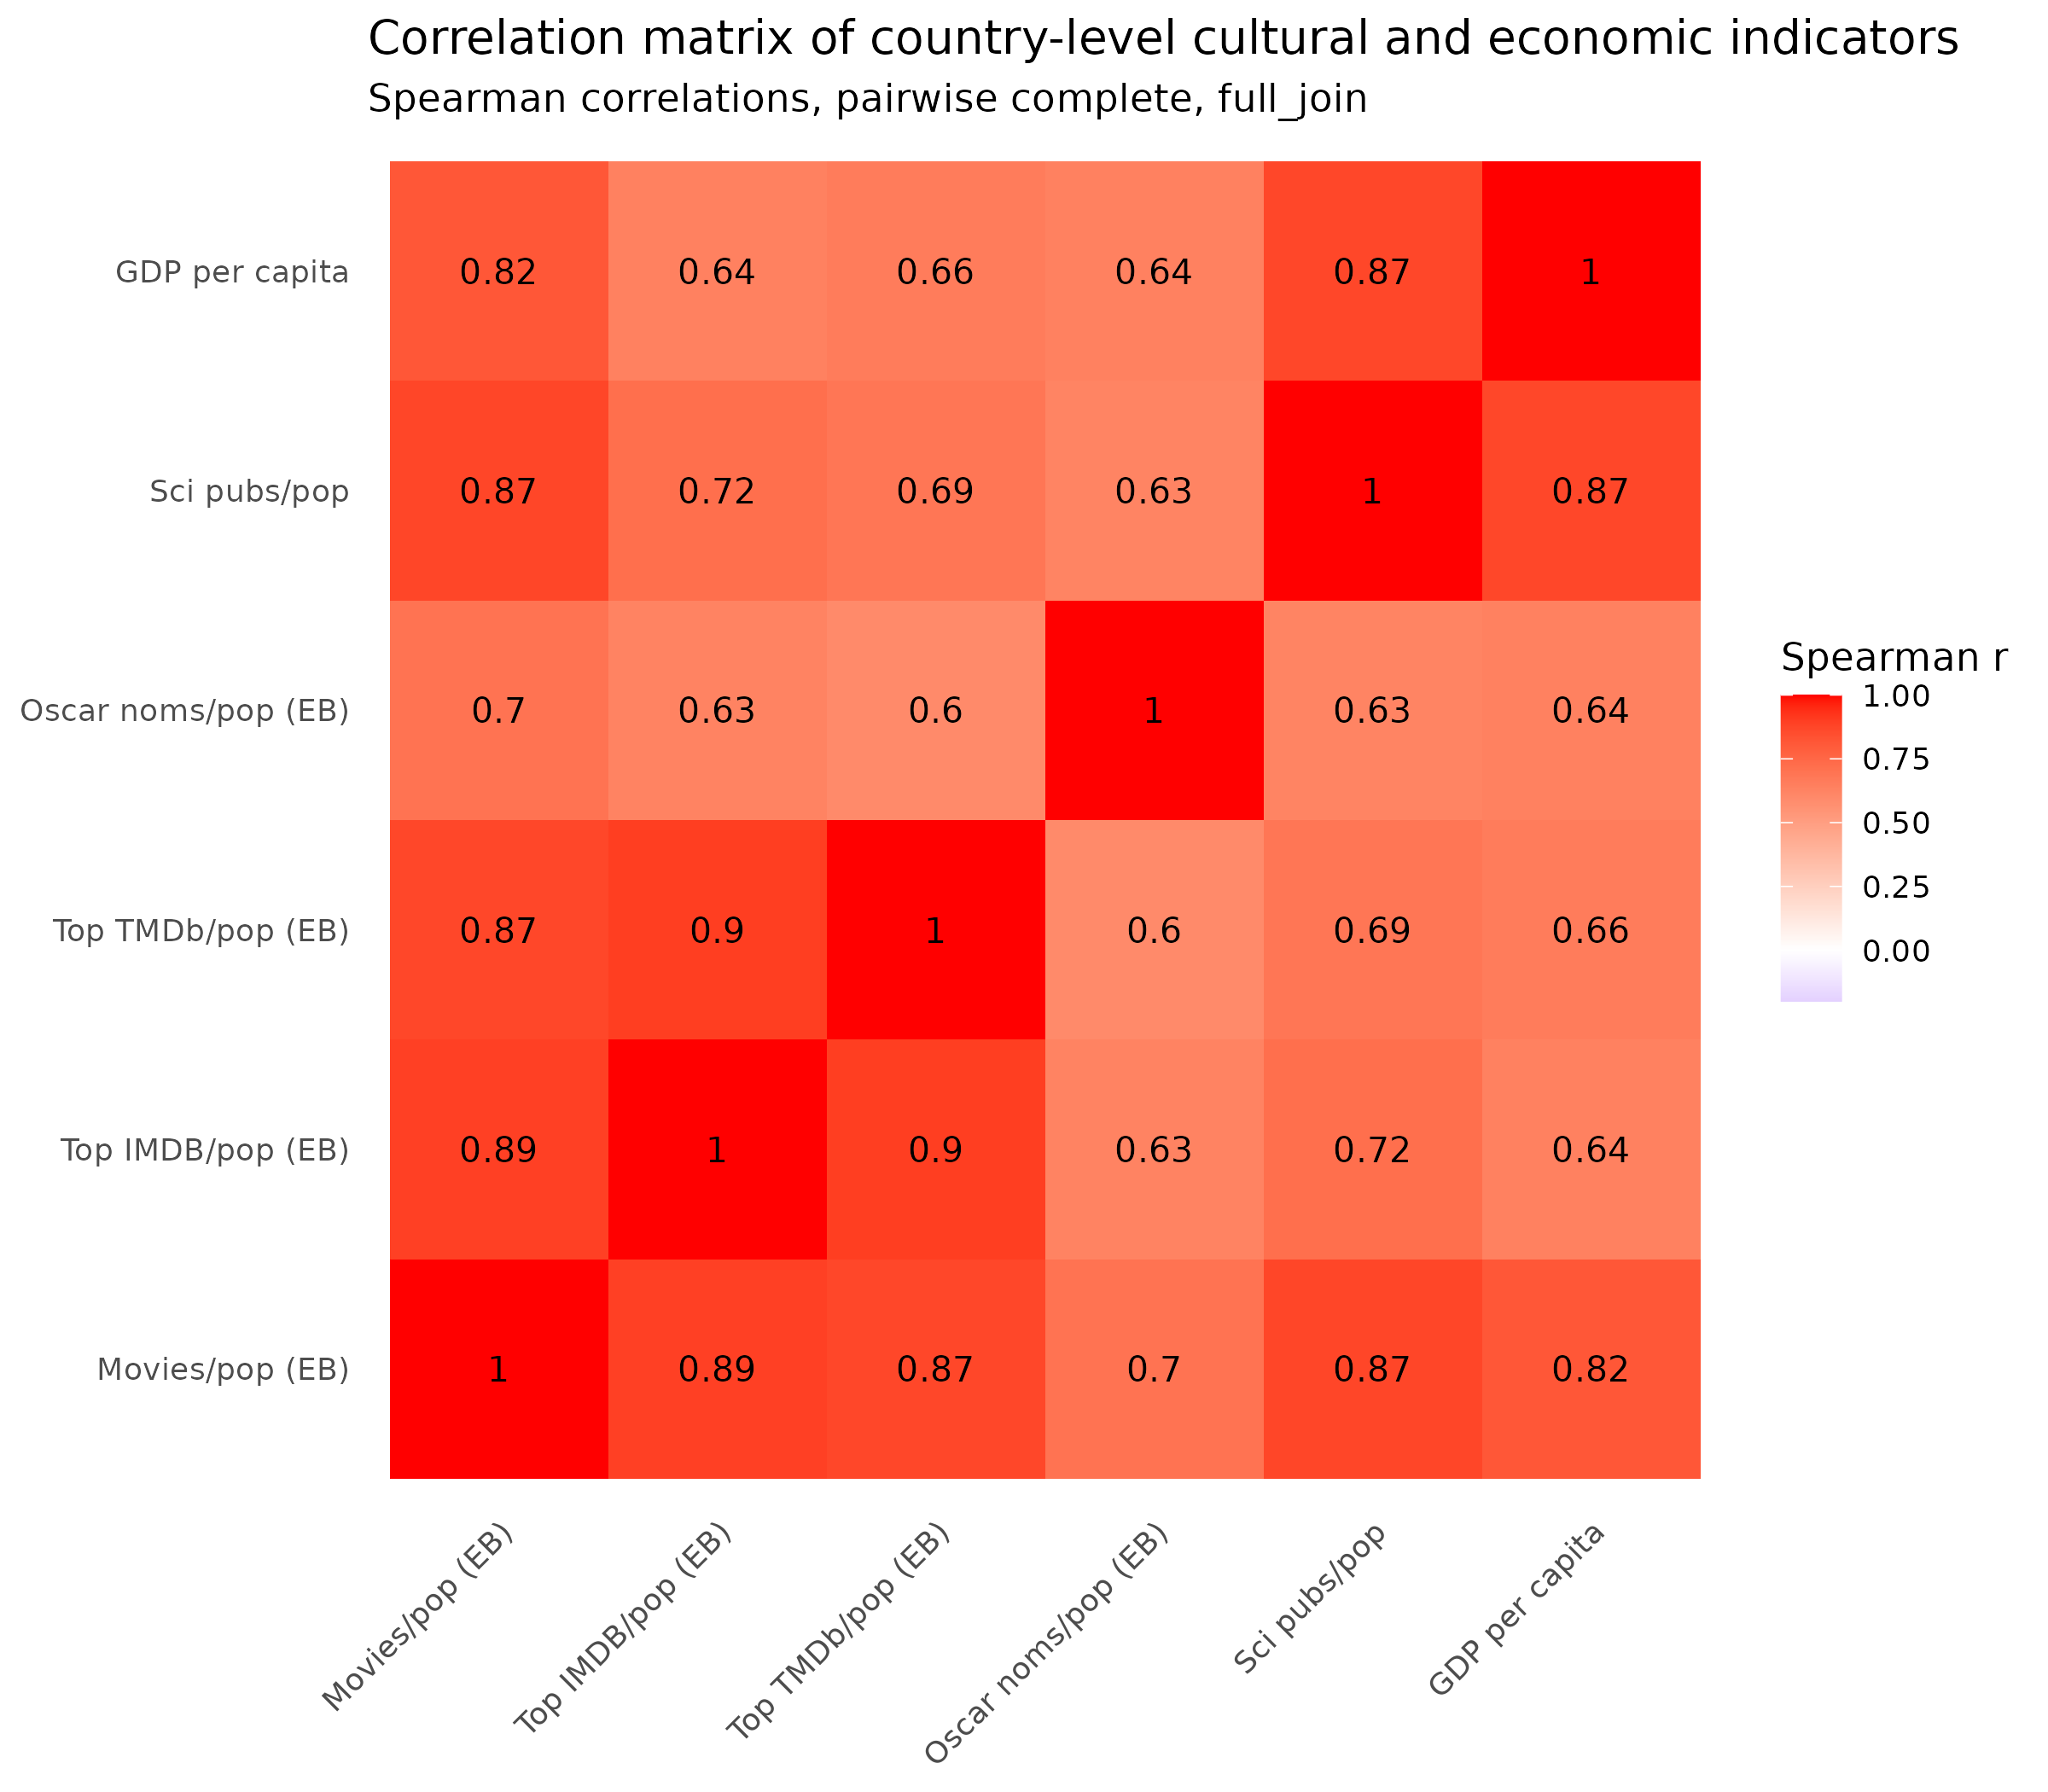
Judging from the GDP and science production metrics, the best metric is just movies/population. So who makes the most movies that people care about?:
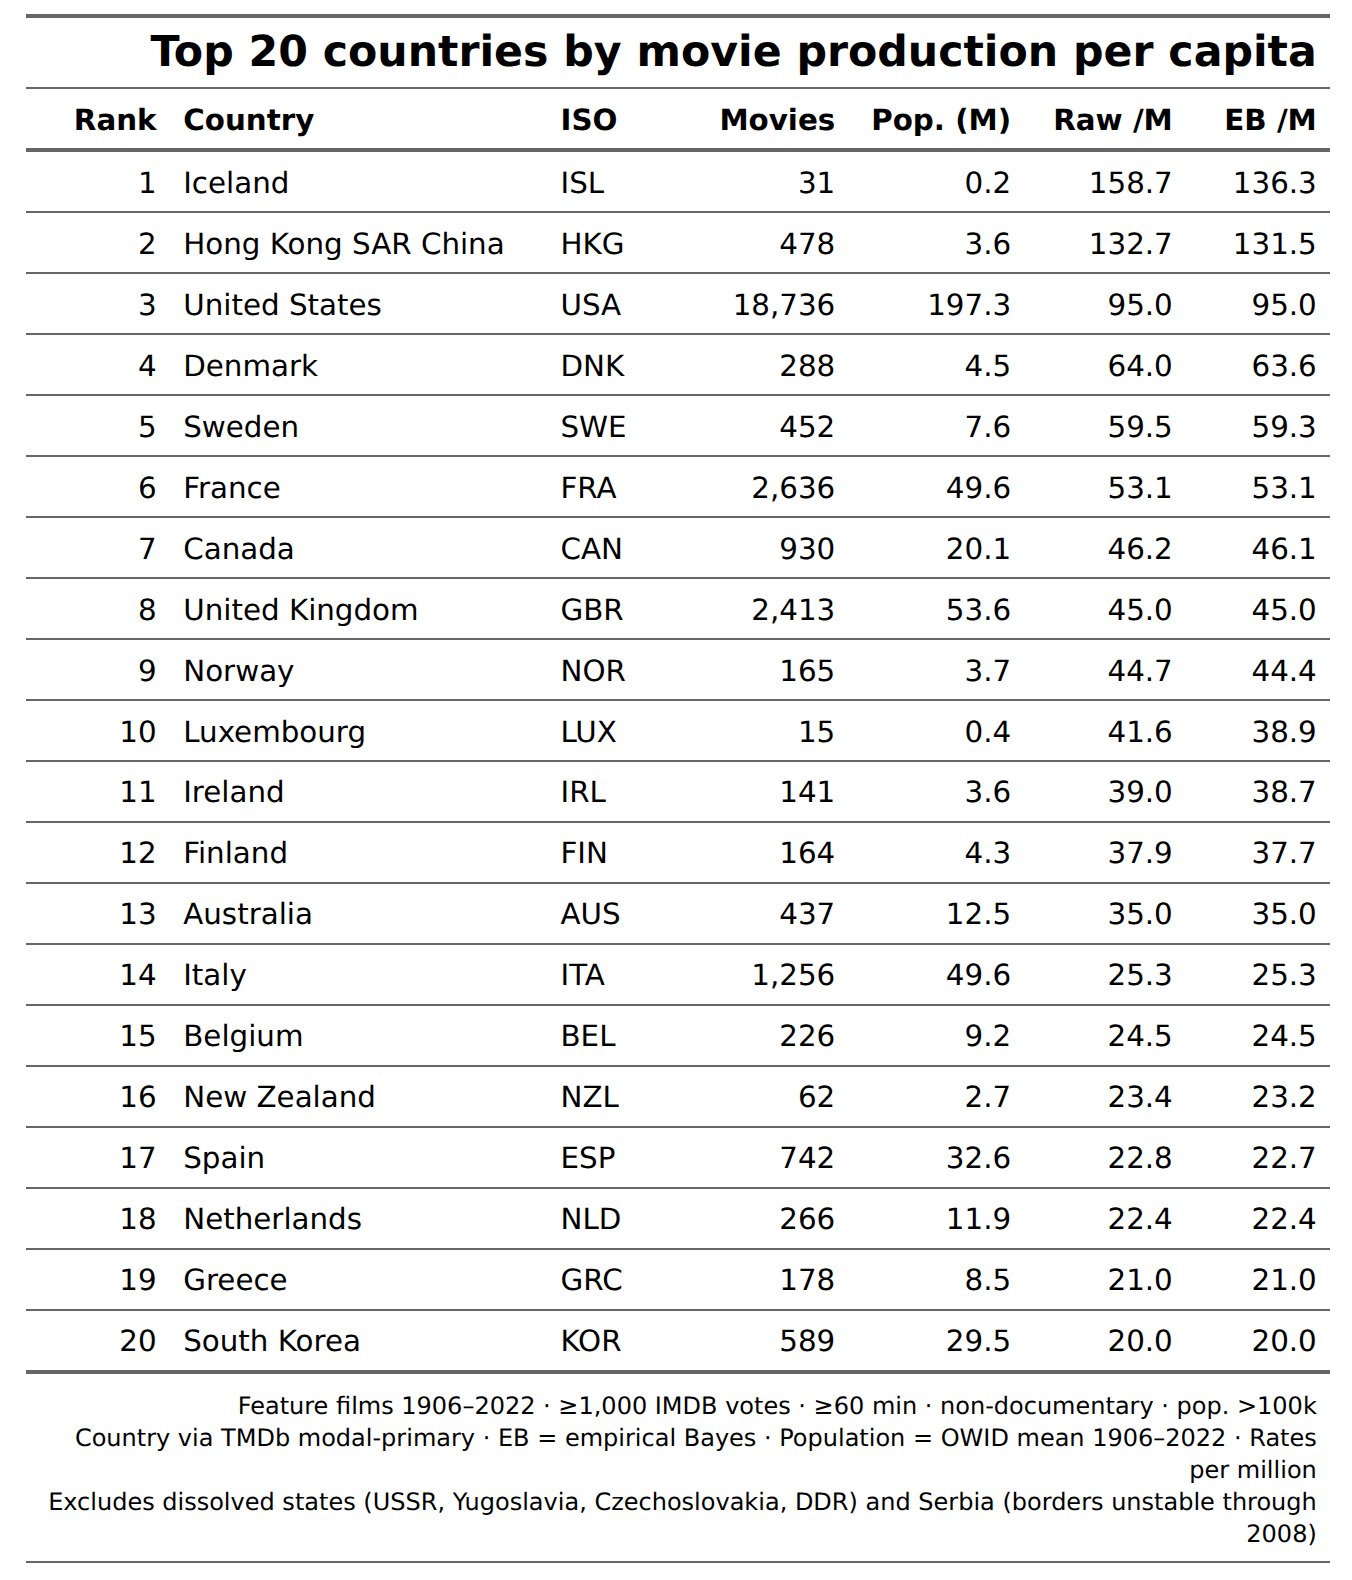
Since the data is from an American website, presumably it has some bias towards USA and Anglo world in general, but generally we see roughly the expected patterns: Nordics in top, Anglos high. Hong Kong had a holden age of movies, which is why it is so high. Germany is conspicuously missing and this is because of issues related to how to handle the period of split Germany. For simplicity’s sake, I have excluded all countries with unstable borders in the period. Here’s the table for only modern (1990-2022) movies and borders:
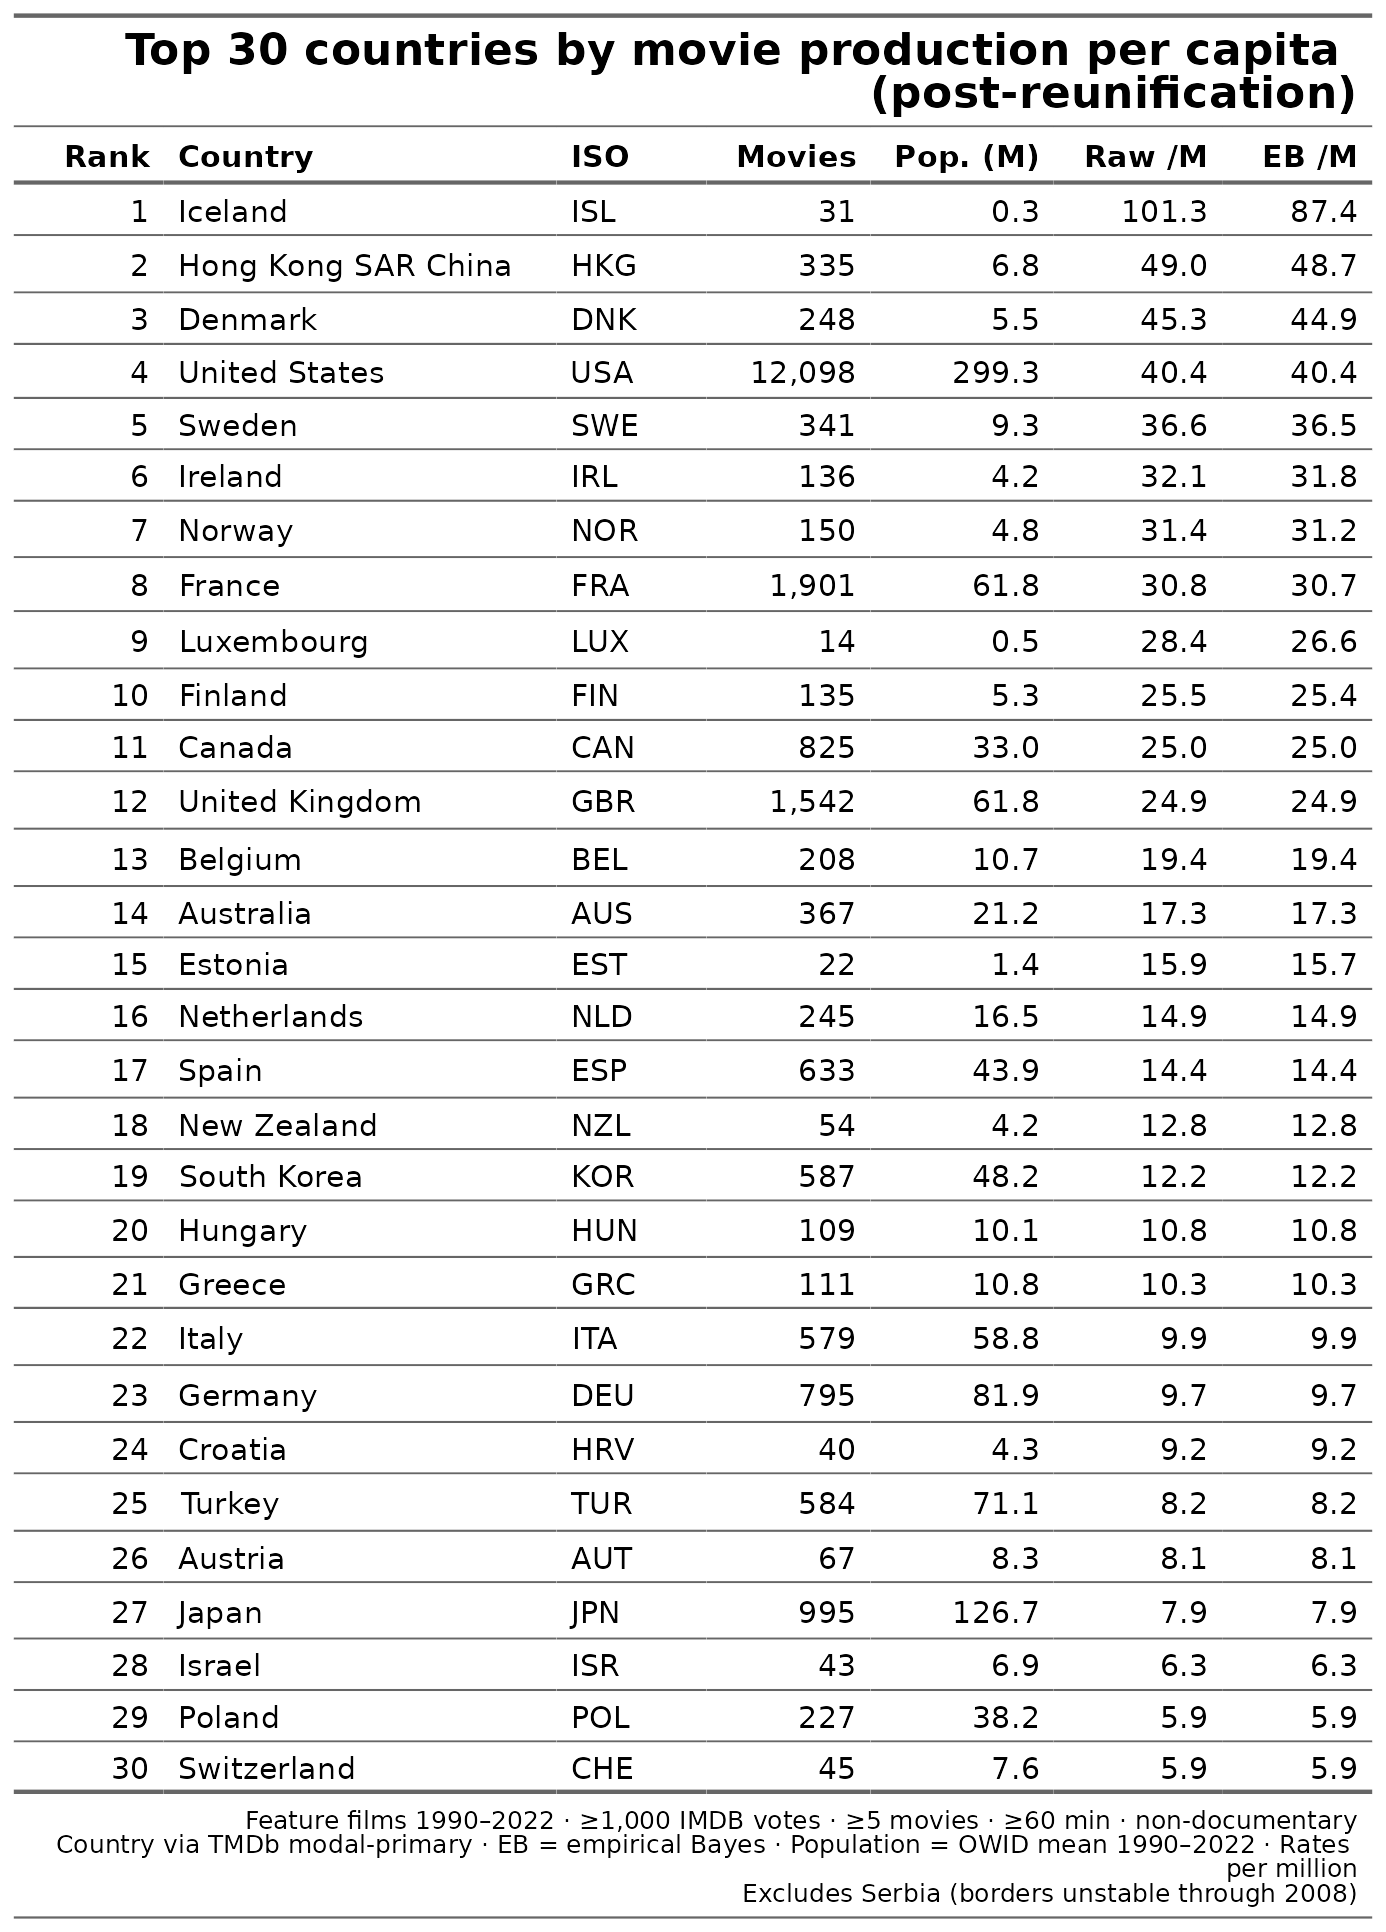
This did not change the picture much, so there was no lingering historical effect of 1950s movies or whatever. In fact, we can also look at the stability of movies per million over time:
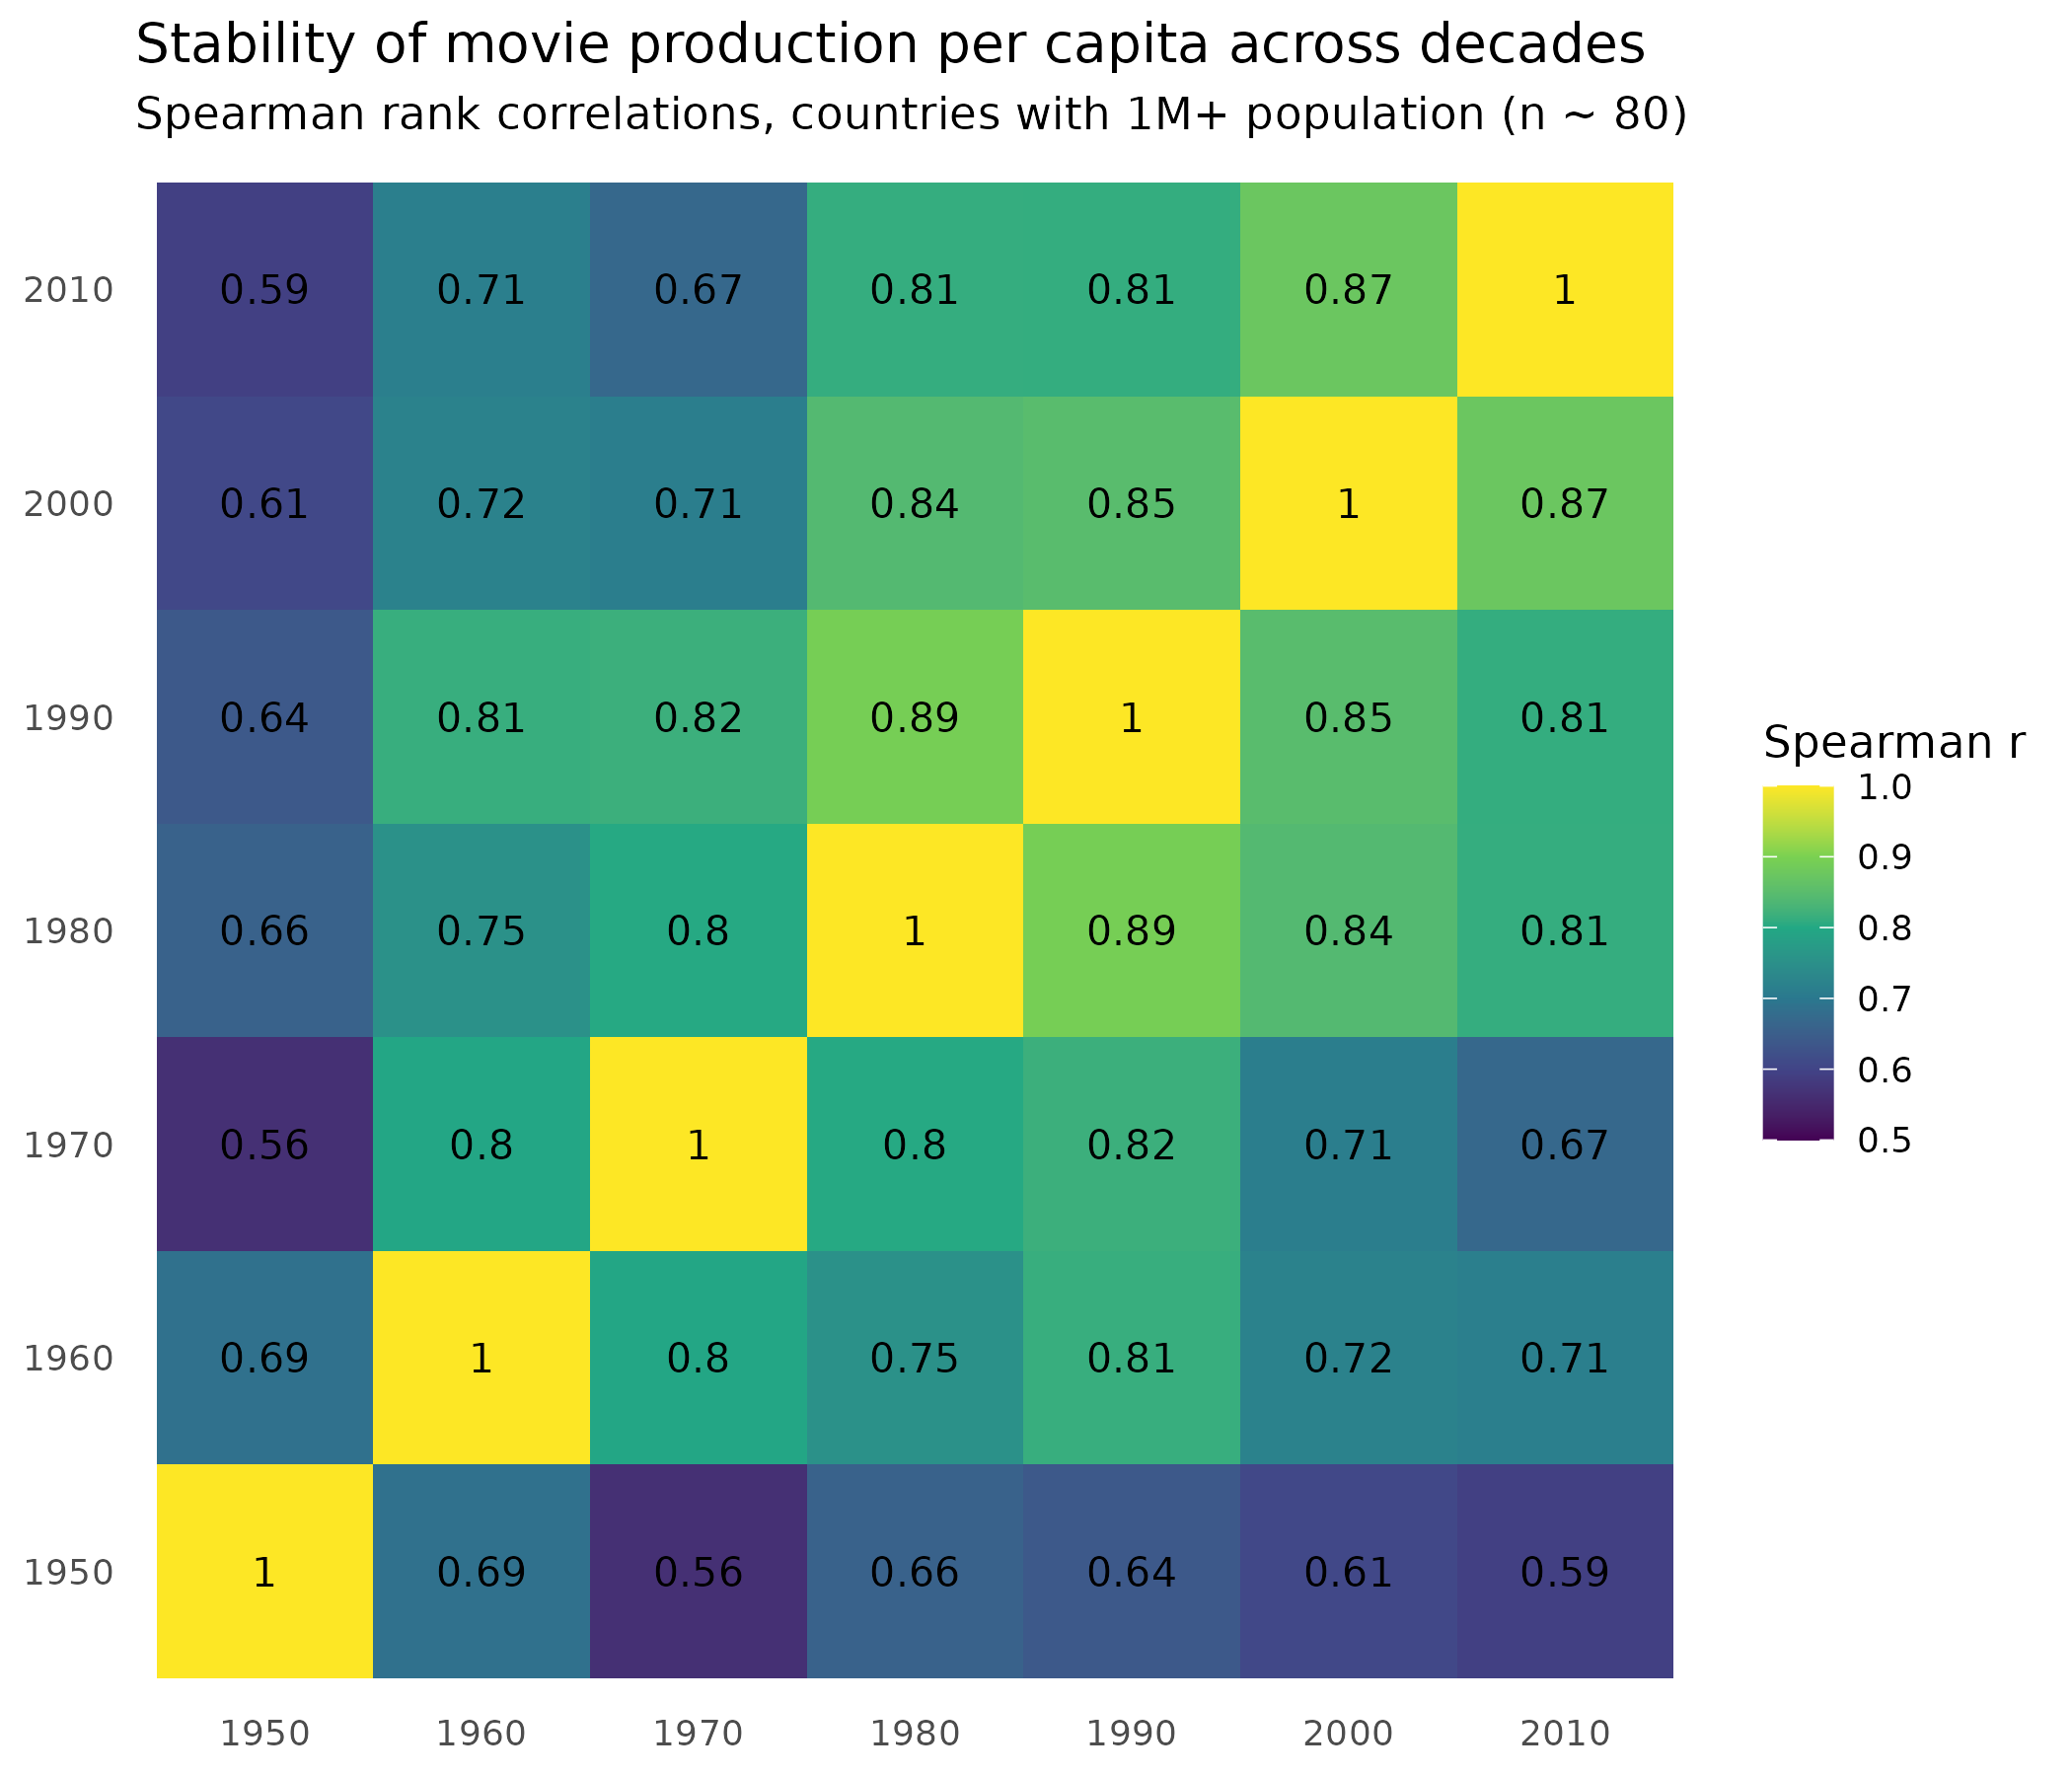
Subsetting to decades makes the estimates more noisy, but we see there is a reasonably level of stability of time, and the correlations show the expected temporal autocorrelation (closer in time = more similar). Estimates for 1950s are very noisy, and there is no point in trying the 1940s and earlier. But still, if you knew who made a lot of movies per population in 1950, you would have a decent idea about which countries it would be in 2010 (r = 0.59).
You may object that including all the movies is misleading, perhaps, about who makes the best movies. But actually in creativity research it has been found that people who generate the most ideas also generate the best ideas. The general way to have great ideas is just to have a lot of them, and discard the bad ones. A study of ~250 American students found that:
We found that higher number of responses on the divergent thinking task was significantly associated with higher creativity (r = 0.73) as independently assessed by three judges.
This principle (equal-odds rule) seems to work the same way in creative thinking testing, science production, and movie production. This might even suggest that AI’s are wildly creative (or will soon be), since they can very quickly generate a lot of ideas. But then again, maybe their mechanisms for generating ideas work differently from humans’.
To answer the question, then, given in the title: we can’t say for sure who makes the best movies per capita, but Nordics do well, some East Asians (S Korean, Japan, HK), Anglos especially USA rank highly, probably somewhat inflated due to the IMDB source. In general, we should probably realize that there is no universal human scale for ranking movies, just like there isn’t one universal human system of morality. In theory, we could gather a world-wide representative sample of people and have them watch the same 100 movies, and get their ratings, and this would tell us the human-wide rating of sorts. I am honestly not sure exactly what this would show.