There are long standing questions about the source of Jewish achievement. Most of this achievement relates to the Ashkenazi subgroup, less so the other Jews. This tells us that the advantage is not likely to be due to special Jewish culture, since this is shared between the various Jewish groups, but almost all the geniuses are from the Ashkenazi subgroup. Nevertheless, perhaps one can posit a special Ashkenazi Jewish culture of learning that the other Jews don’t have, but without this having any underlying genetic causes. It’s a typical environment of the gaps approach. To investigate the idea of genetic causation, the two most straightforward ideas are:
- Admixture regression: does % Jewish ancestry predict intelligence and achievement?
- Polygenic scores: do Jews have higher polygenic scores for intelligence and its proxy, education?
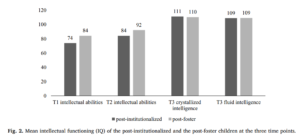
There are a few studies using the 2nd method, all of which show that Ashkenazis have higher than European average polygenic scores. As far as I know, the first such study was the 2019 study by Dunkel et al (including myself). It used a relatively small sample of American Jews (53) inside a larger sample from 1950s Wisconsin (Wisconsin Longitudinal Study, WLS). Still, if the advantage is large enough, it can show up in such small samples and it did:
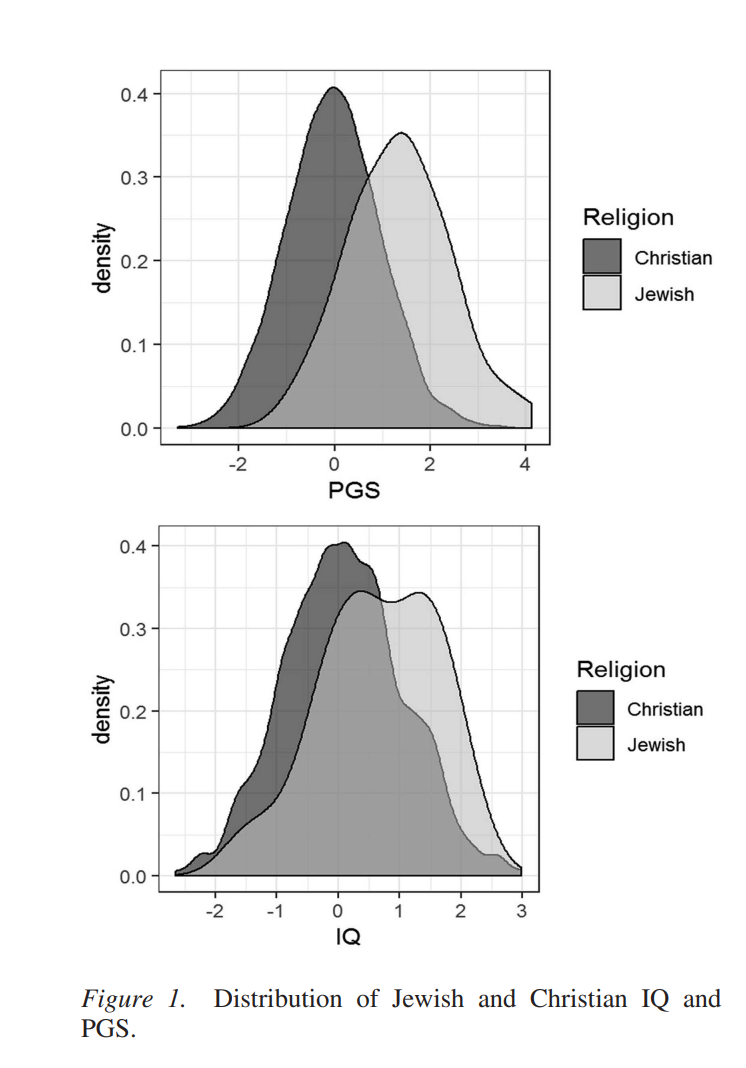
The same year some academics led by Jeremy Freese published a preprint criticizing it, but it appears it was never formally published (nothing wrong with that). Ultimately, the criticism was irrelevant because a much larger dataset of Jewish SNP frequencies became available in the GNOMAD dataset, and it shows the same advantage:
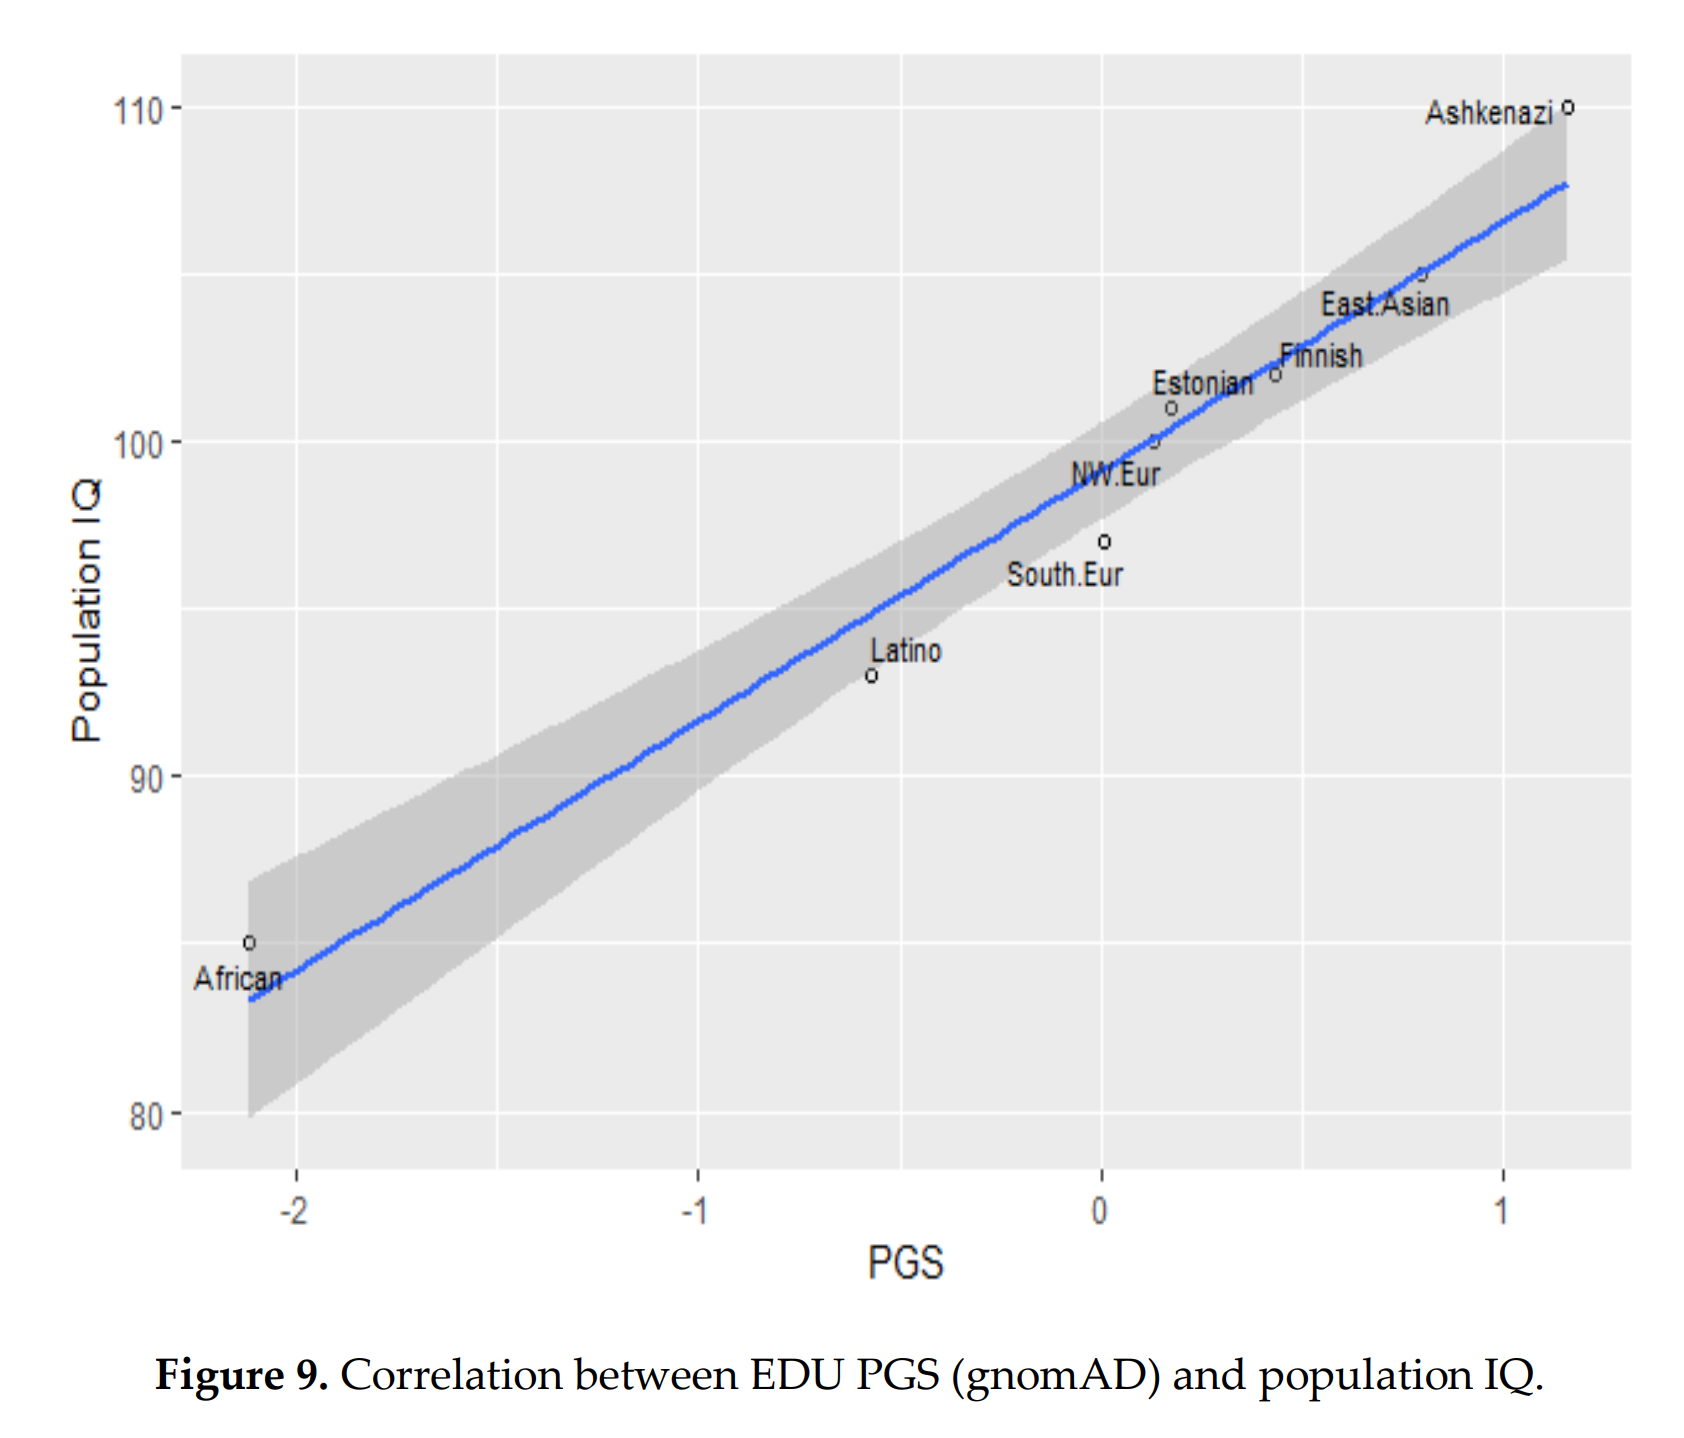
GNOMAD at the time had 145 Jews, so nearly triple the sample size as the WLS. Later, GNOMAD was updated and included 1,736 Jews and Piffer 2023 found these results for education GWAS 3 and 4:
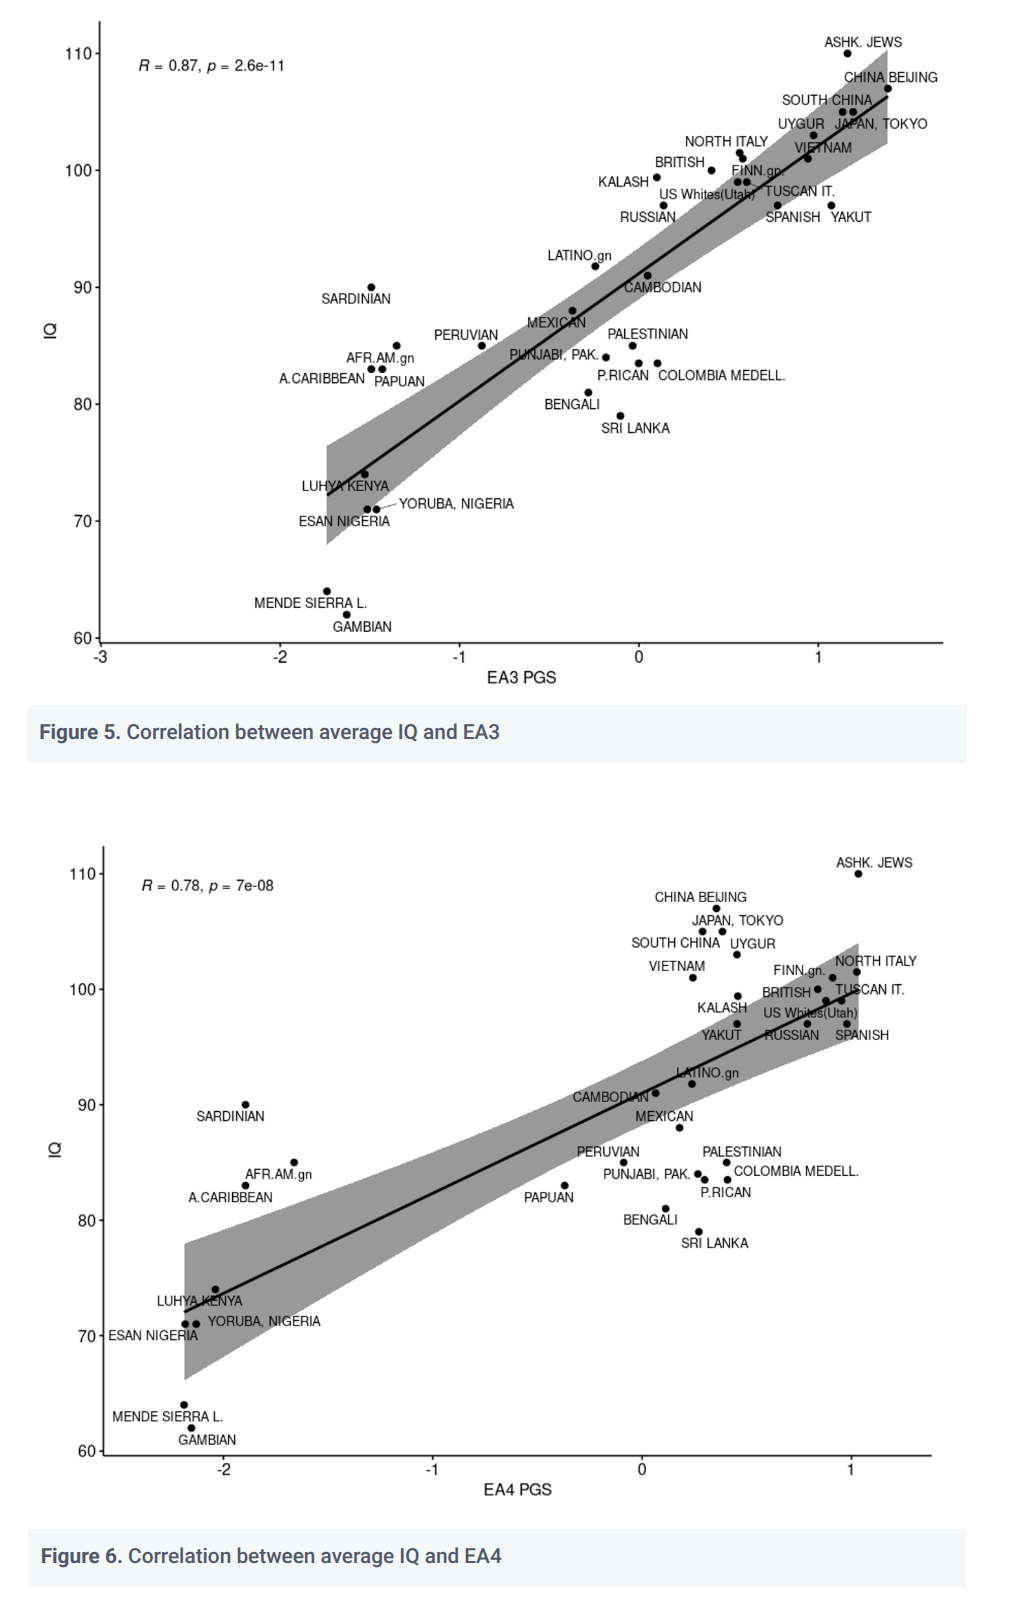
Ashkenazis sit either above the other Europeans (with the East Asians) or at the upper end, depending on EA3 or EA4 being used.
As far as I know, these are all the genetic studies of Jewish intelligence. Honorable mention to the earlier but speculative study A natural history of Ashkenazi intelligence (2006) that started the modern debate.
Today we want to move the science forward a bit by presenting 2 admixture studies. The datasets are the ABCD and PNC, both large US samples. The first is nationally representative and the latter is from the Philadelphia area (east coast). Ancestry was estimated using the Privé 2022 pretrained models which provides estimates for 20 ancestries, including Ashkenazi. IQ was scored the simple way: first factor of good cognitive tests, scaled to 100/15 for Whites. Tests were age adjusted beforehand using splines. Parental education or socioeconomic status was also calculated as an alternative outcome. The main results for ancestries were, with British Whites as reference:
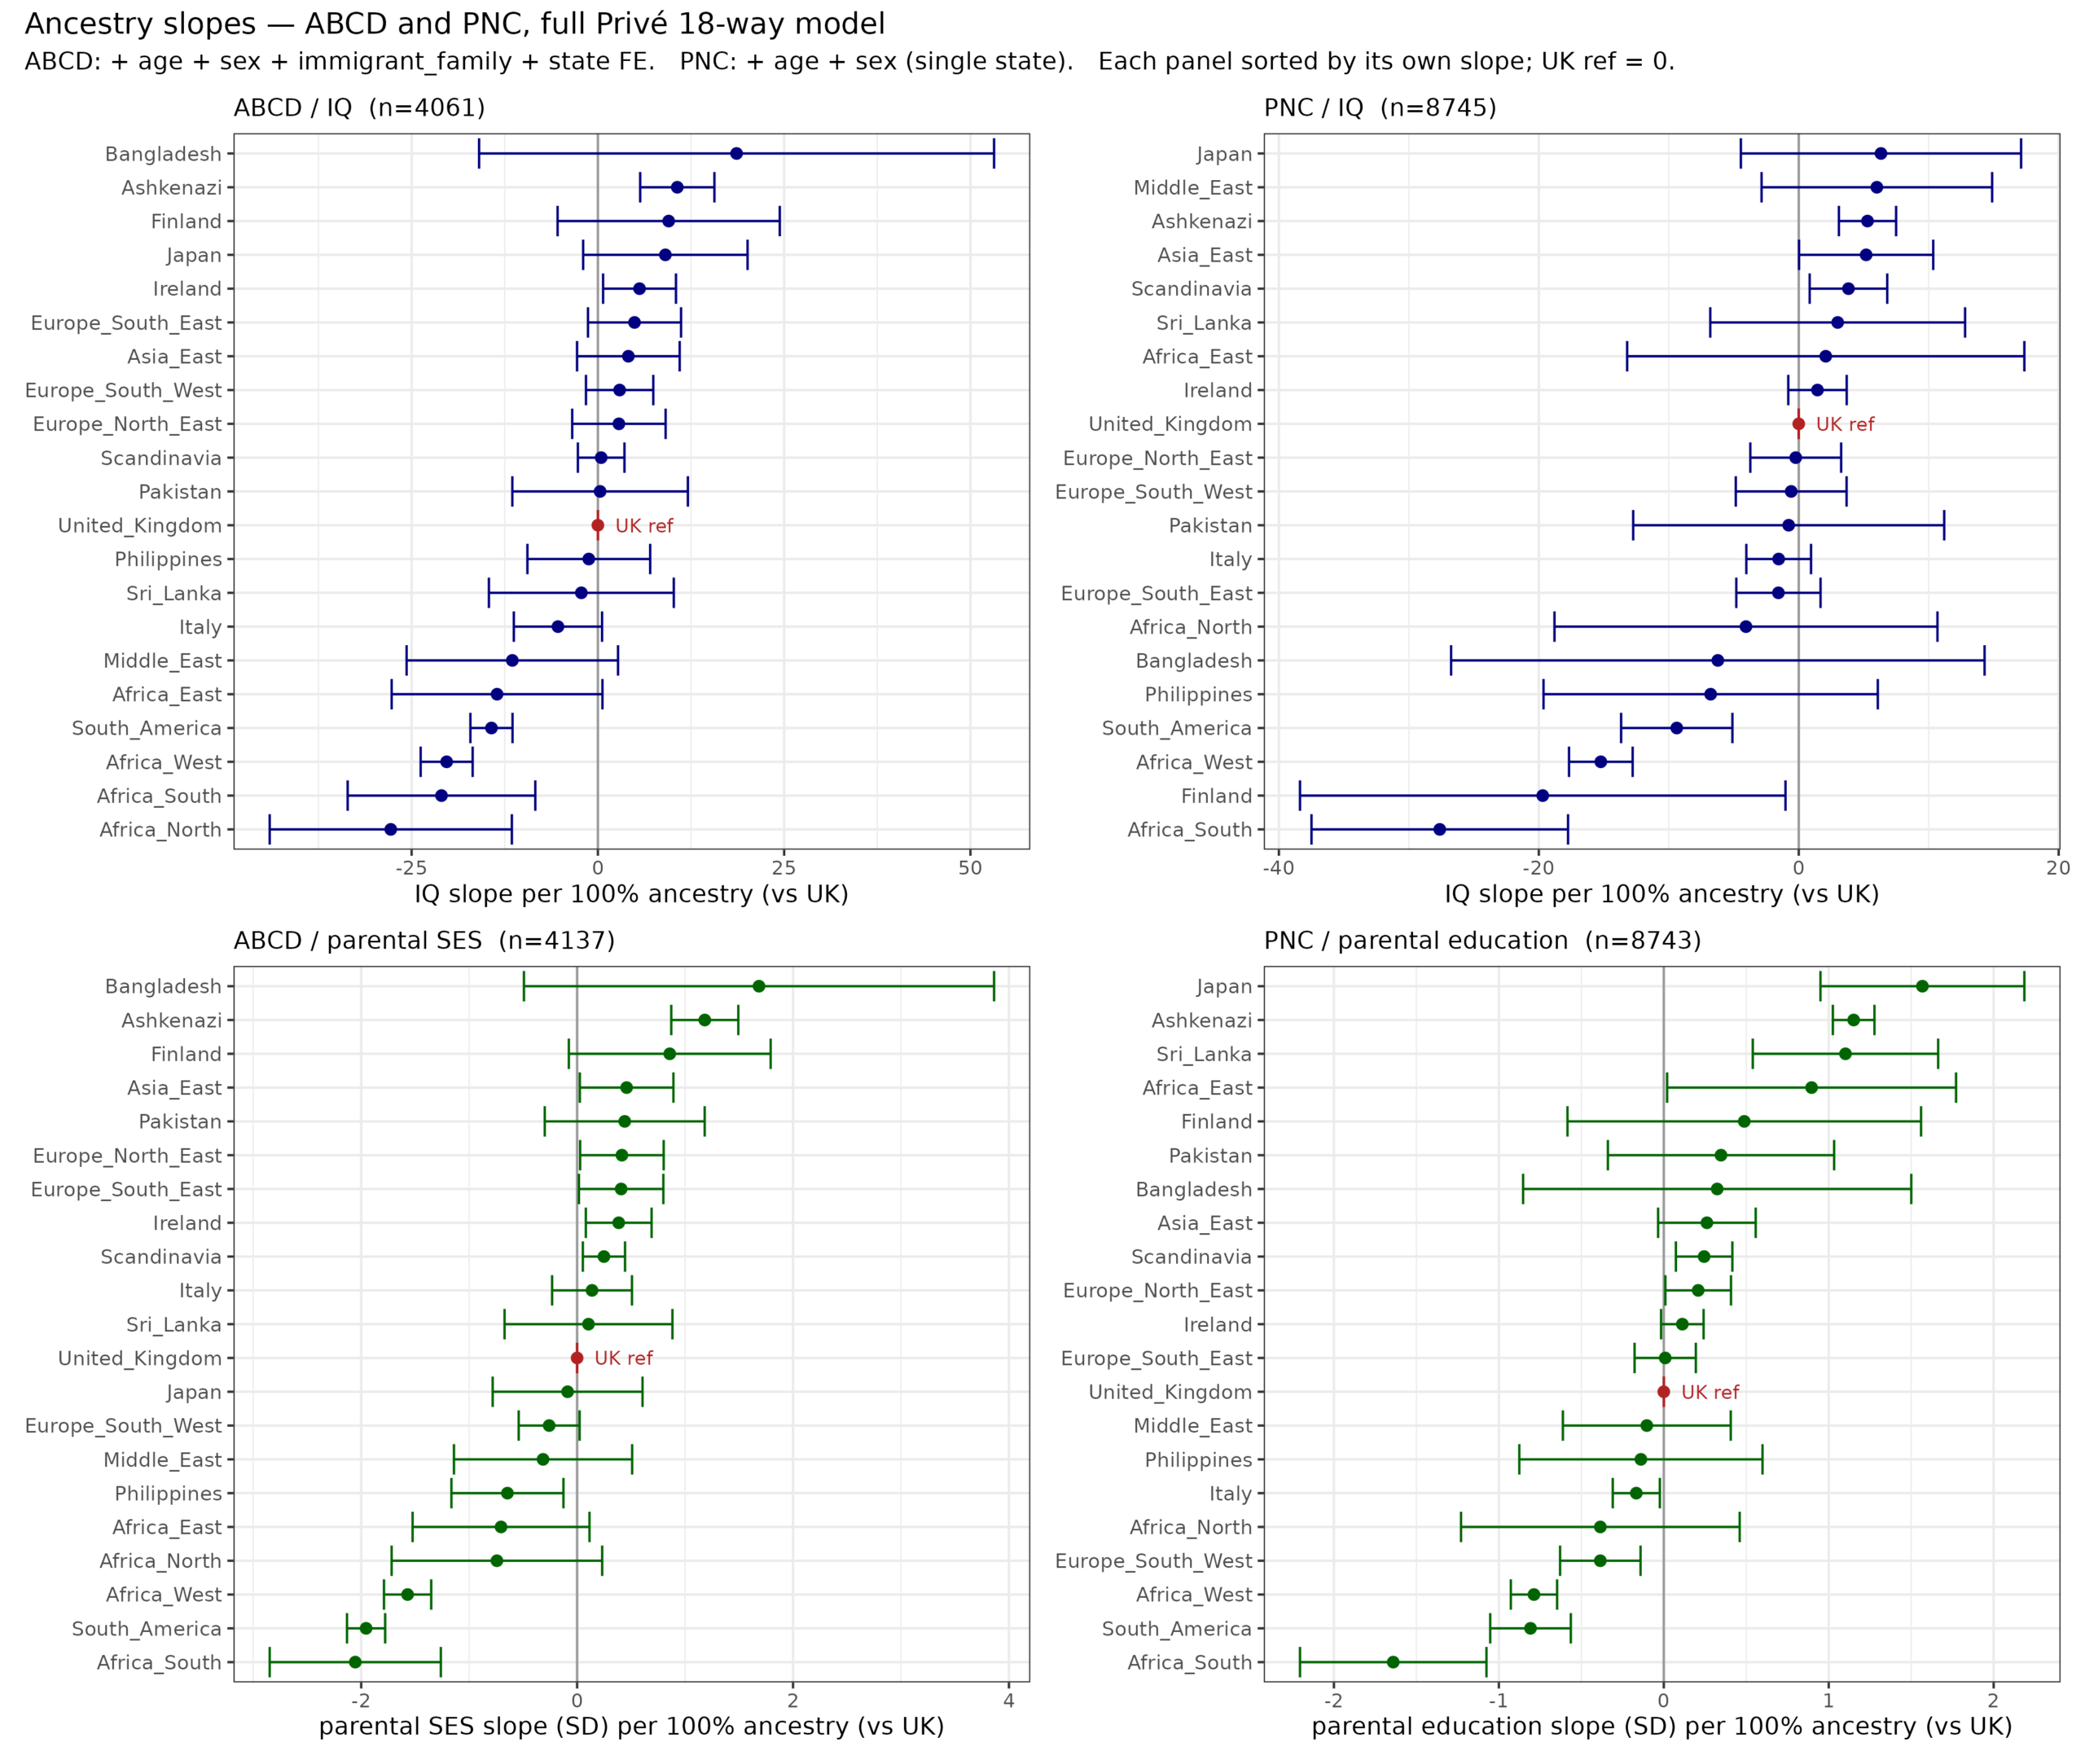
Some groups have very imprecise estimates because there are very few Americans with such ancestries (e.g. Bangladeshi in top left). Given the uncertainties, the results are reasonably consistent:
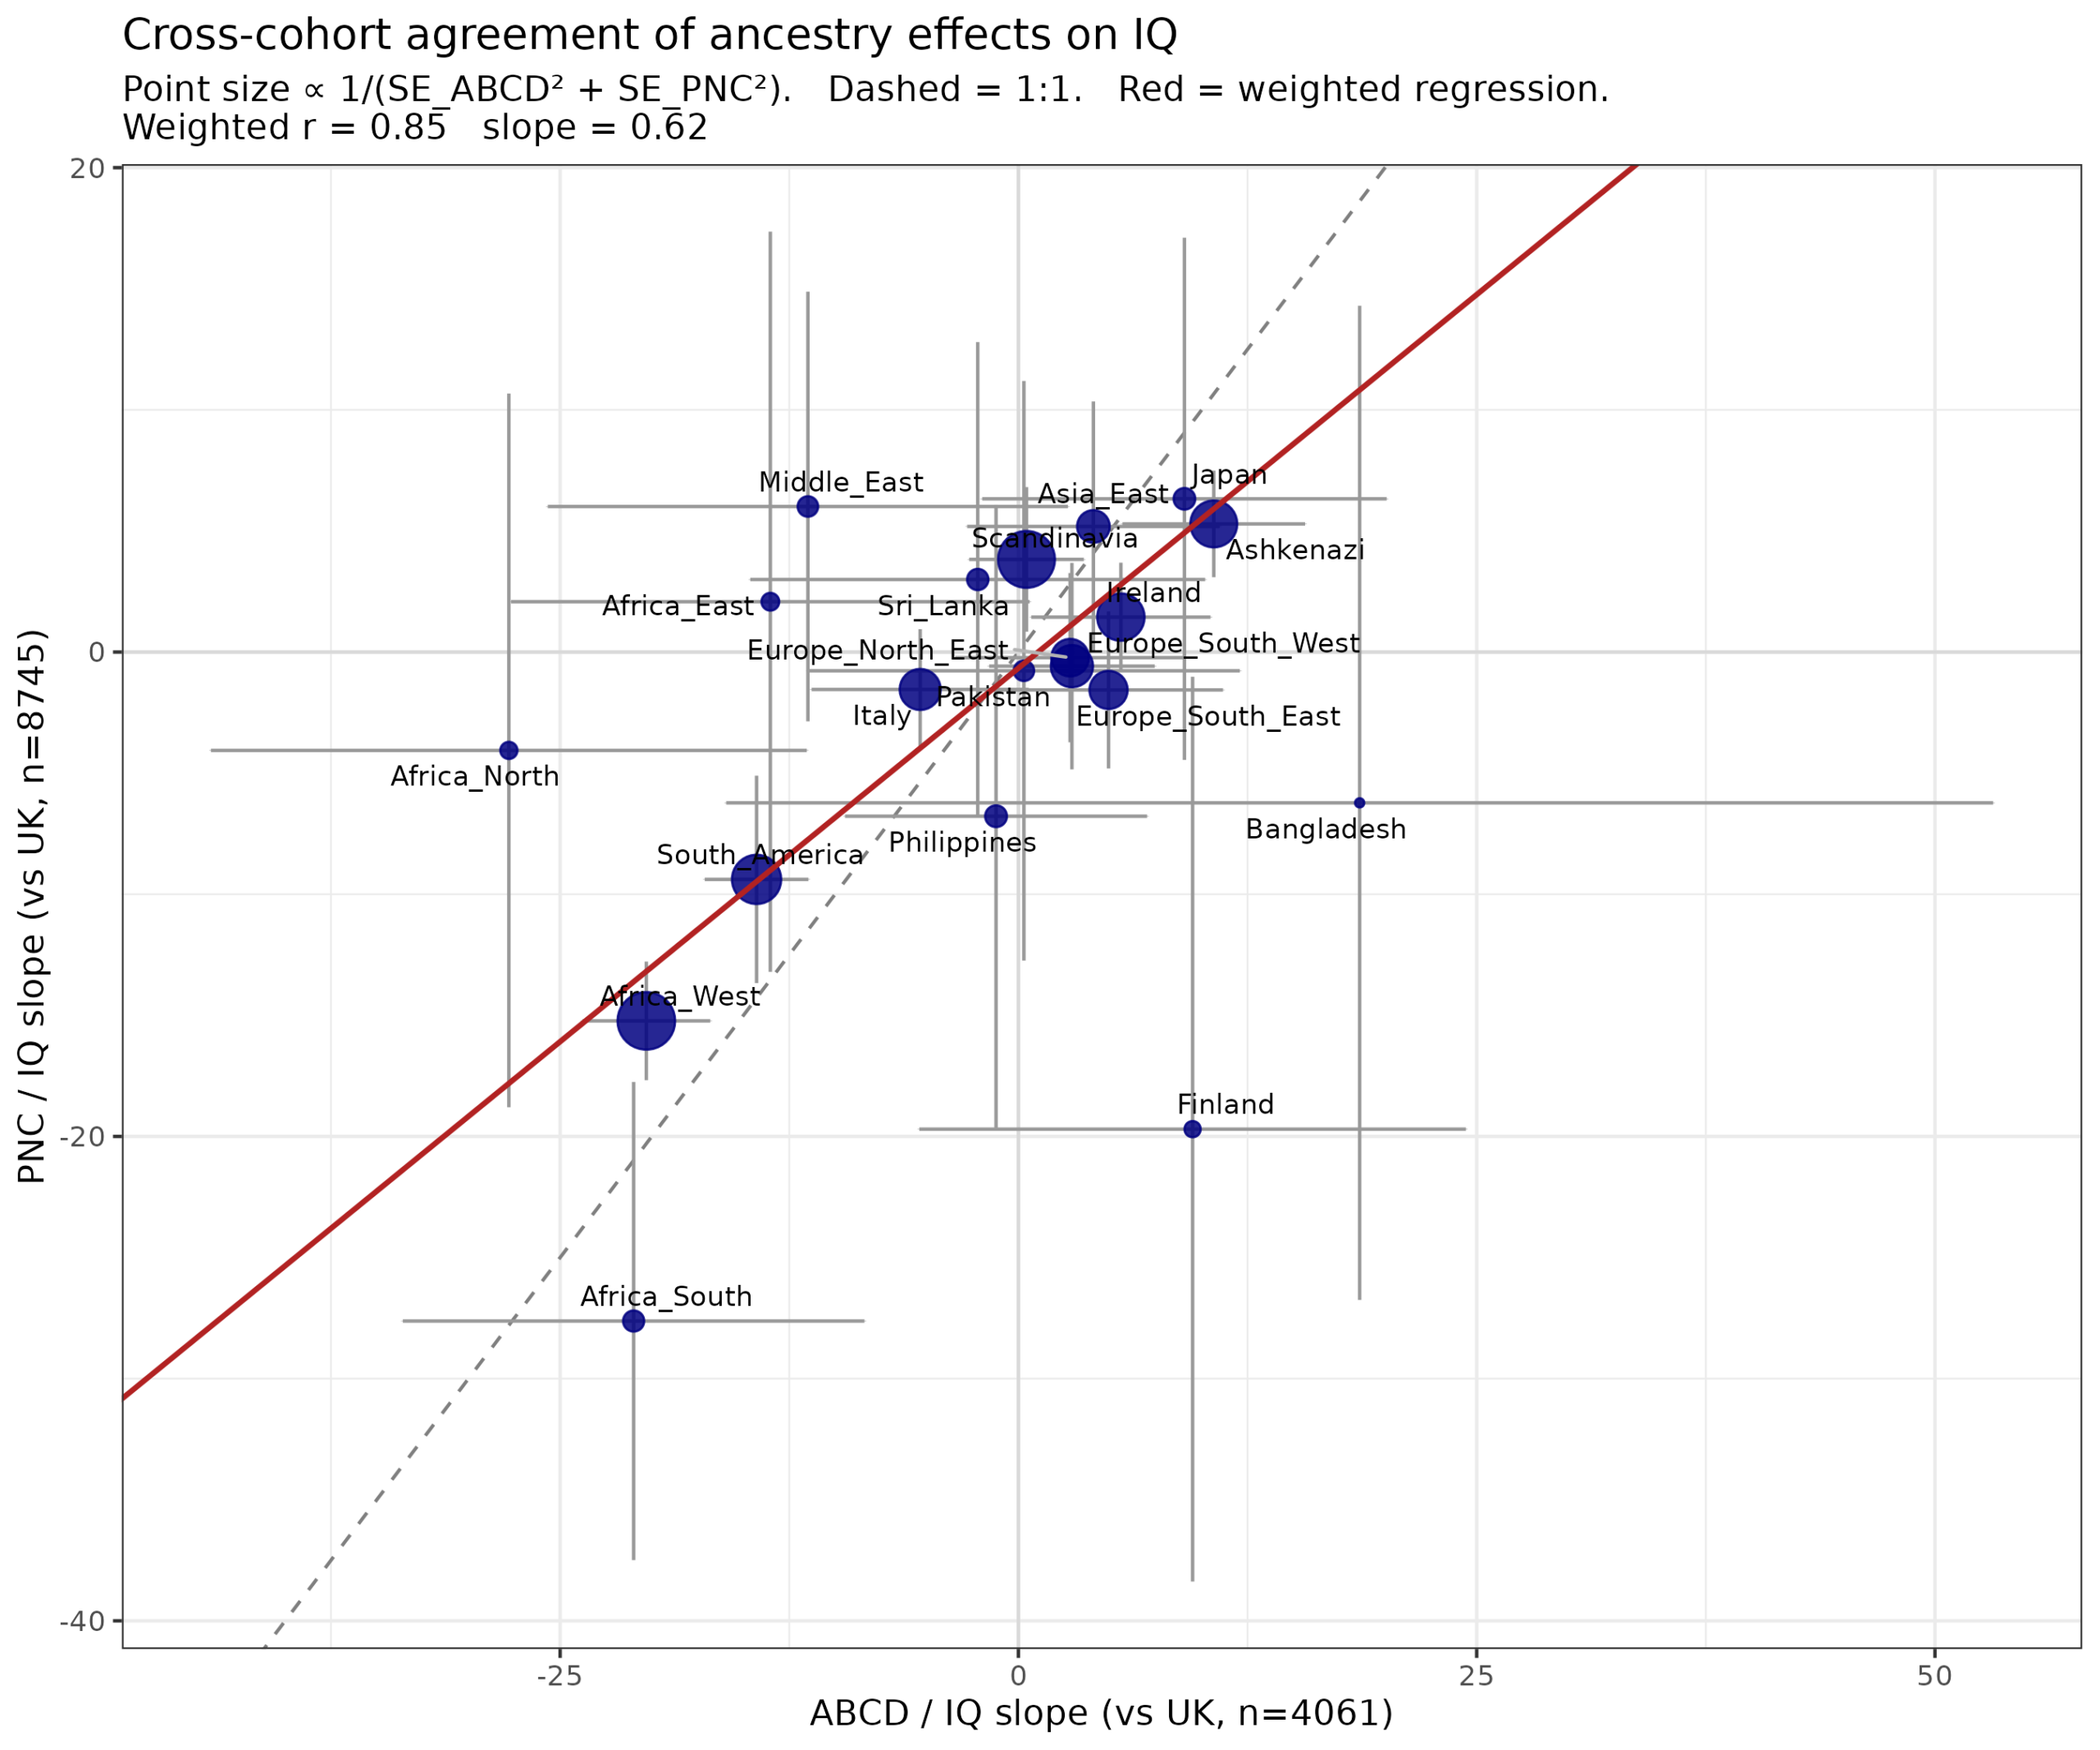
The correlation is not great because many estimates have large errors, but the weighted correlation is 0.85. Attempting an error-corrected estimate is somewhat foolhardy given n=20, but it is 1.21. (Error corrected estimates can exceed 1.00 due to sampling error).
The estimated slopes are similar to our published results using a simpler k=5 model (European, African, Amerindian, East Asian, South Asian) for those ancestries. The Jewish samples aren’t great. There are ~300 Jewish genomes in ABCD and 477 in PNC. These are sums of fractional ancestry, not counts of pure Jews. Of those with 50%+ Jewish ancestry, there are 117 in ABCD and 344 in PNC. This should be sufficient to estimate slopes with some precision. The bigger issue is that there are nonlinear effects:
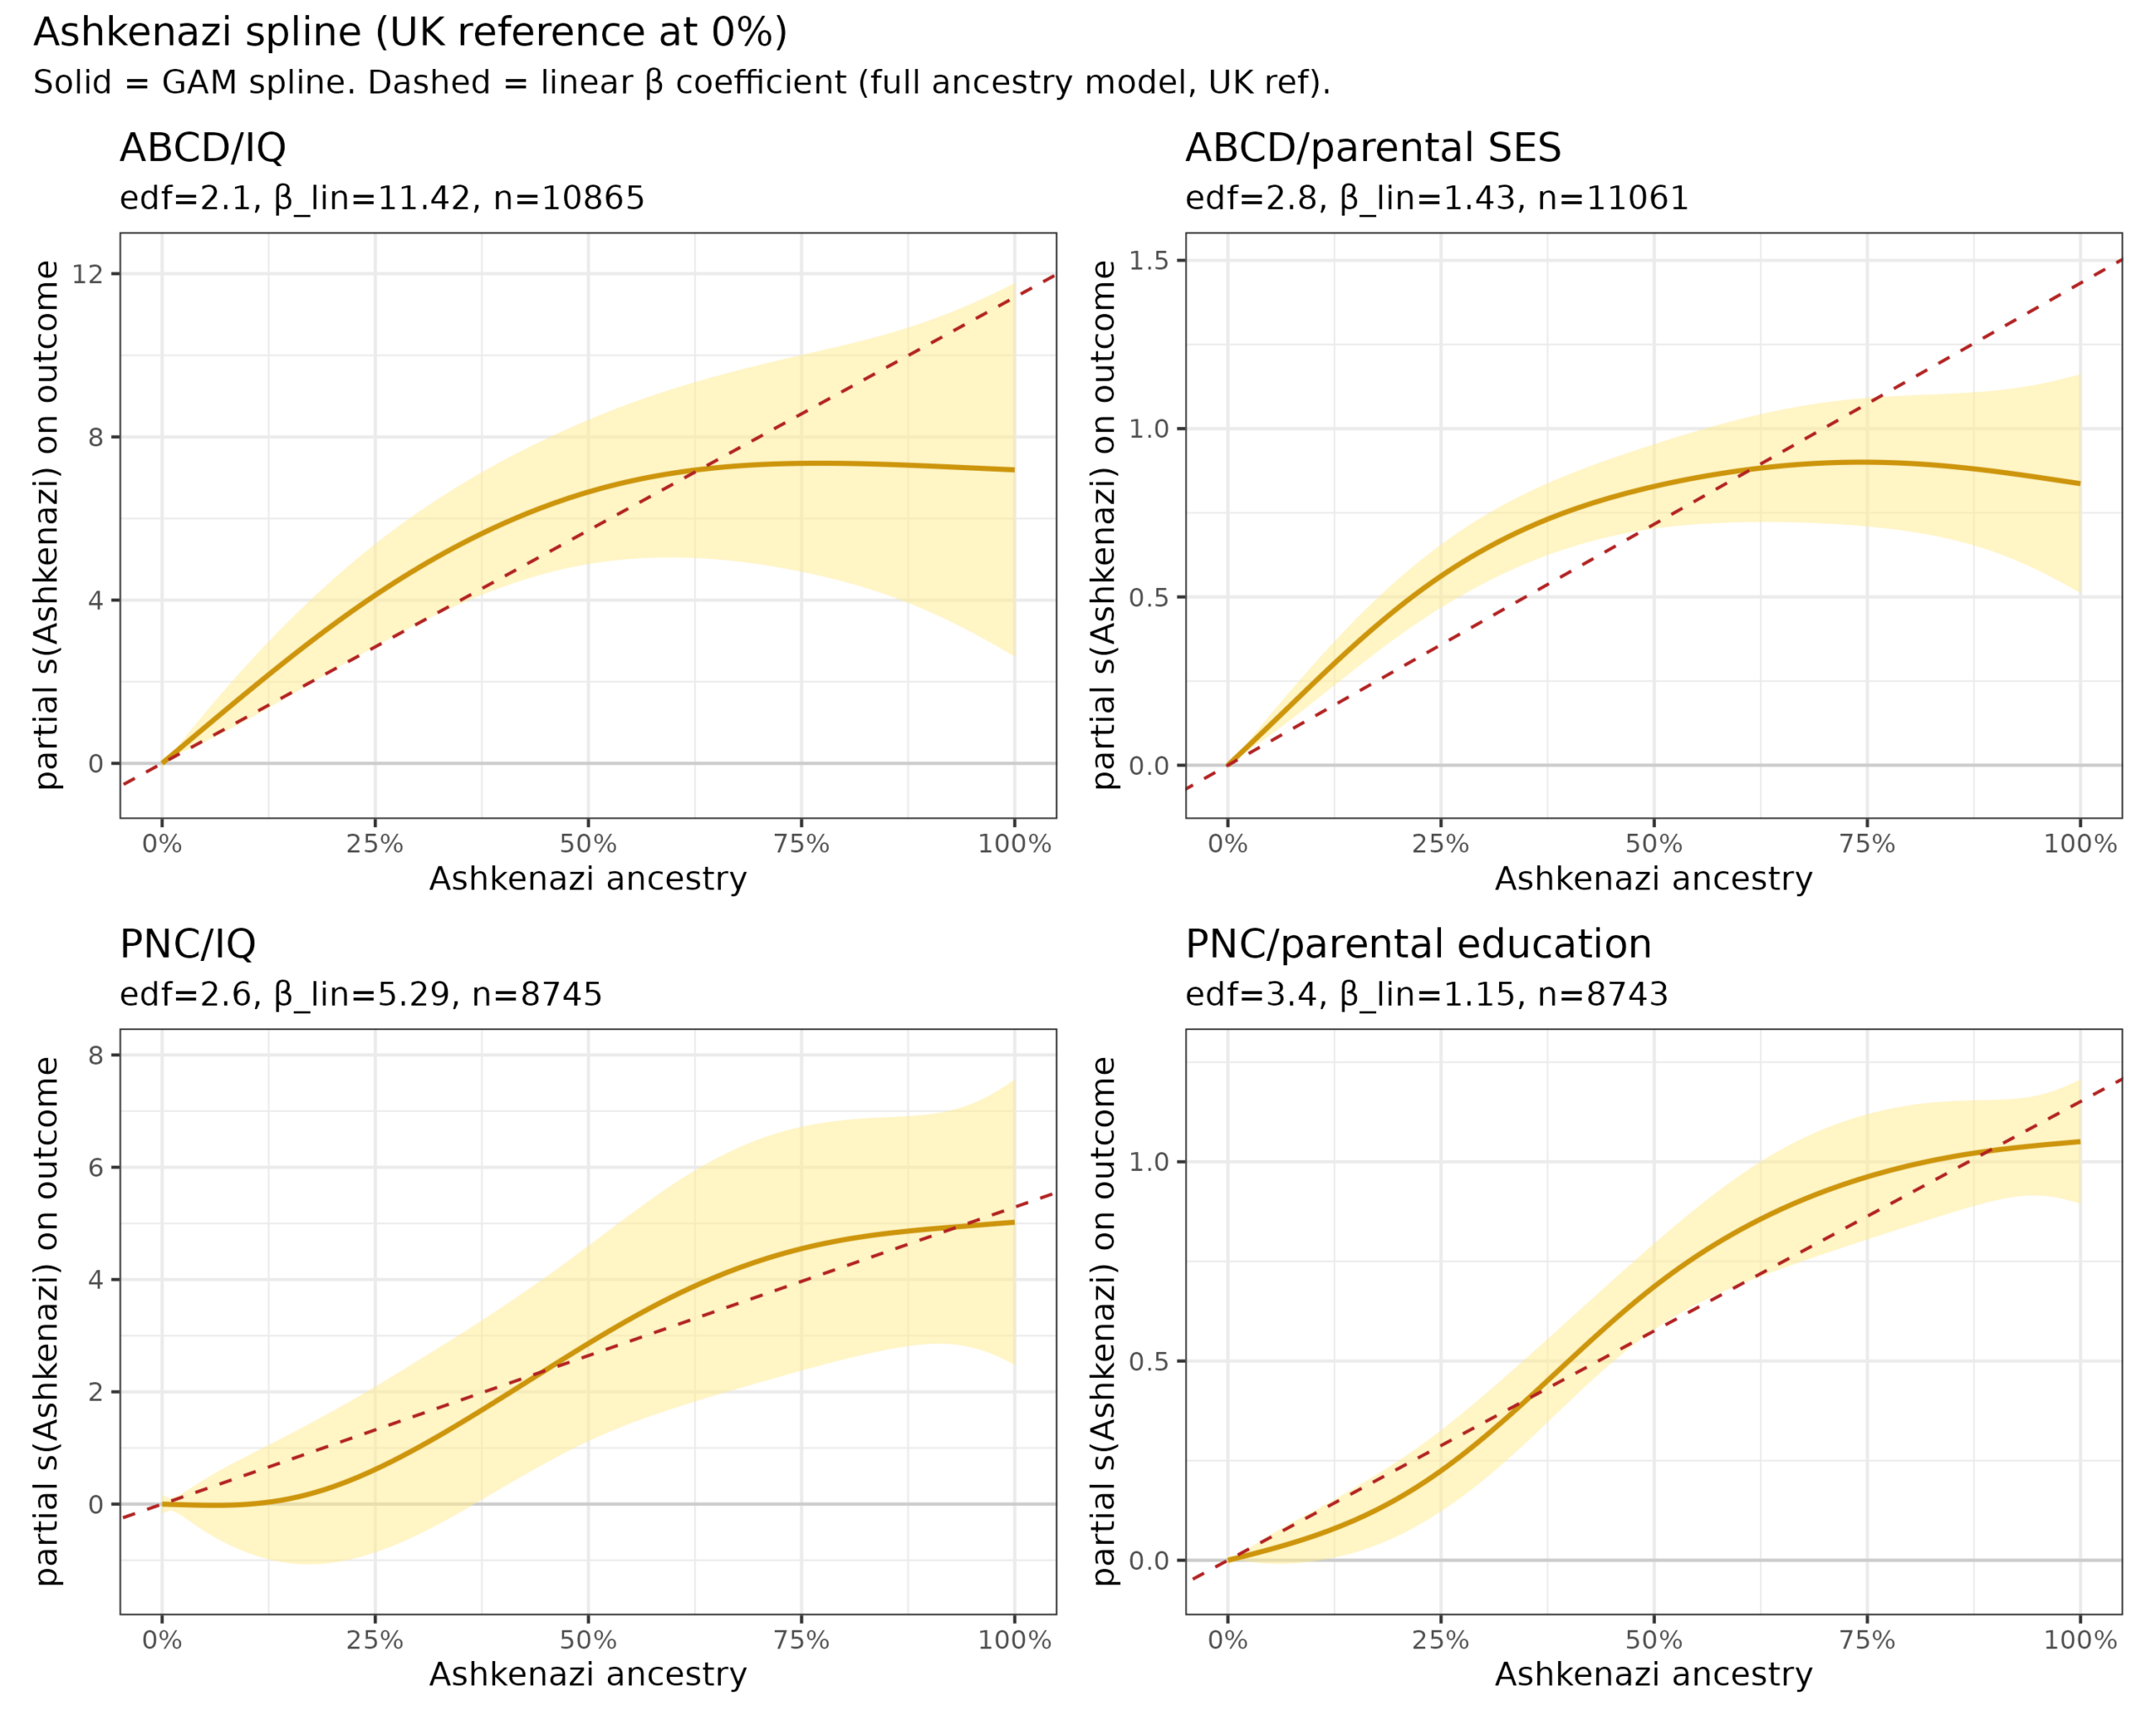
Such nonlinearities can happen due to non-random mating. Among secular Jews, outbreeding has become very common (70% in US, 50% in Europe) and thus many people end up with 50% and later 25% Jewish ancestry. Since the secular Jews are smarter, this creates a nonlinear pattern with a steeper slope from 0 to 50% and weaker from 50 to 100%. The overall slope should be accurate as the average effect of the ancestry though. These two estimates are 11.4 and 5.3 IQ.
There is also a nonlinear effect for West African ancestry:
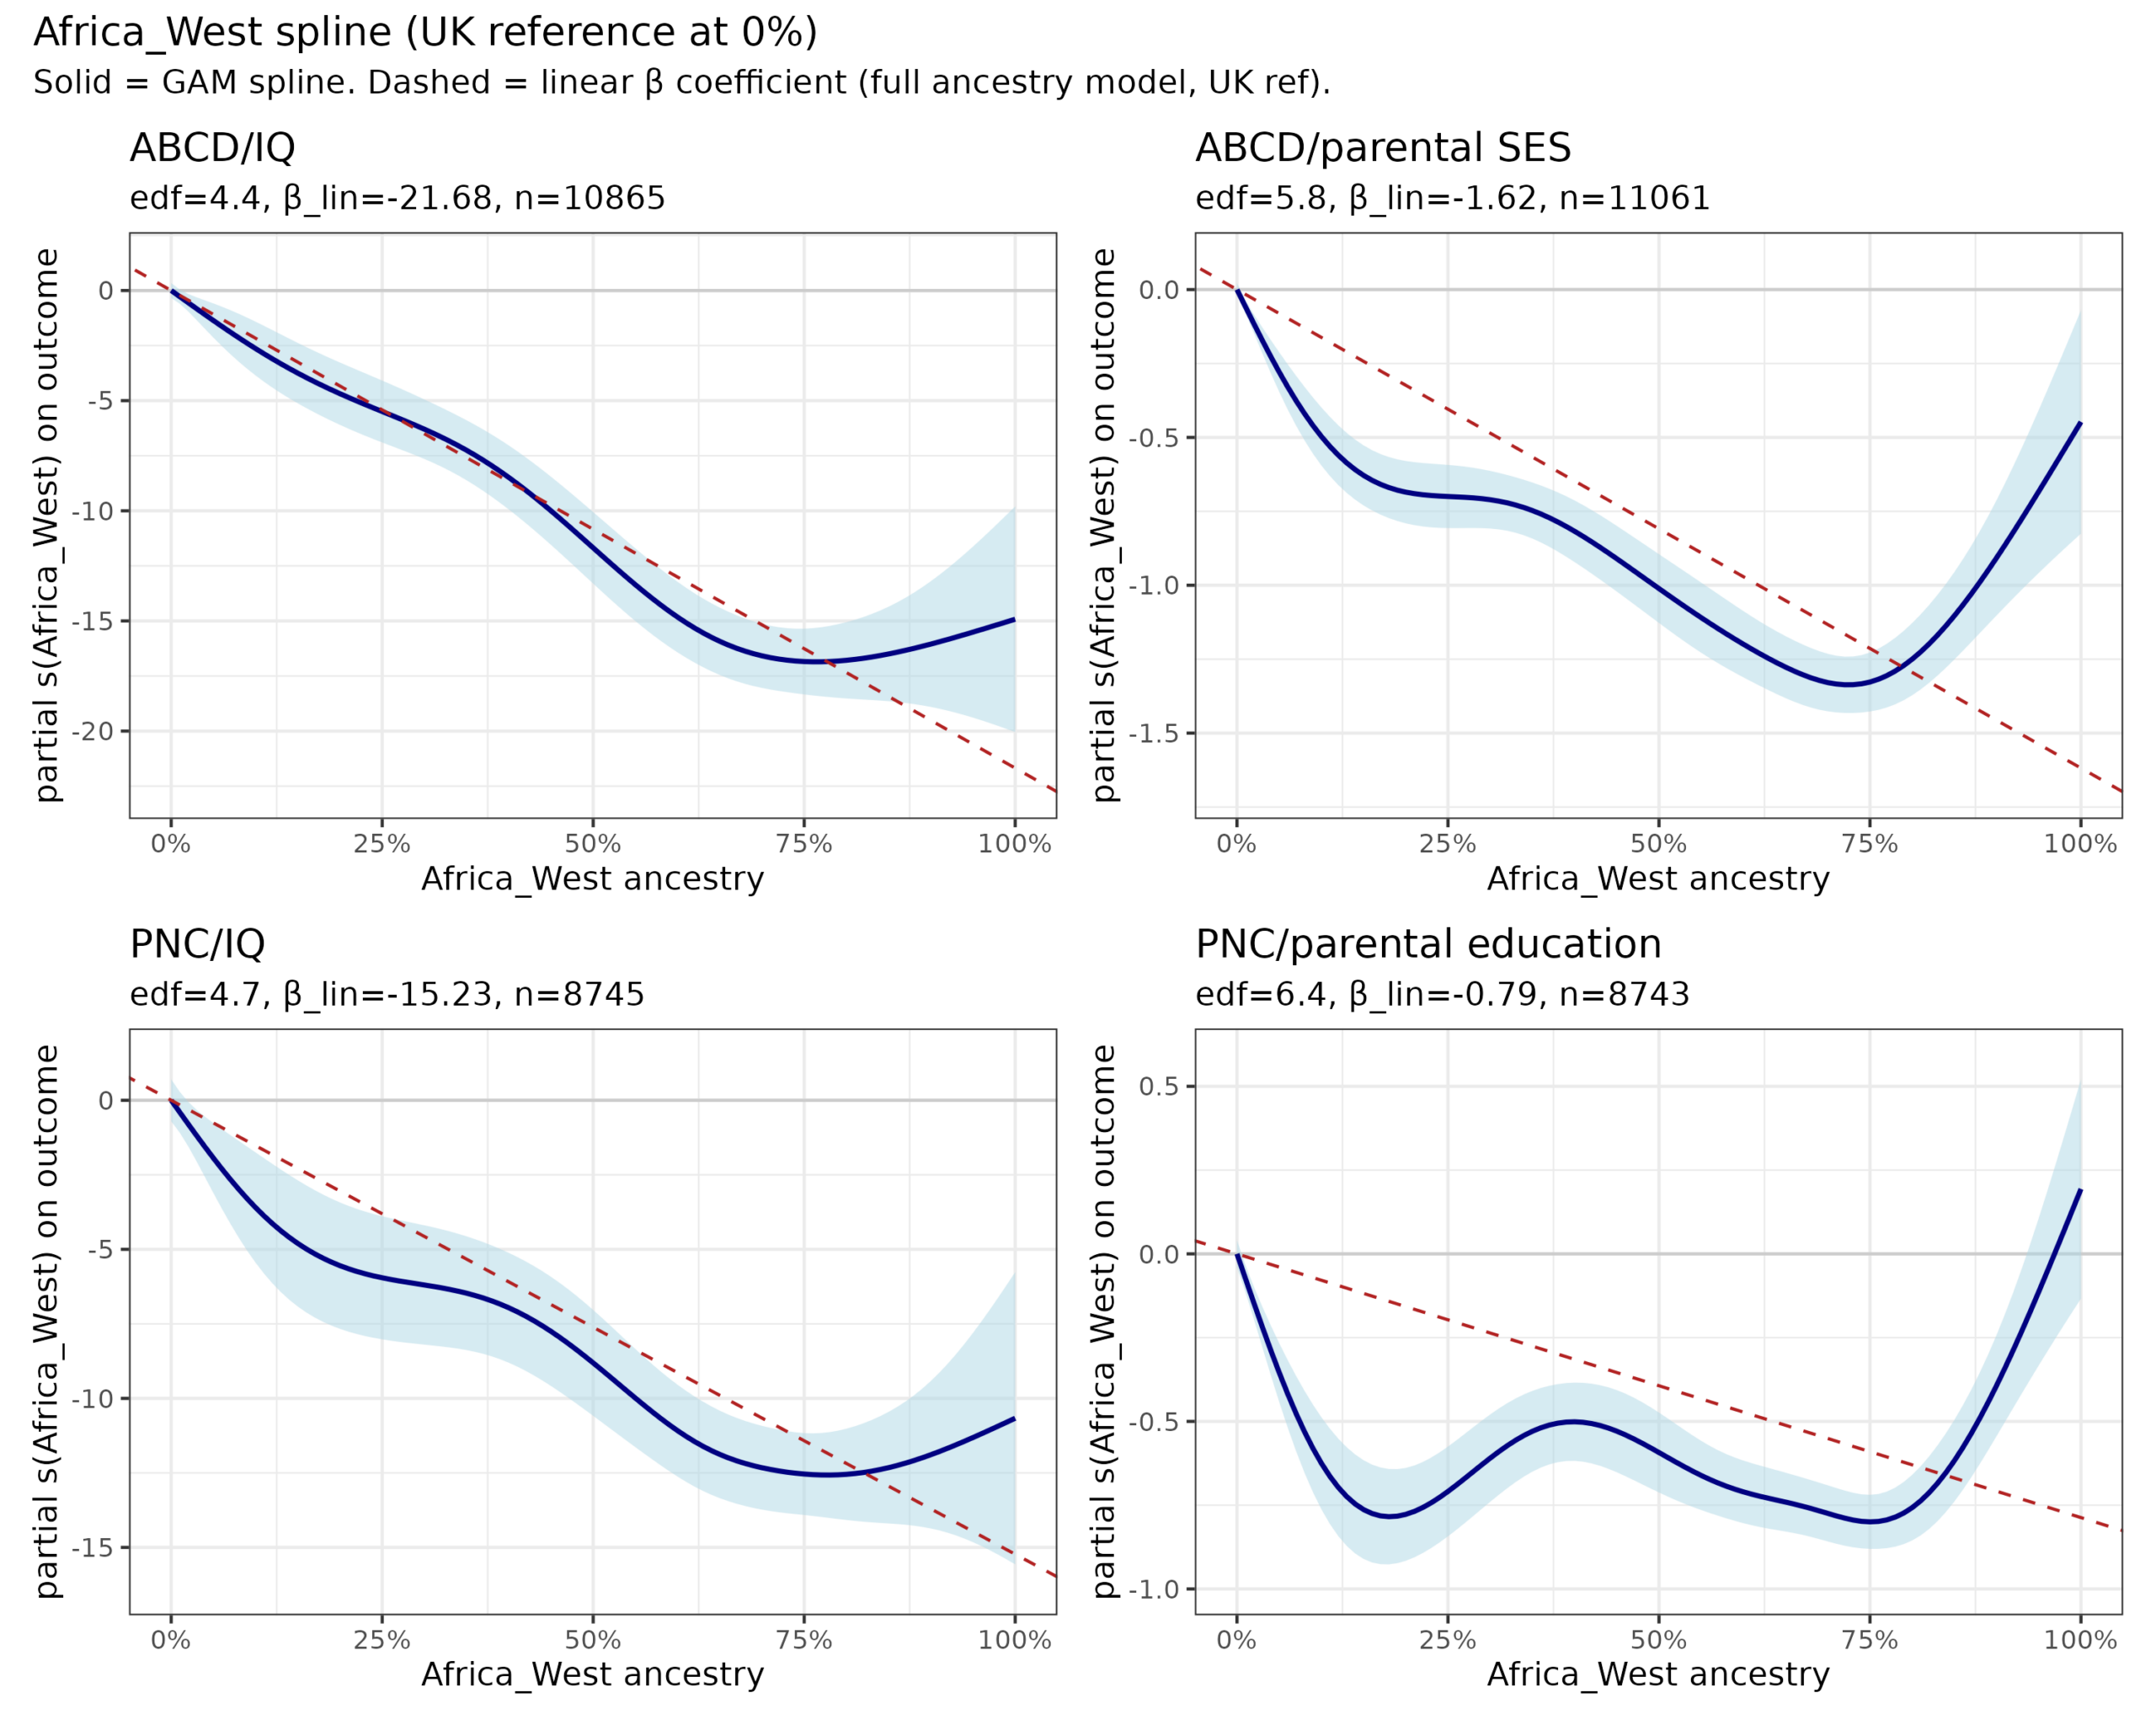
The cause of this is the recent migration of elite Africans from Africa, which boosts the right tail.
Combining the results from the datasets, we get these meta-analytic estimates:
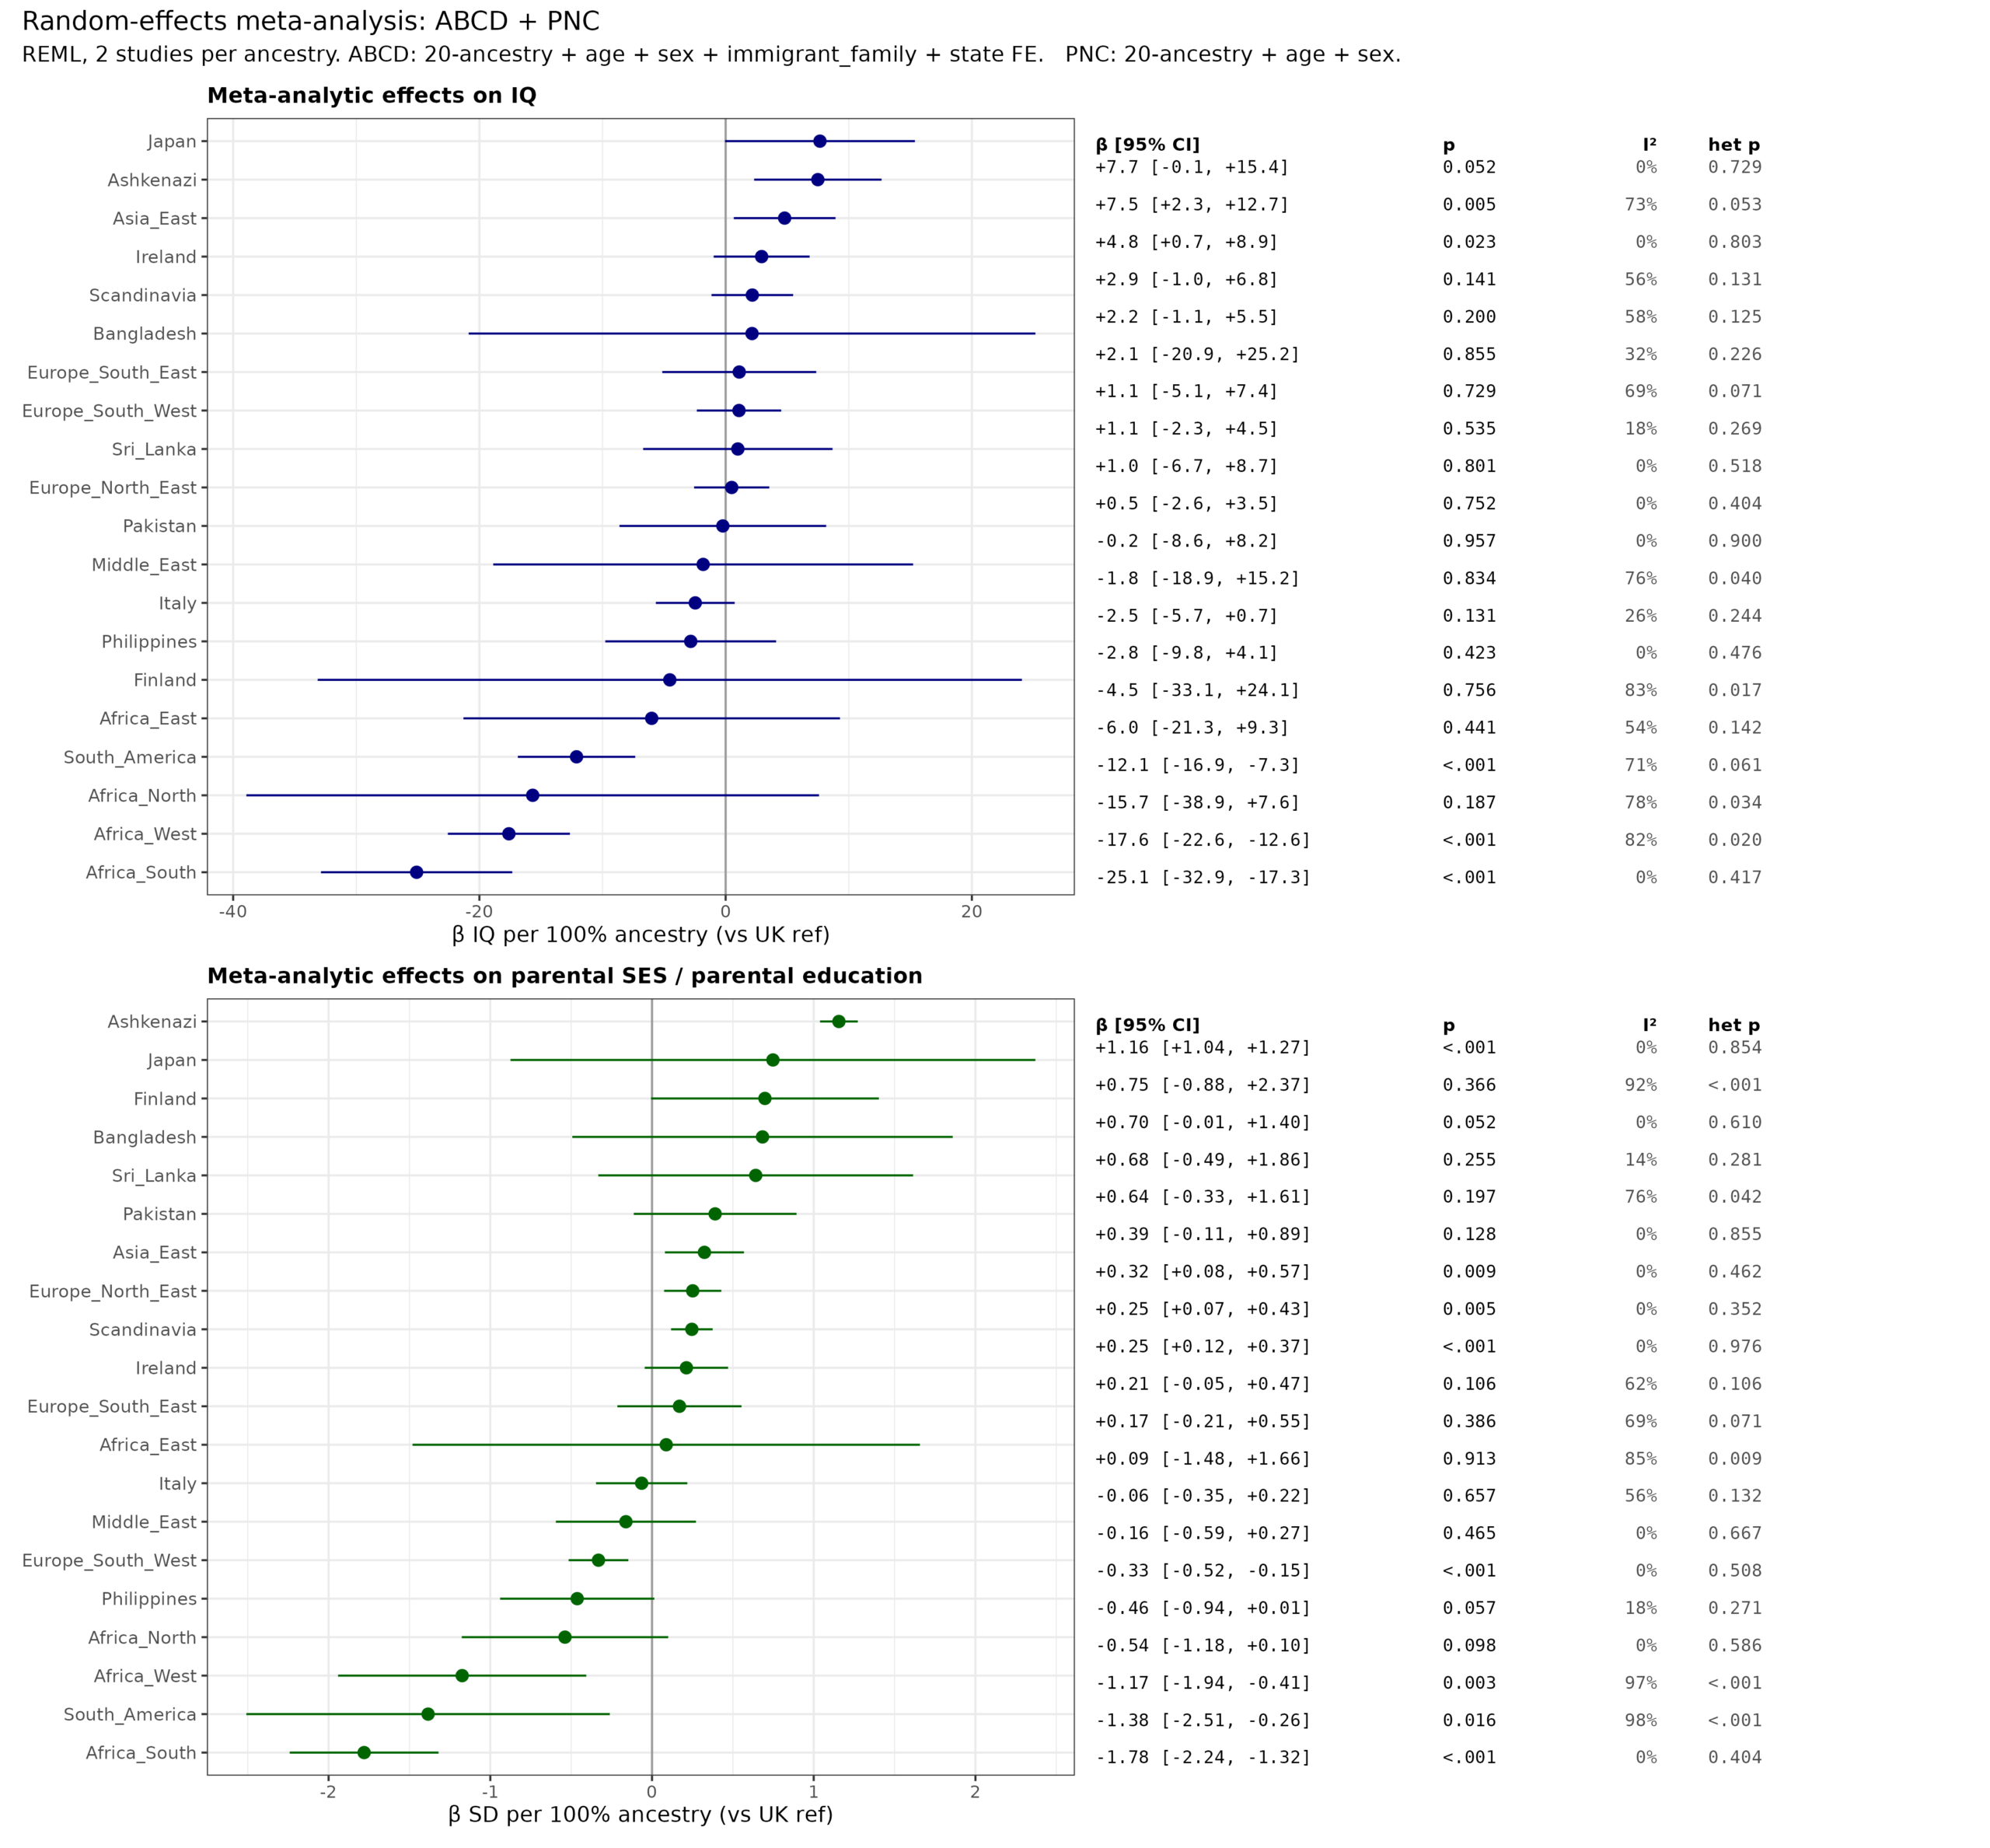
The Ashkenazi slope is 7.5 for IQ, but the 95% range is 2.3 to 12.7 IQ. This is because the results from ABCD and PNC are not so consistent (I² = 73%, p = 5%). The general issue here is that the cognitive measures in PNC are worse in general (many memory tests with poor g-loadings). The IQ ancestry slopes are ~30% smaller in PNC than in ABCD (Deming regression slope). The PNC sample includes children of quite varying ages, whereas ABCD have nearly homogeneous ages (around 11). The age residualization introduces some noise due to sampling issues and differences in developmental speed. If we assume the Deming regression slope represents measurement issues in PNC, the Ashkenazi slope becomes about 7.5 IQ.
Zooming out, we can estimate the mean PGS, IQ, and parental SES combined across datasets. This gives a kind of group-level plot for genetic potential of ancestries vs. their estimated IQs:
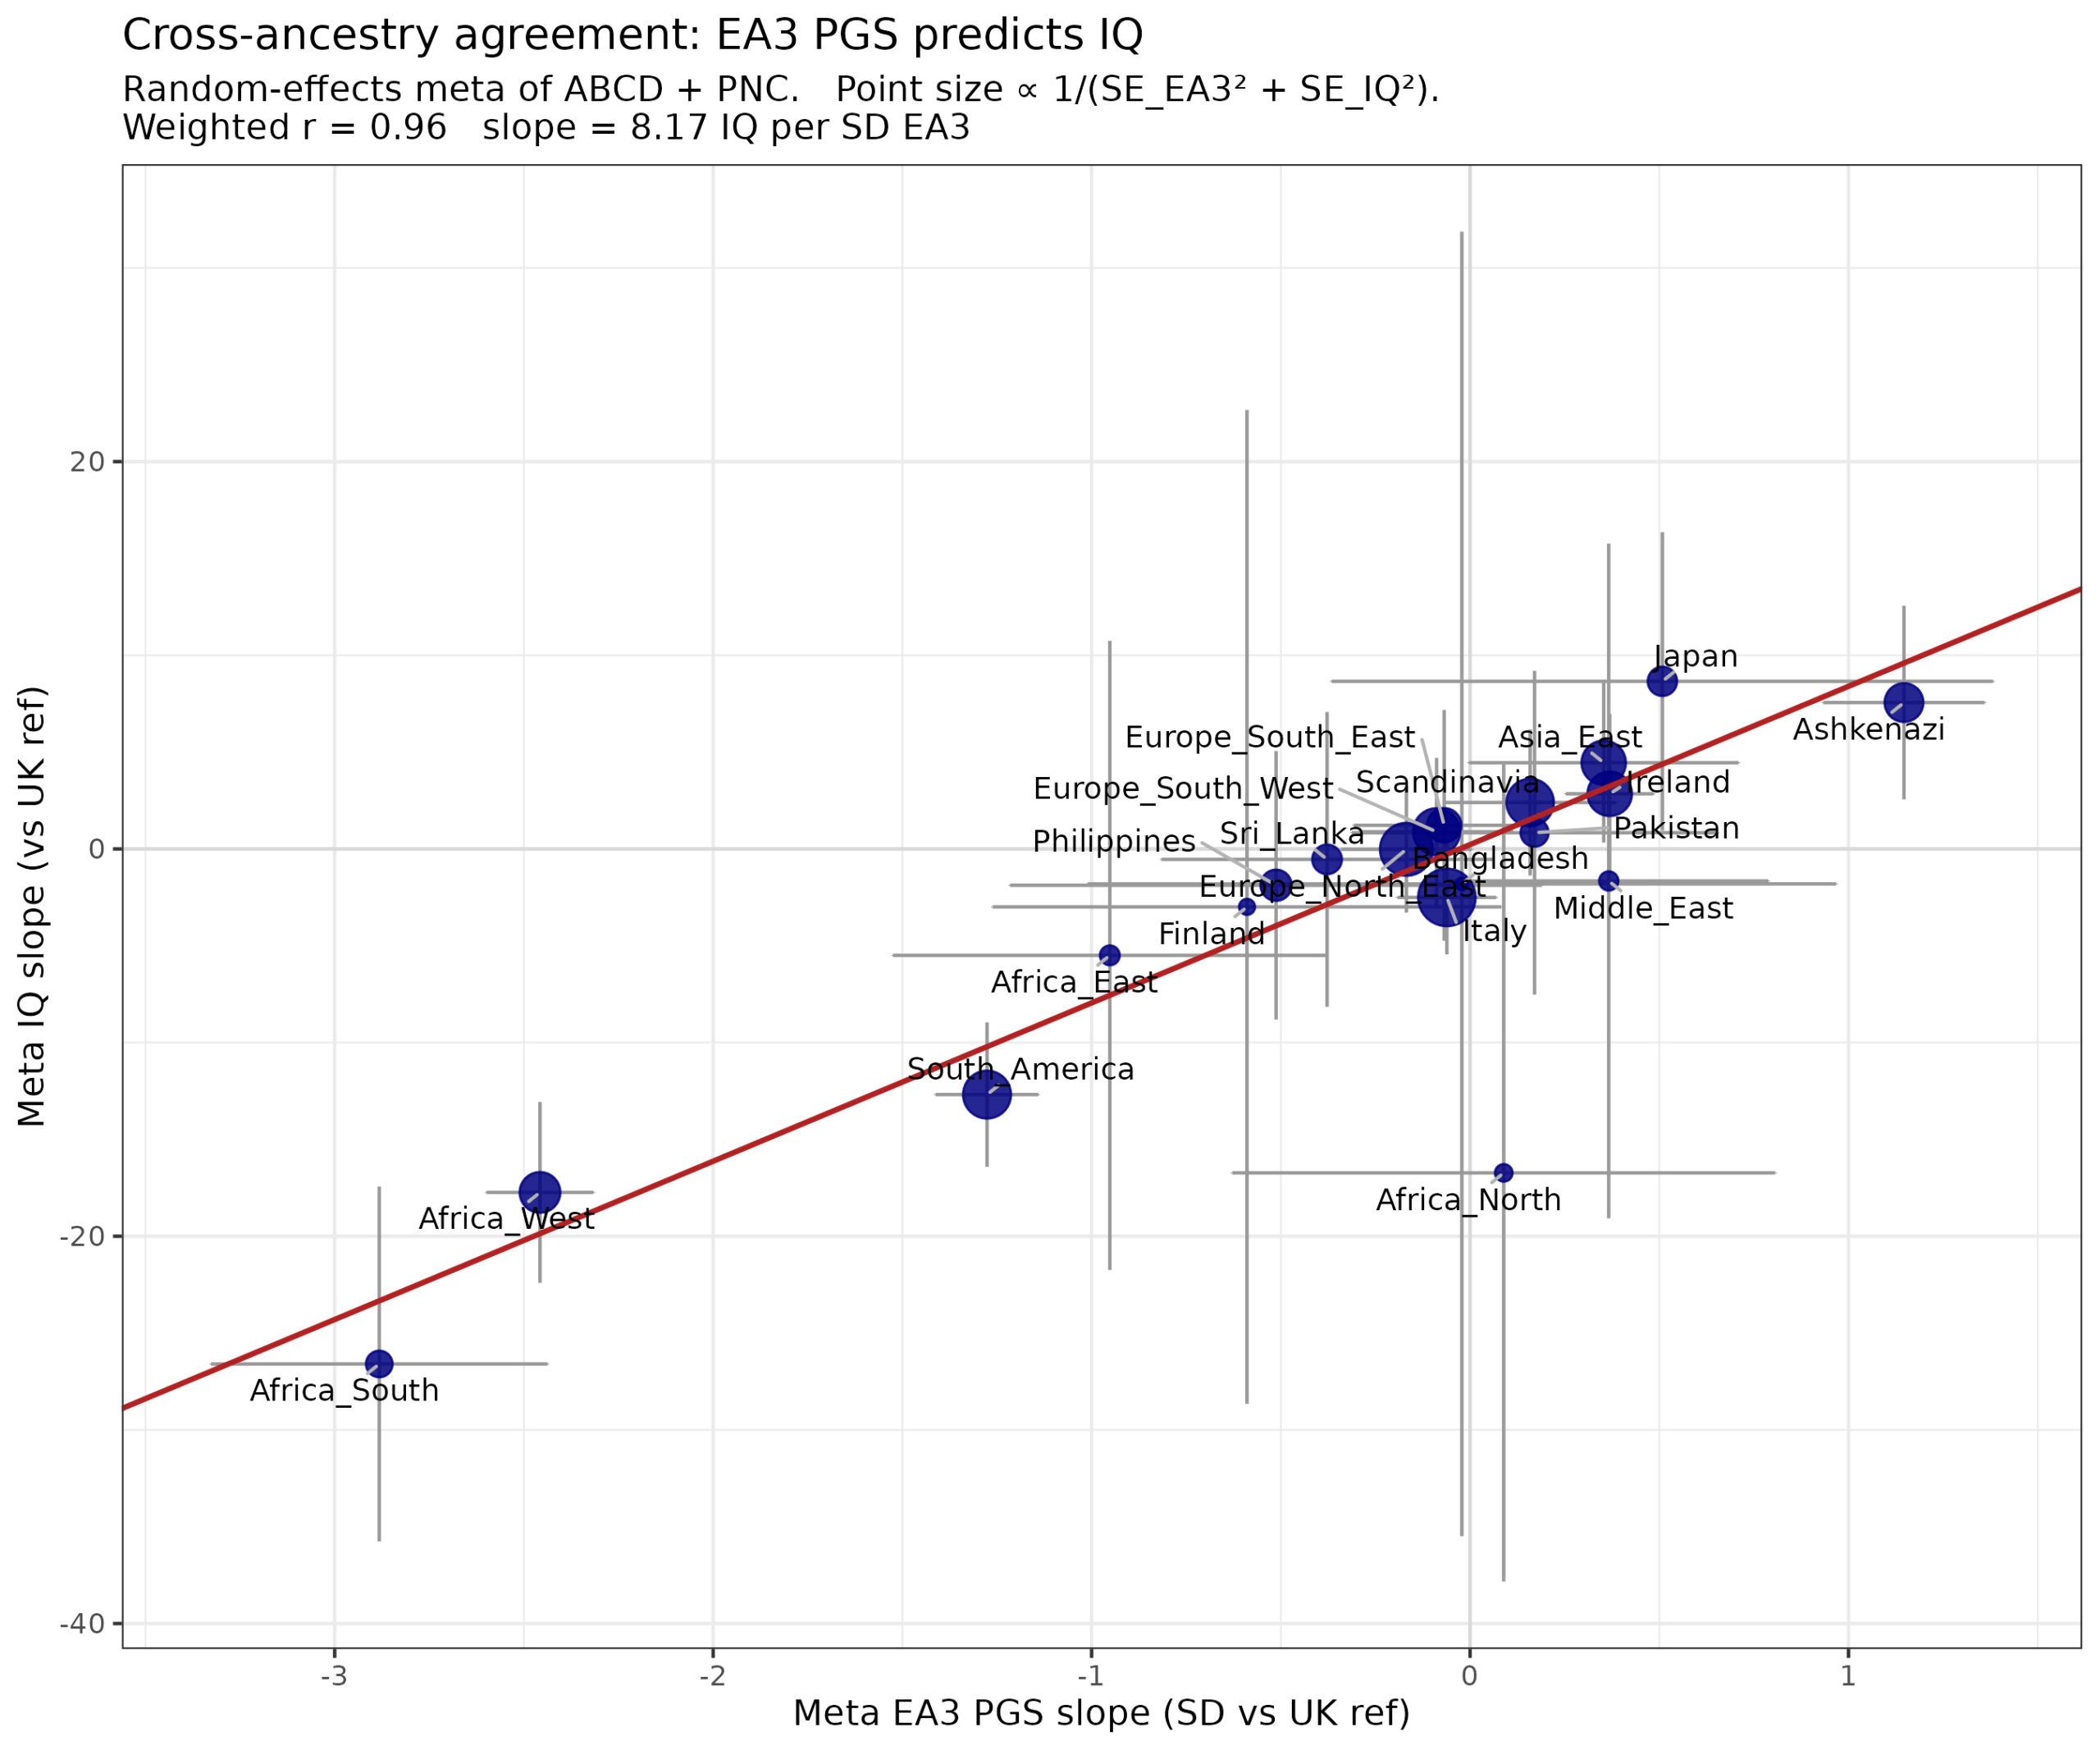
The weighted correlation is an amazing 0.96. For parental SES:
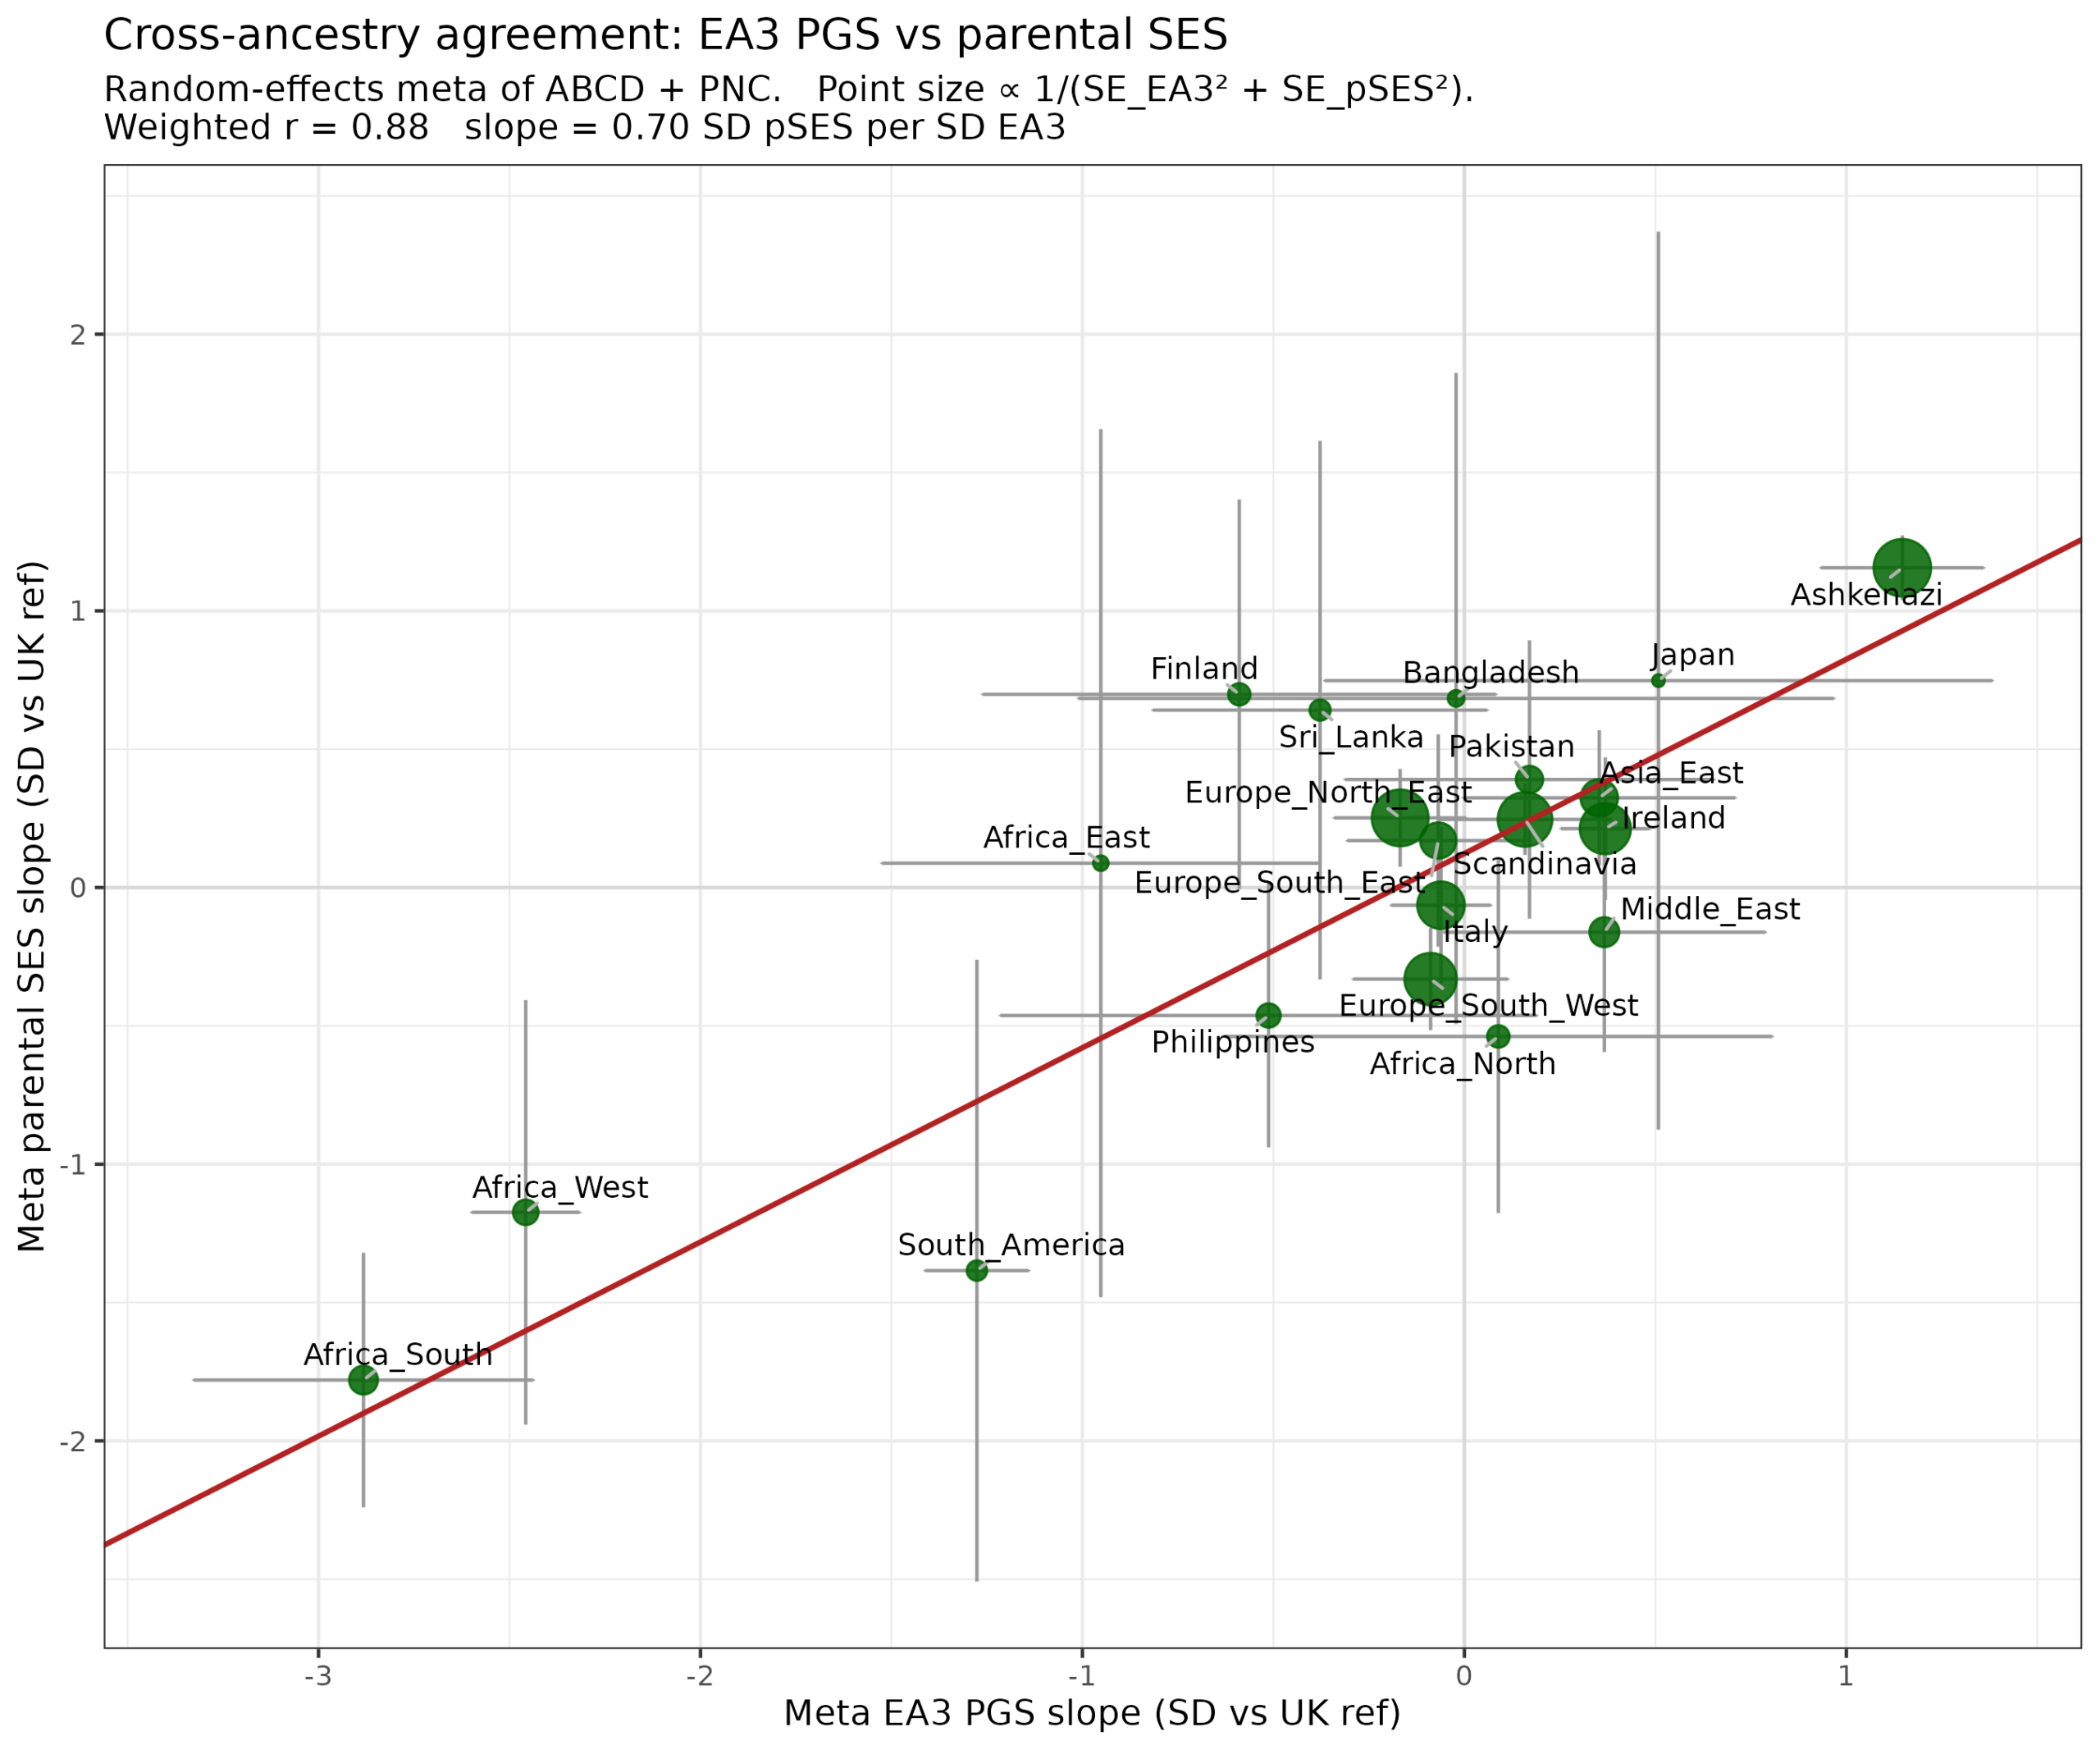
A bit less, but 0.88 is pretty good.
Overall, the results show that cognitive and social inequality is not so mysterious.
Where does this leave us for Jewish intelligence? Well, clearly, there is genetic evidence from large samples pointing in the right direction. The specific values are hard to estimate for a number of reasons:
- Ancestry estimates are probably not that accurate for many of the closely related European groups, including the Ashkenazis.
- Intelligence was measured mostly in childhood, and in PNC at varying ages with a suboptimal battery of tests. In general, all the PNC results were weaker.
- The usual caveats apply to the polygenic scores. These are trained on Europeans and have weaker correlations for the other groups. EA4 shows mean bias for Africans, which is also why I used the EA3 in the last 2 plots even though it’s a subset of EA4 (the correlations for EA4 are 0.81 and 0.69). One could apply Piffer’s filtering method here but I leave this for future research.