We are finally ready to share our big follow-up to the first Admixture in the Americas project from 2016.
- Fuerst, J., & Kirkegaard, E. O. W. (2025, December 5). Continental Genetic Ancestries as Predictors of Socioeconomic and Cognitive Variation Across the Americas. https://doi.org/10.31235/osf.io/vgfrb_v1
We draw upon newly compiled subnational indicators from fifteen countries to revisit relationships between continental genetic ancestry, cognitive ability (CA), and socioeconomic outcomes (S) in the Americas. Across national and subnational analyses, West Eurasian ancestry, in contrast to Amerindian and African, correlates robustly and positively with CA and S. In models including country fixed effects a shift from 0% to 100% West Eurasian genetic ancestry corresponds to an estimated increase of approximately 1.0–1.3 in either CA or S in units of standard deviation. Models that include both country fixed effects and random slopes produce similar estimates. These associations remain stable when controlled for geoclimatic variables (e.g., annual temperature, precipitation, UV-radiation). Although the cross-sectional nature of the data precludes formal causal inference, the results are consistent with CA mediating roughly 50% of the association between West Eurasian ancestry and S. The findings provide additional support for the “deep roots” hypothesis that continental ancestry is systematically linked to regional variations in cognitive and socioeconomic outcomes across the Americas.
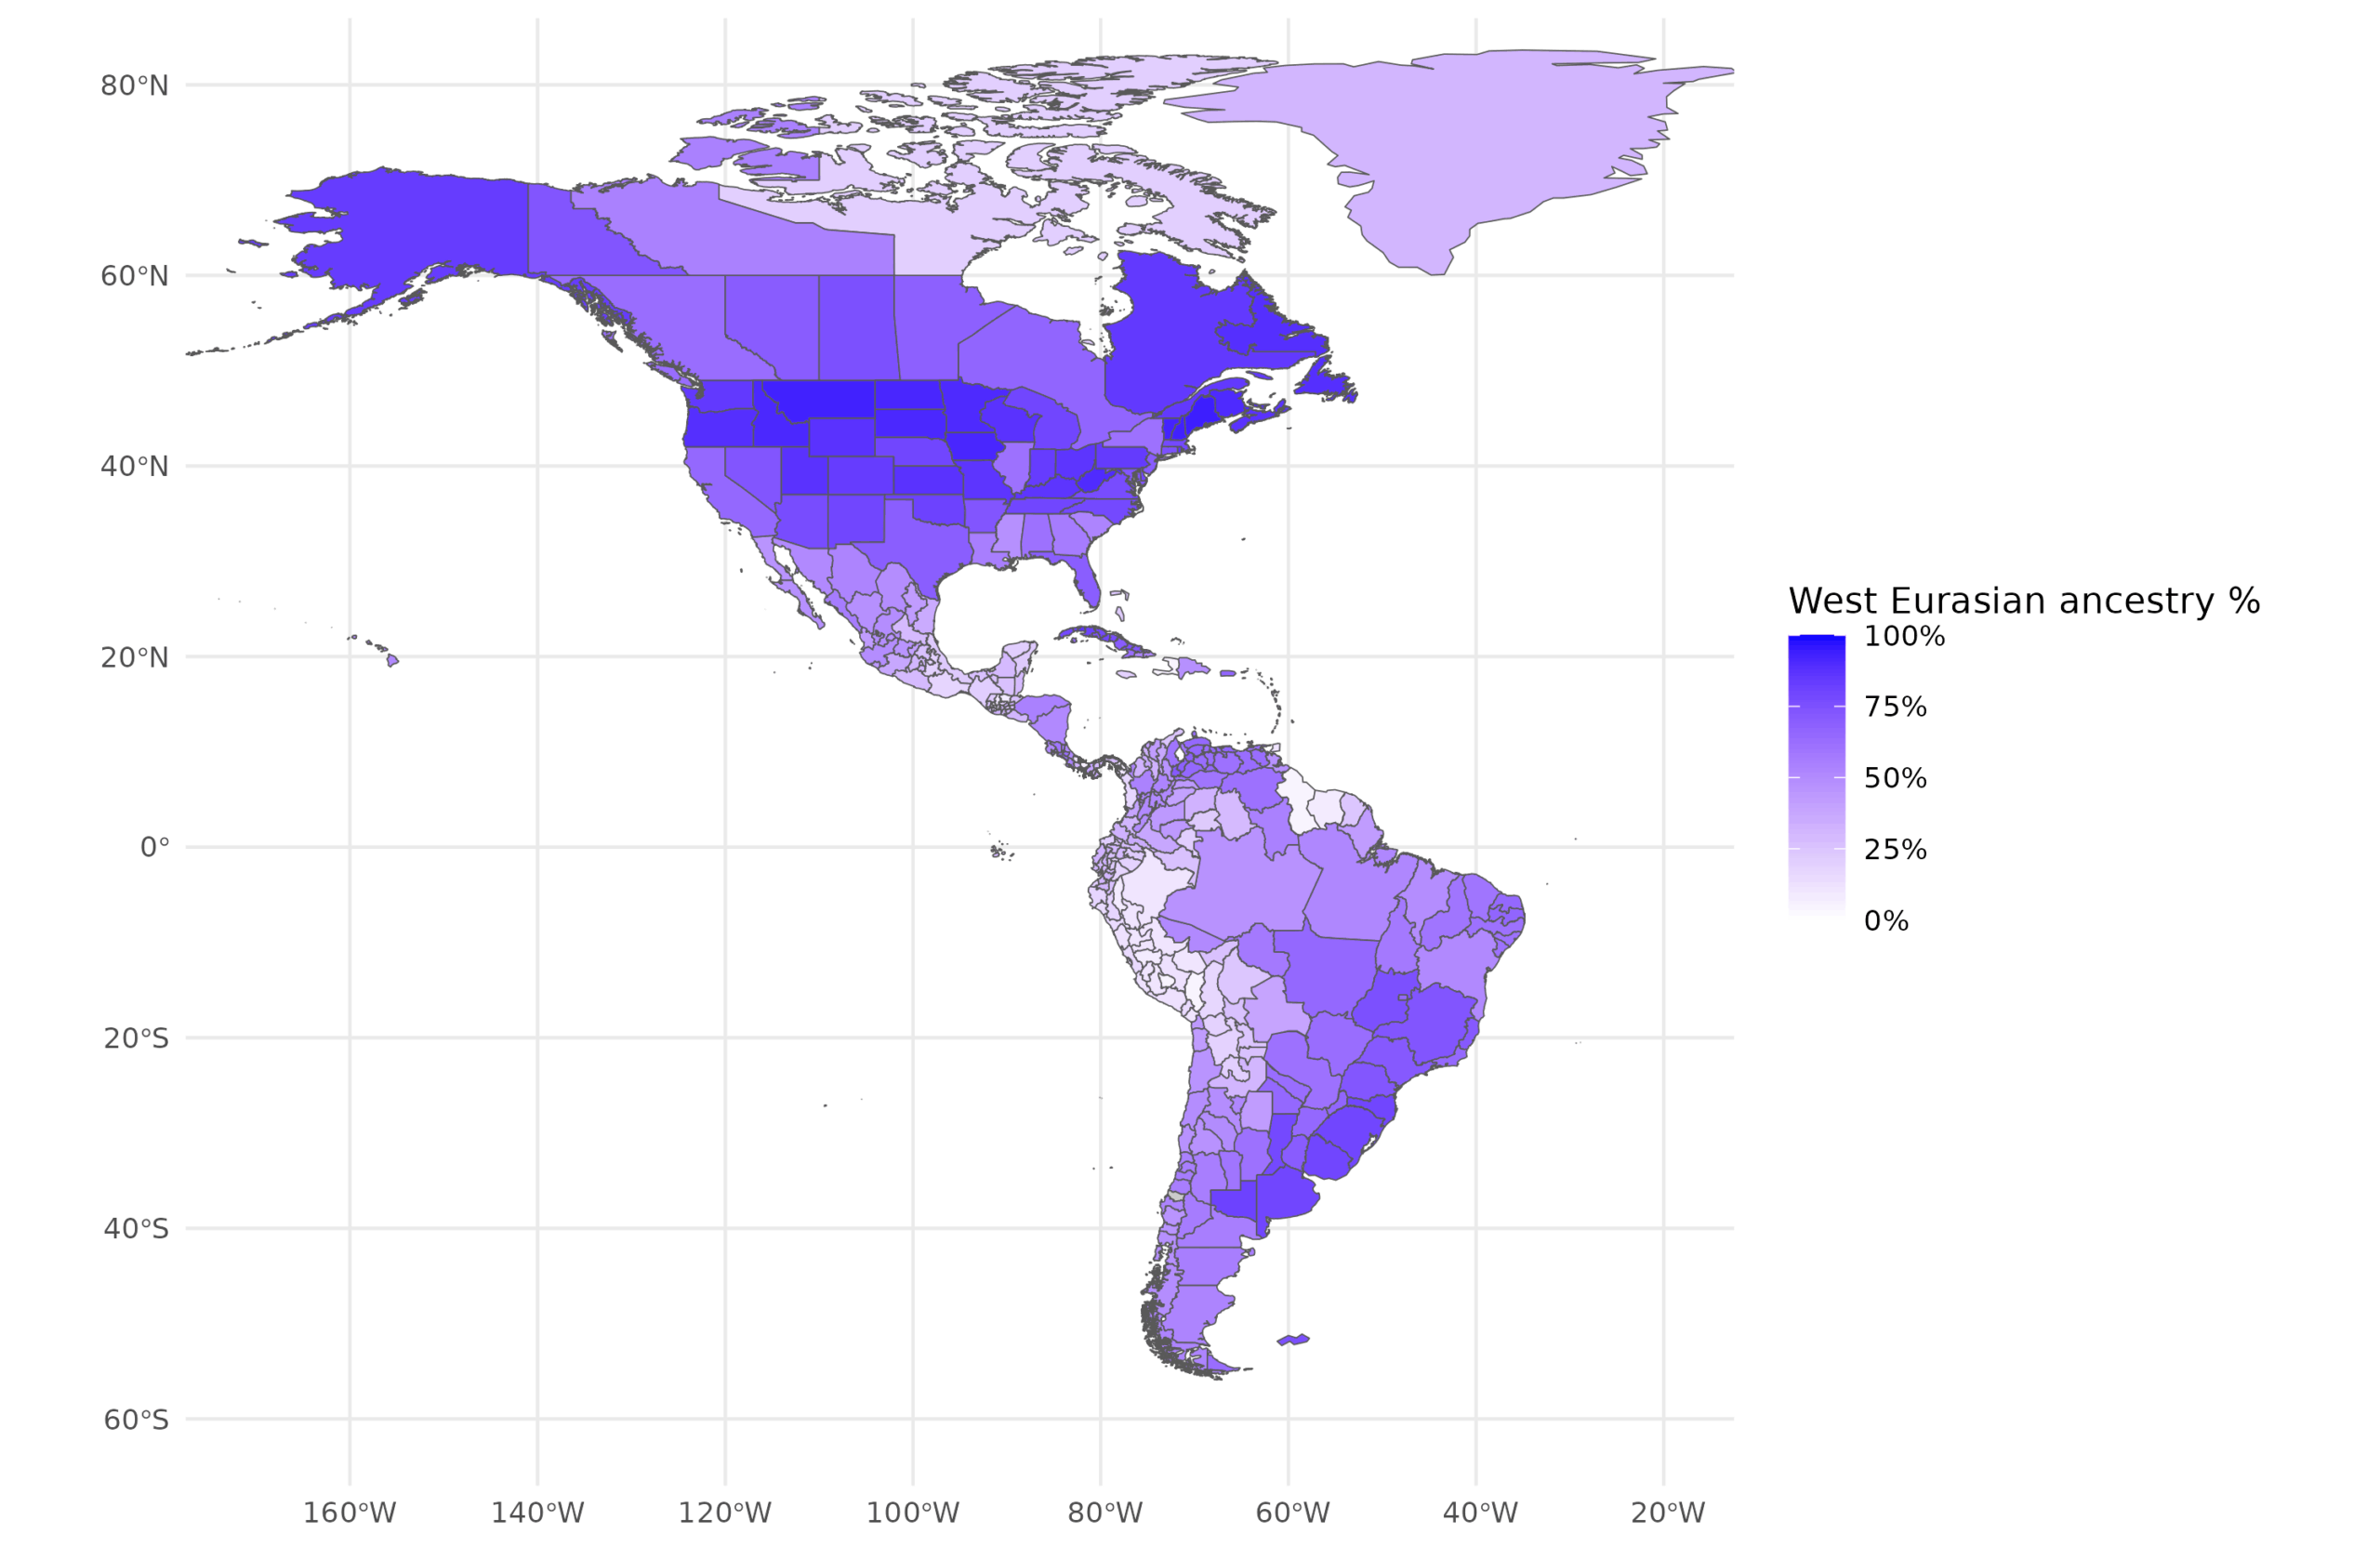
It has been repeatedly shown in prior research that (genetic) ancestry (race) predicts outcomes at the individual level (see our work using ABCD, PNC, and PING), and also Meng Hu’s new post on our new meta-analysis of correlations. Various economists have also used rough estimates of country (Easterly & Levine 2016) and subnational ancestry (e.g. US counties, Fulford et al 2020) to predict outcomes (usually just GDPpc). This is part of the so-called deep roots literature. So back in 2016 we gathered genetic studies from various countries and subnational units in the Americas. We showed that European, African, and Amerindian ancestry are predictive of the level of development in the countries, alone and net of plausible controls. In our new study we expand upon this project but with more data and stronger methods. The basics of ancestry variation in the Americas look like this. European:
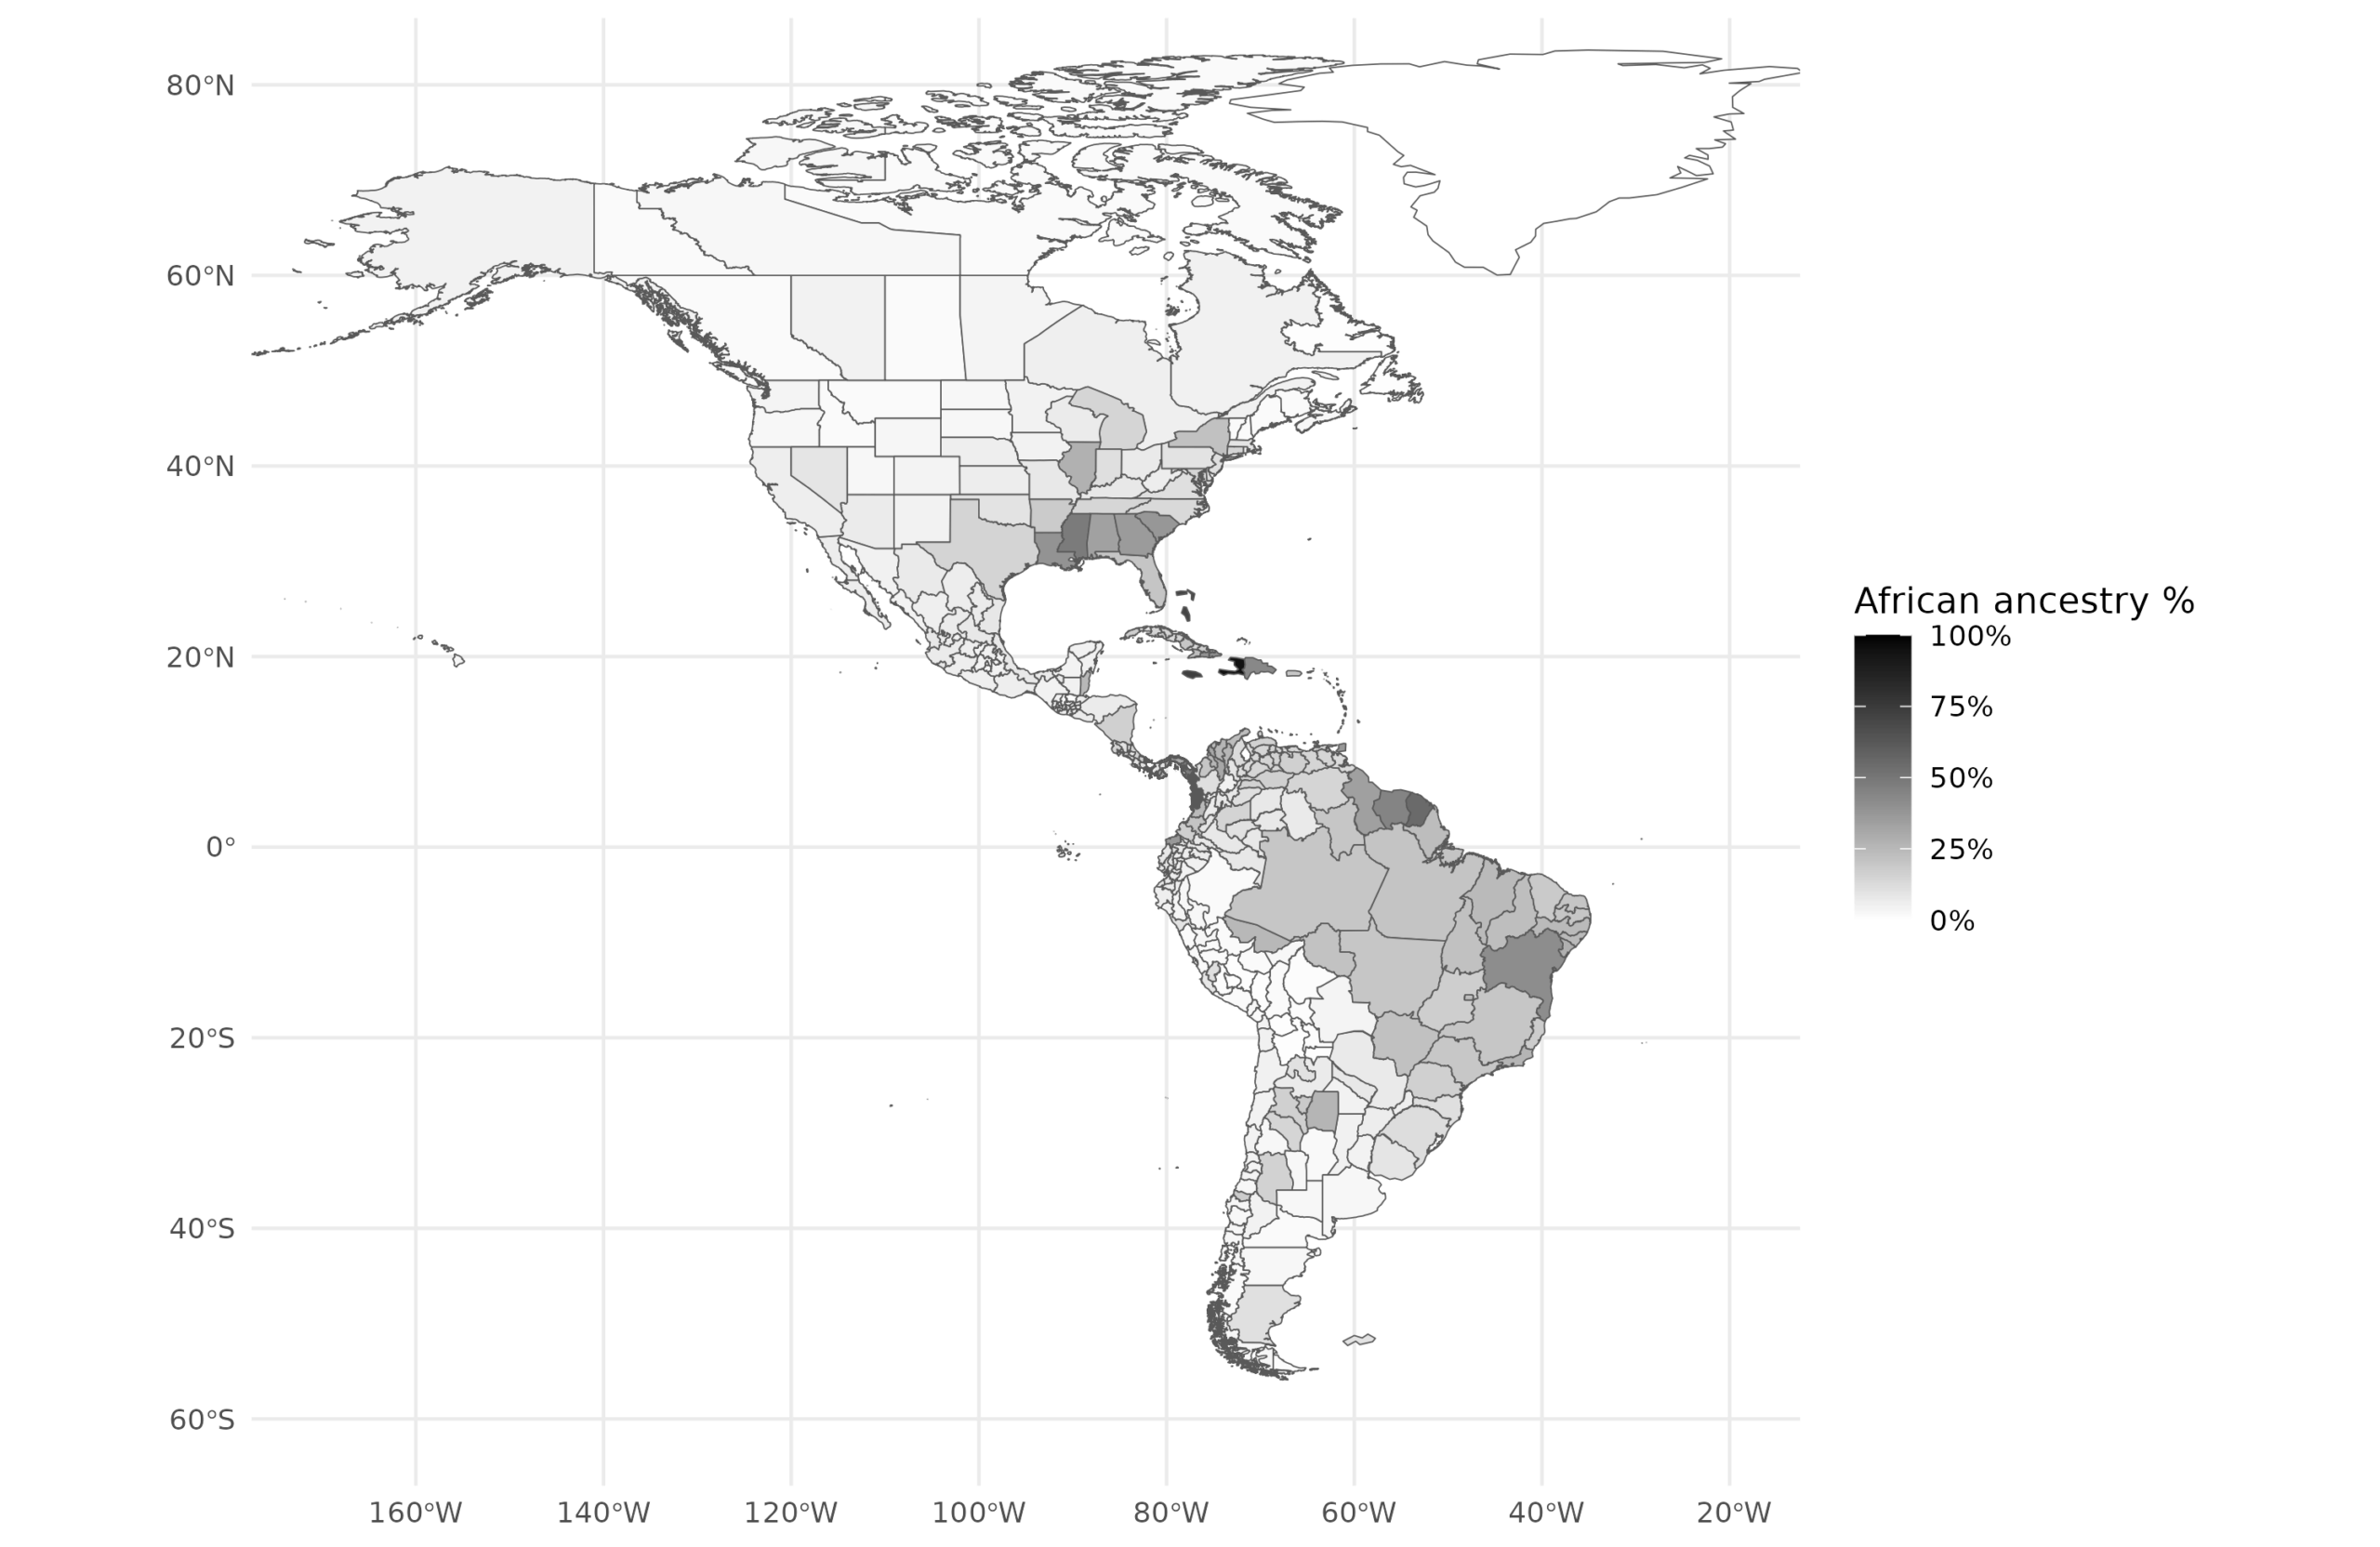
African:
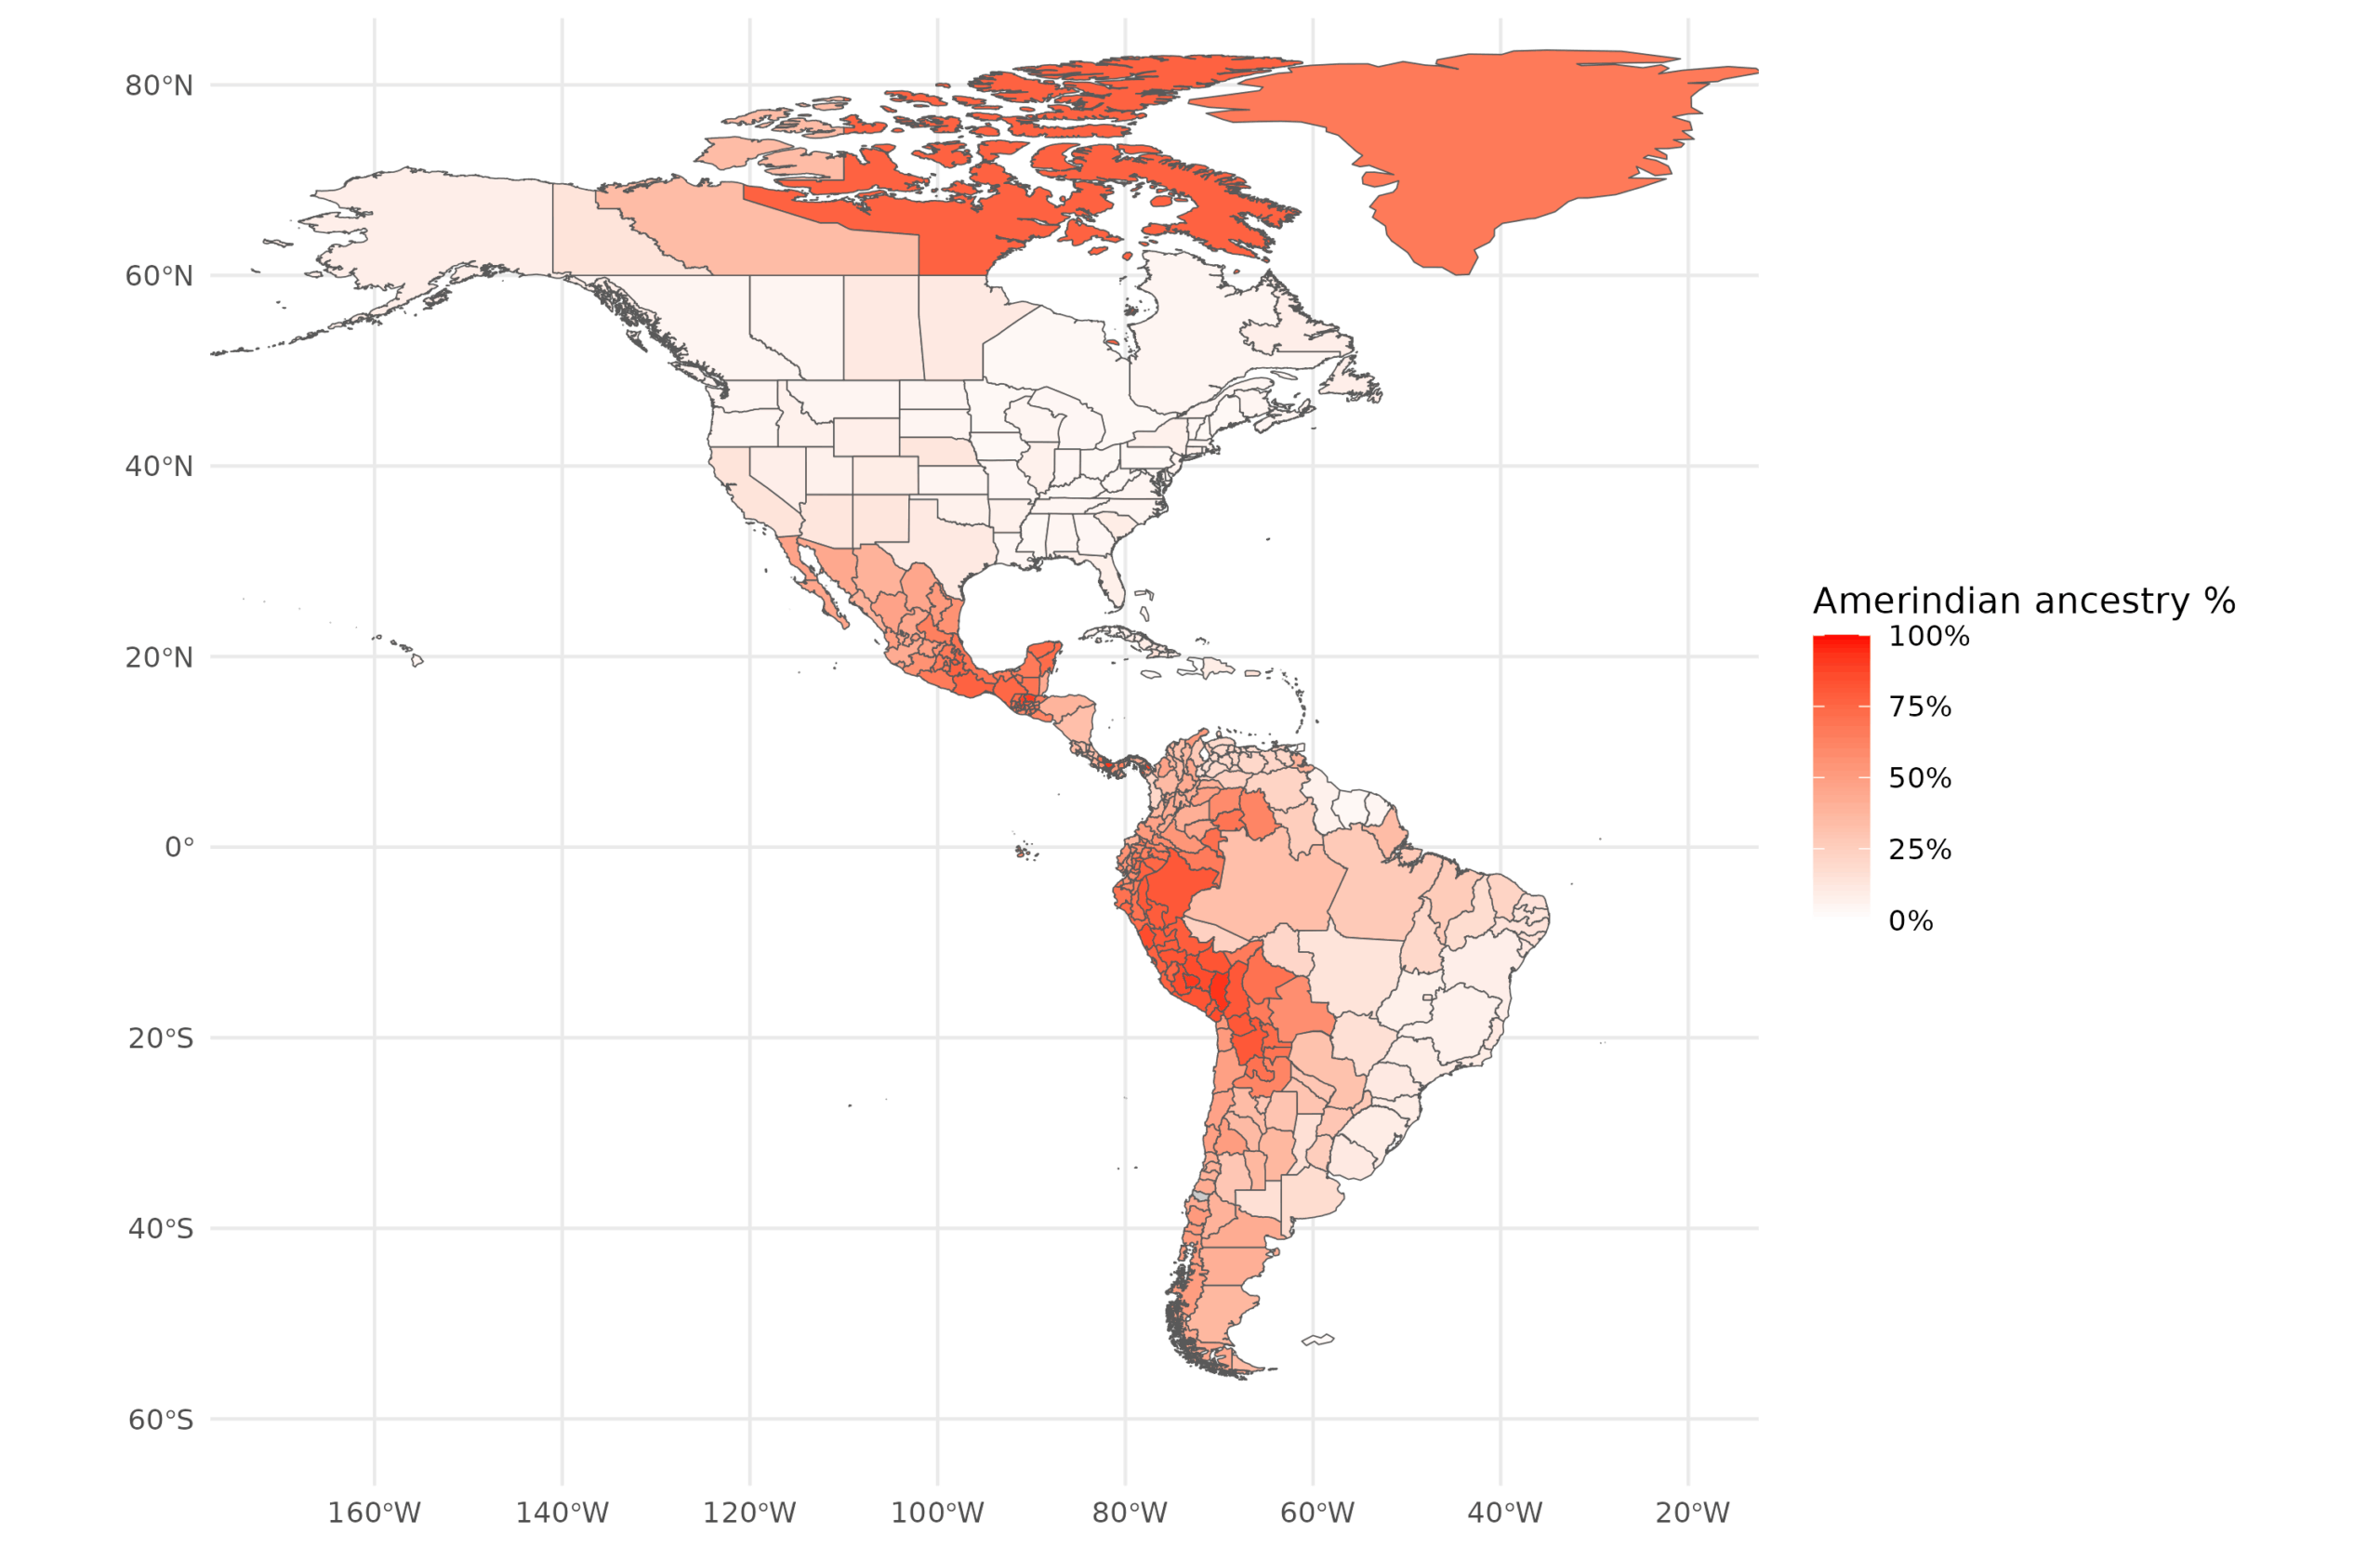
Amerindian:
And Other:
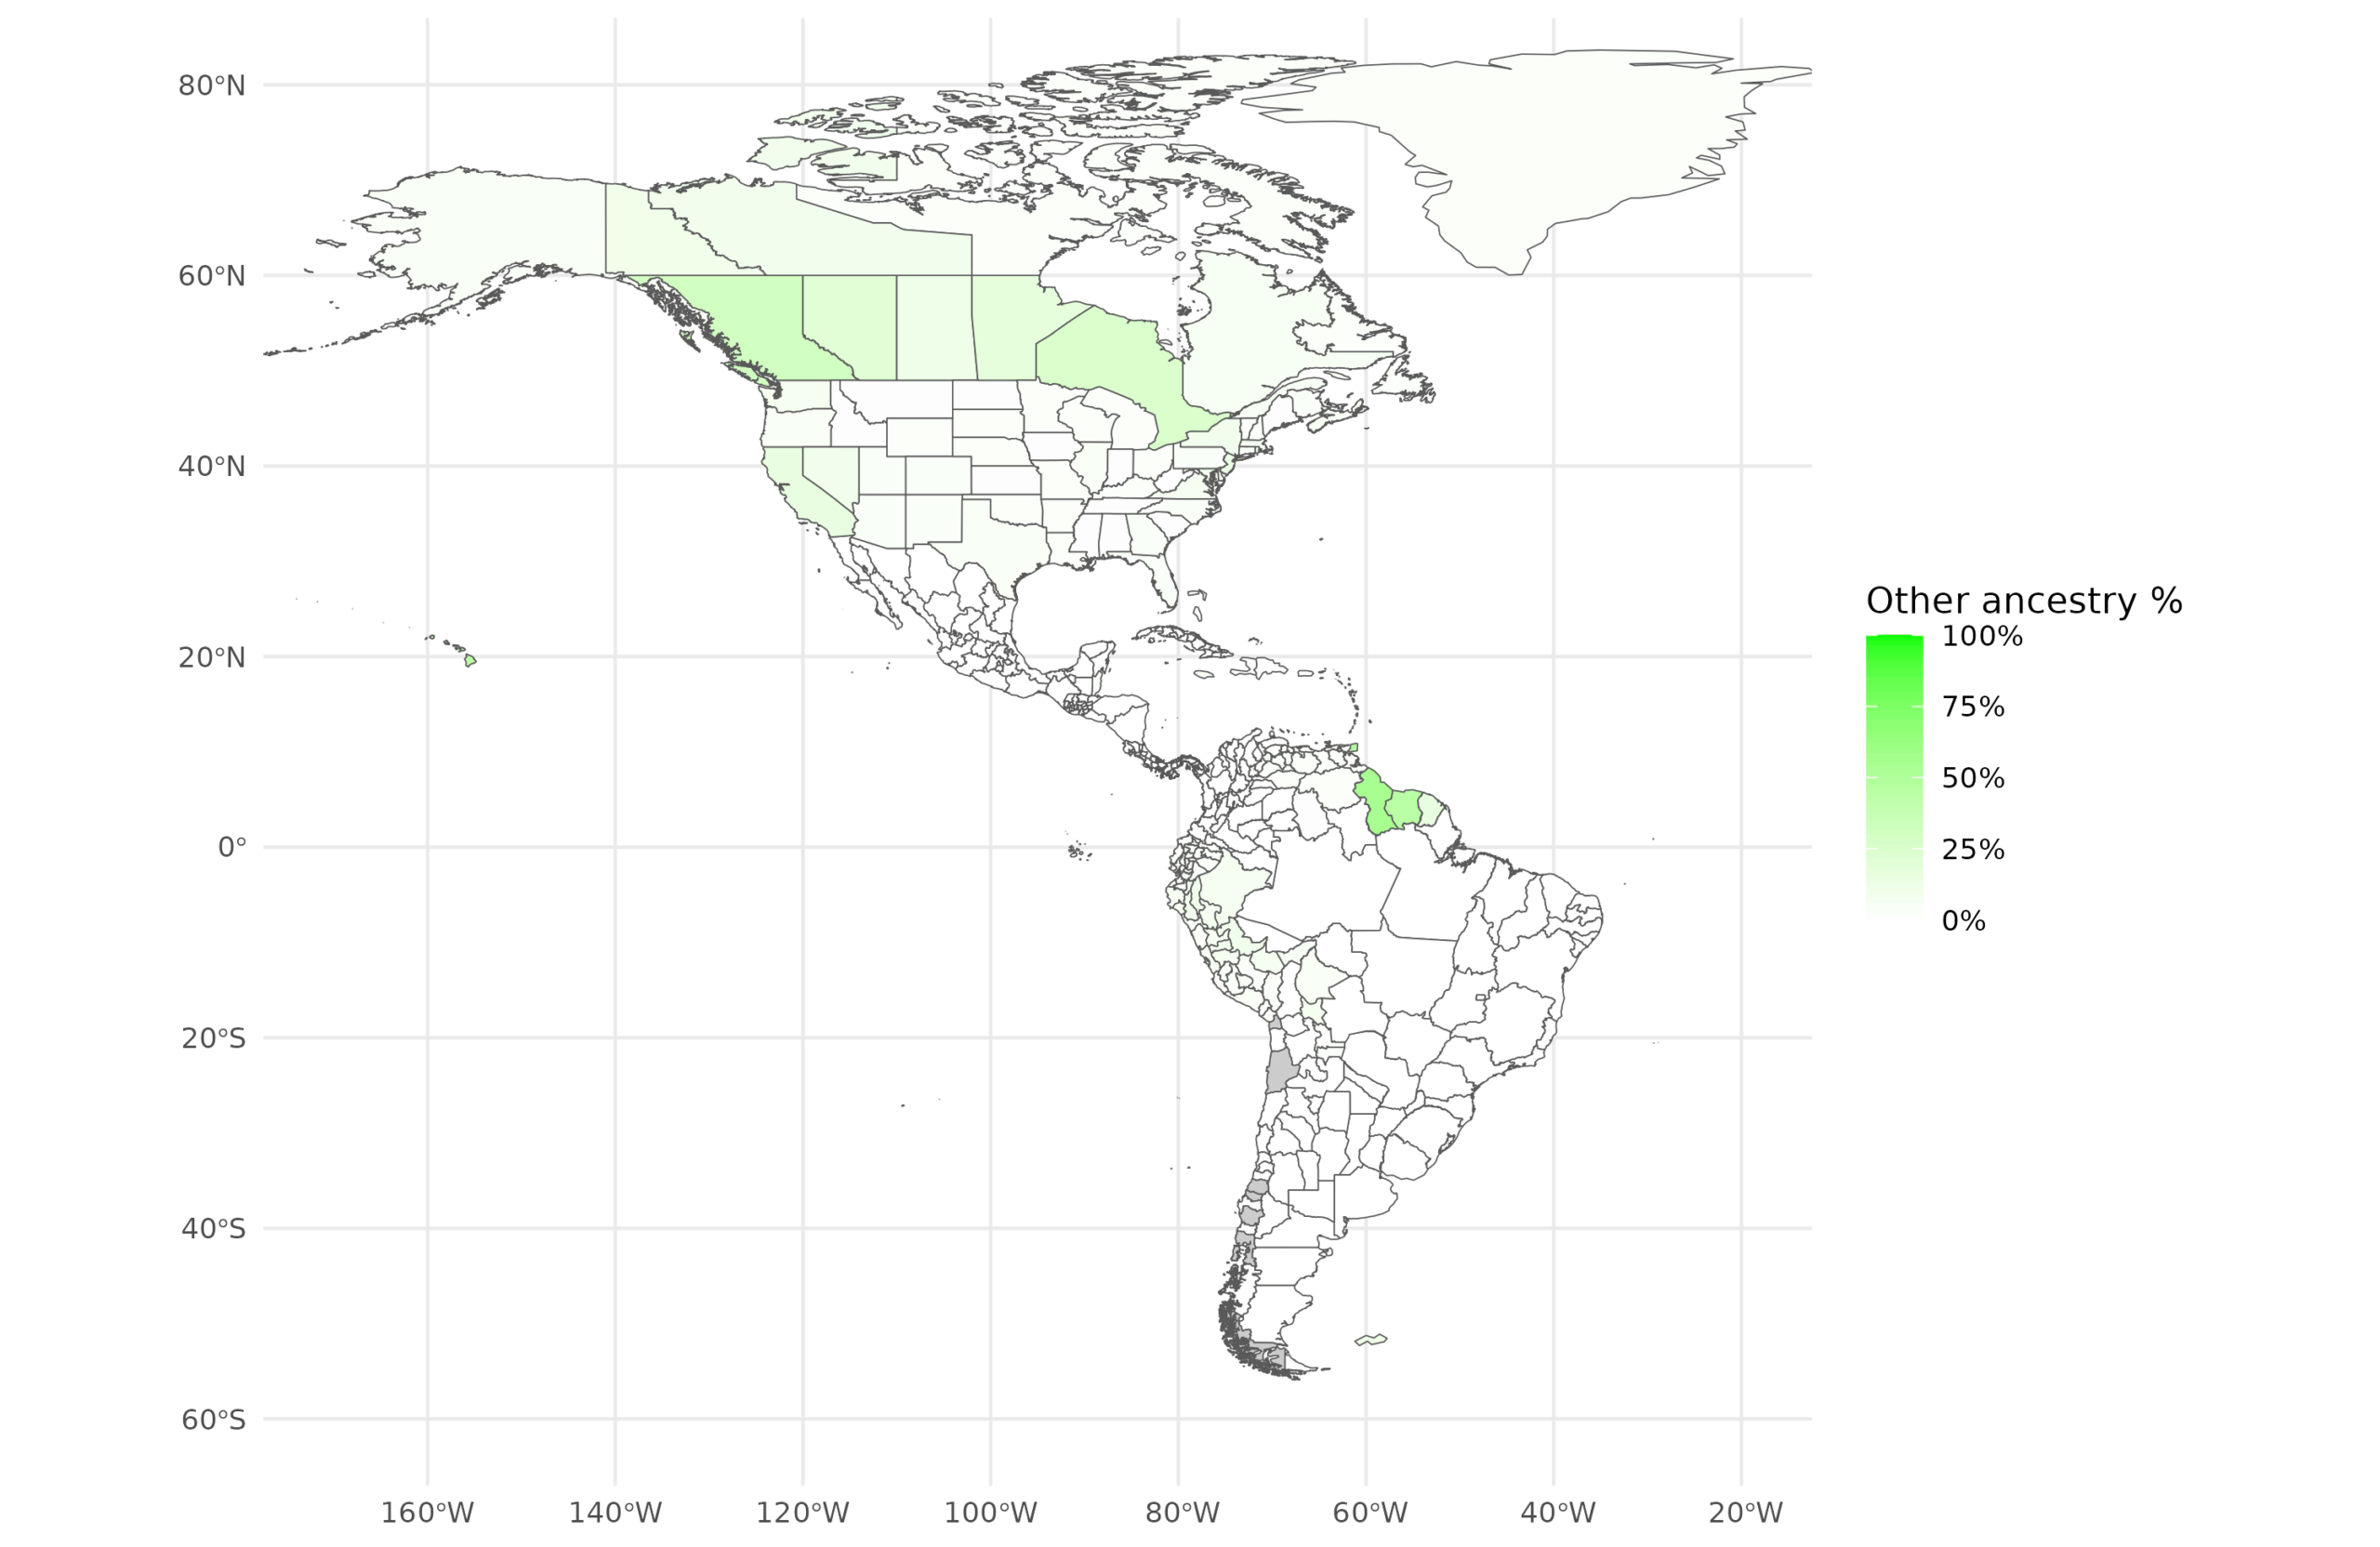
To note about these. The European cluster in this new study is West Eurasian since e.g. Turkish or Levantine ancestry will cluster with Europeans. Other is hard to interpret because it is a remainder category that differs by location. I think it is mainly Indian (South Asian) ancestry, but it can be something else depending on location.
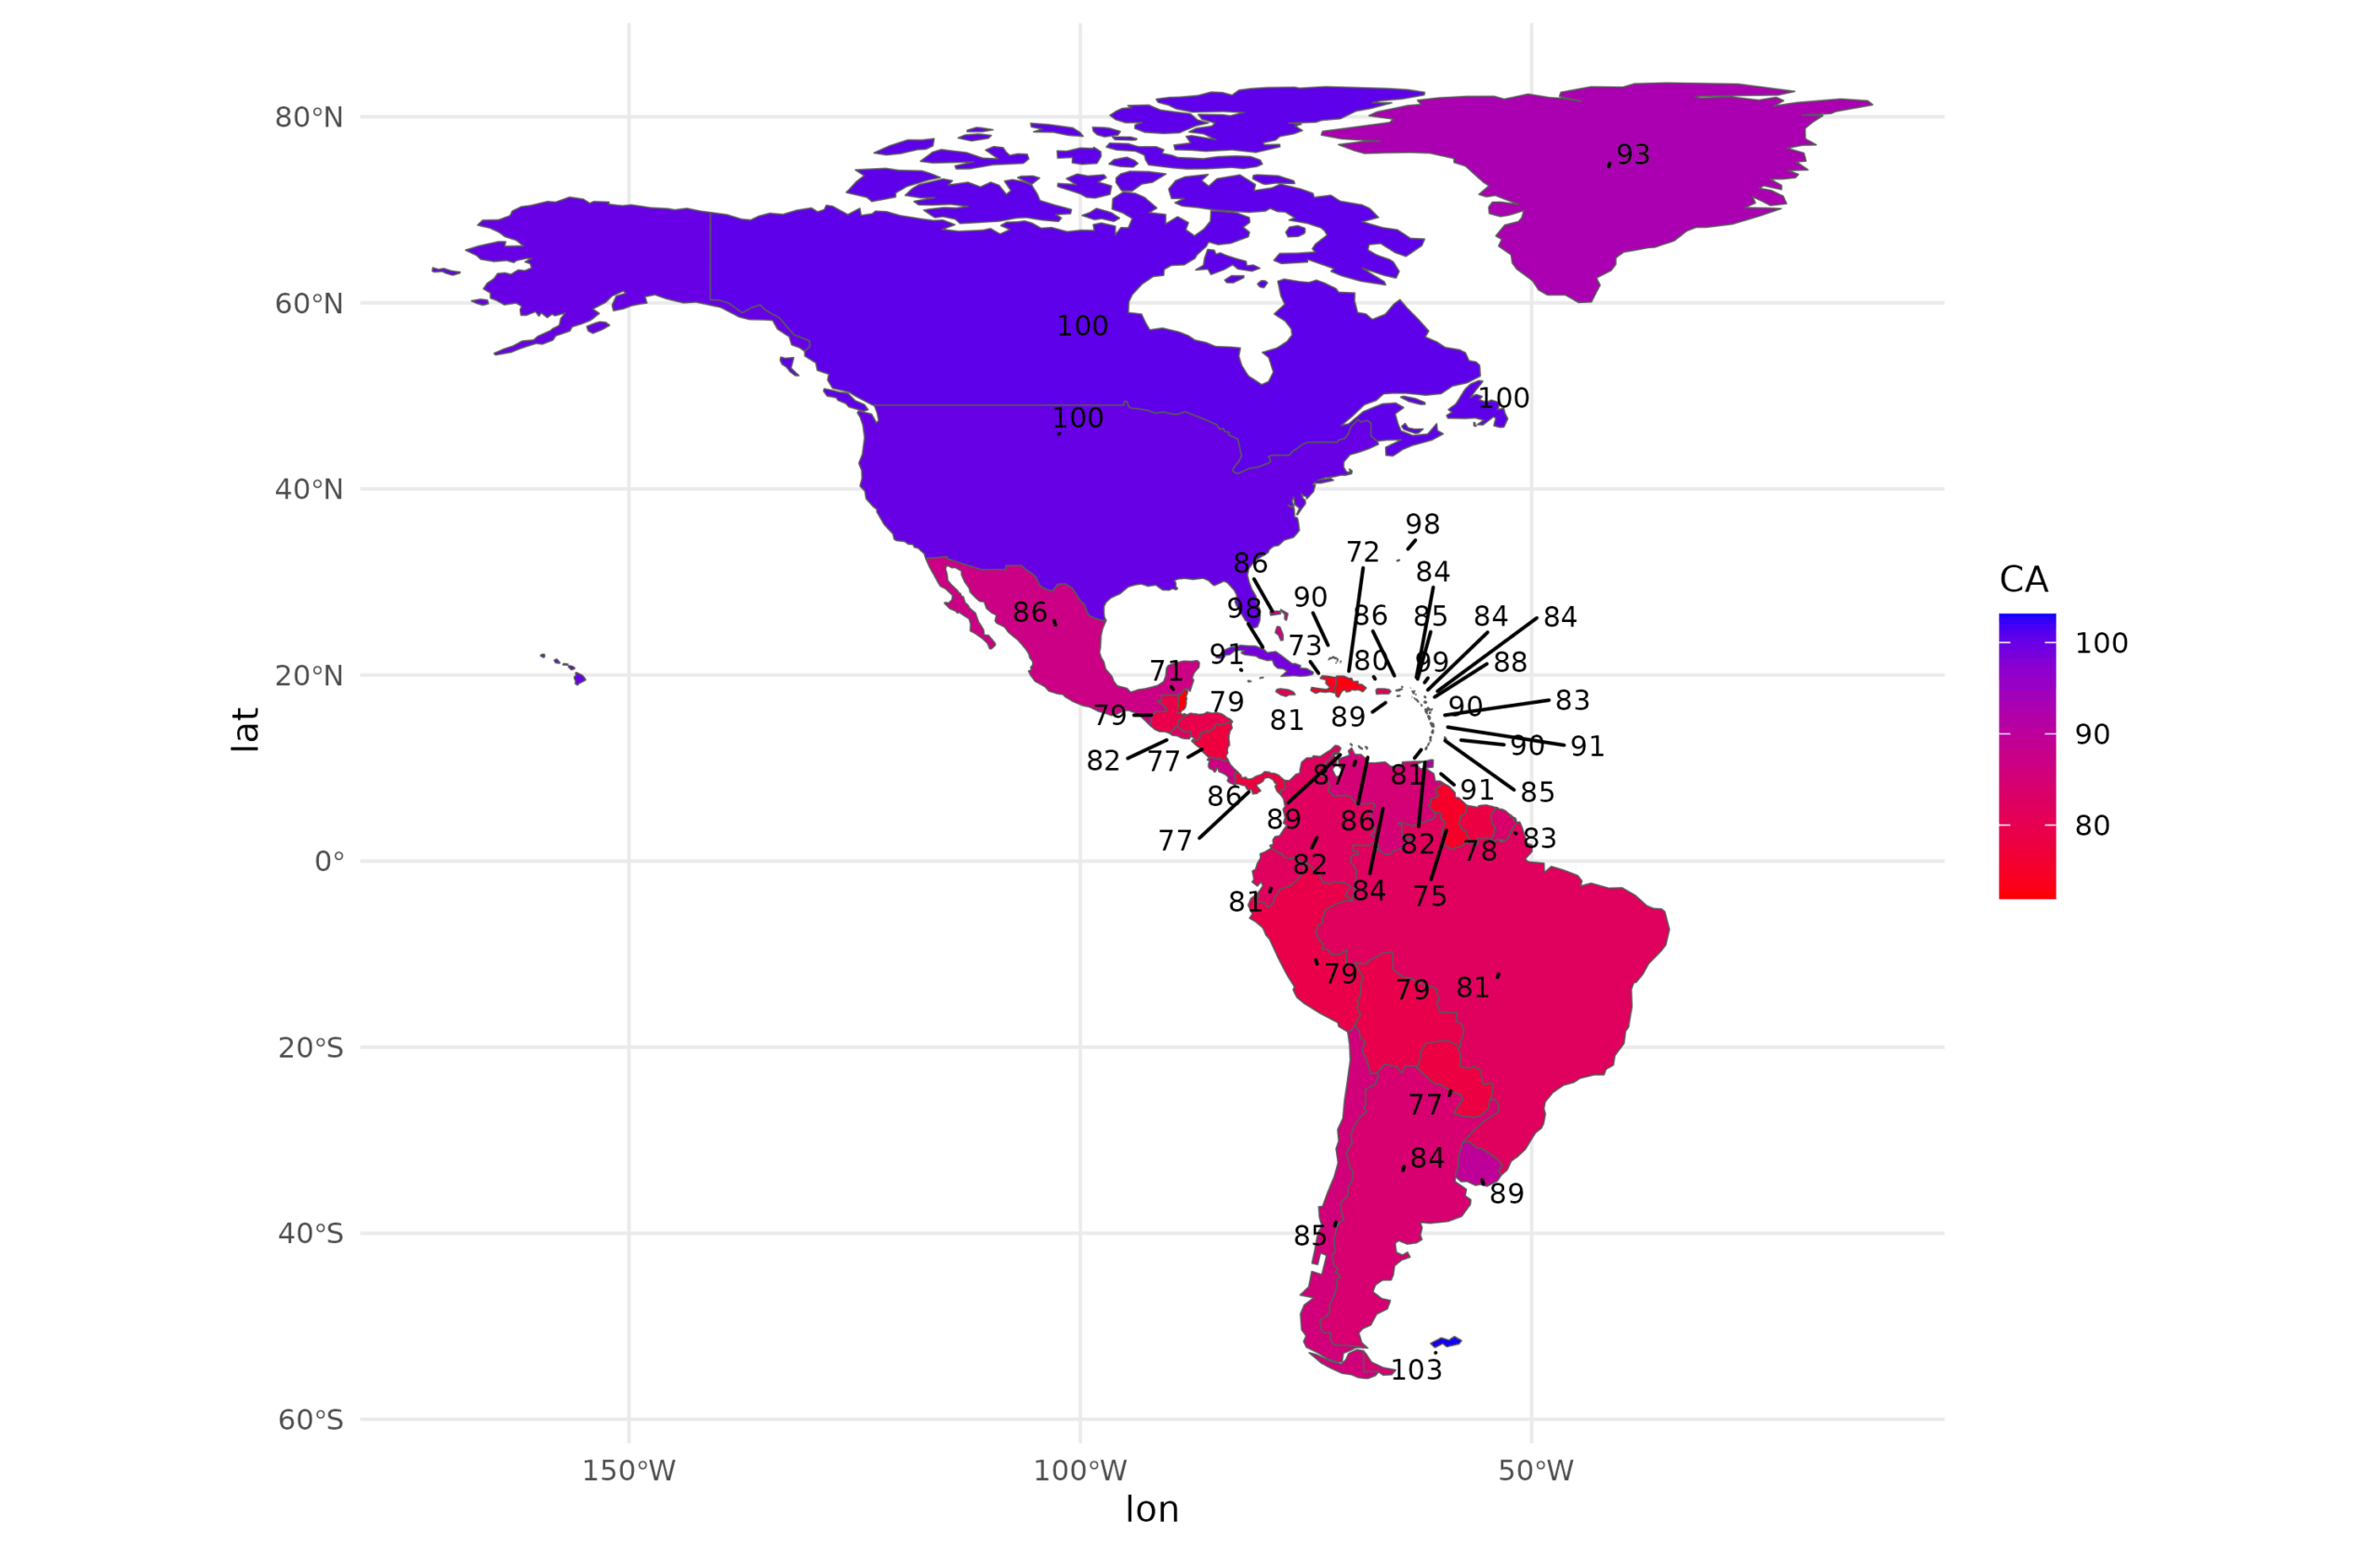
We also made maps of the distribution of cognitive ability, taken broadly as performance on standardized tests. This may or may not be a clear g-factor difference (since this depends on the measurement being measurement invariant as and the differences being on g á la Spearman’s hypothesis), but it is definitely a performance difference and it is probably mostly g:
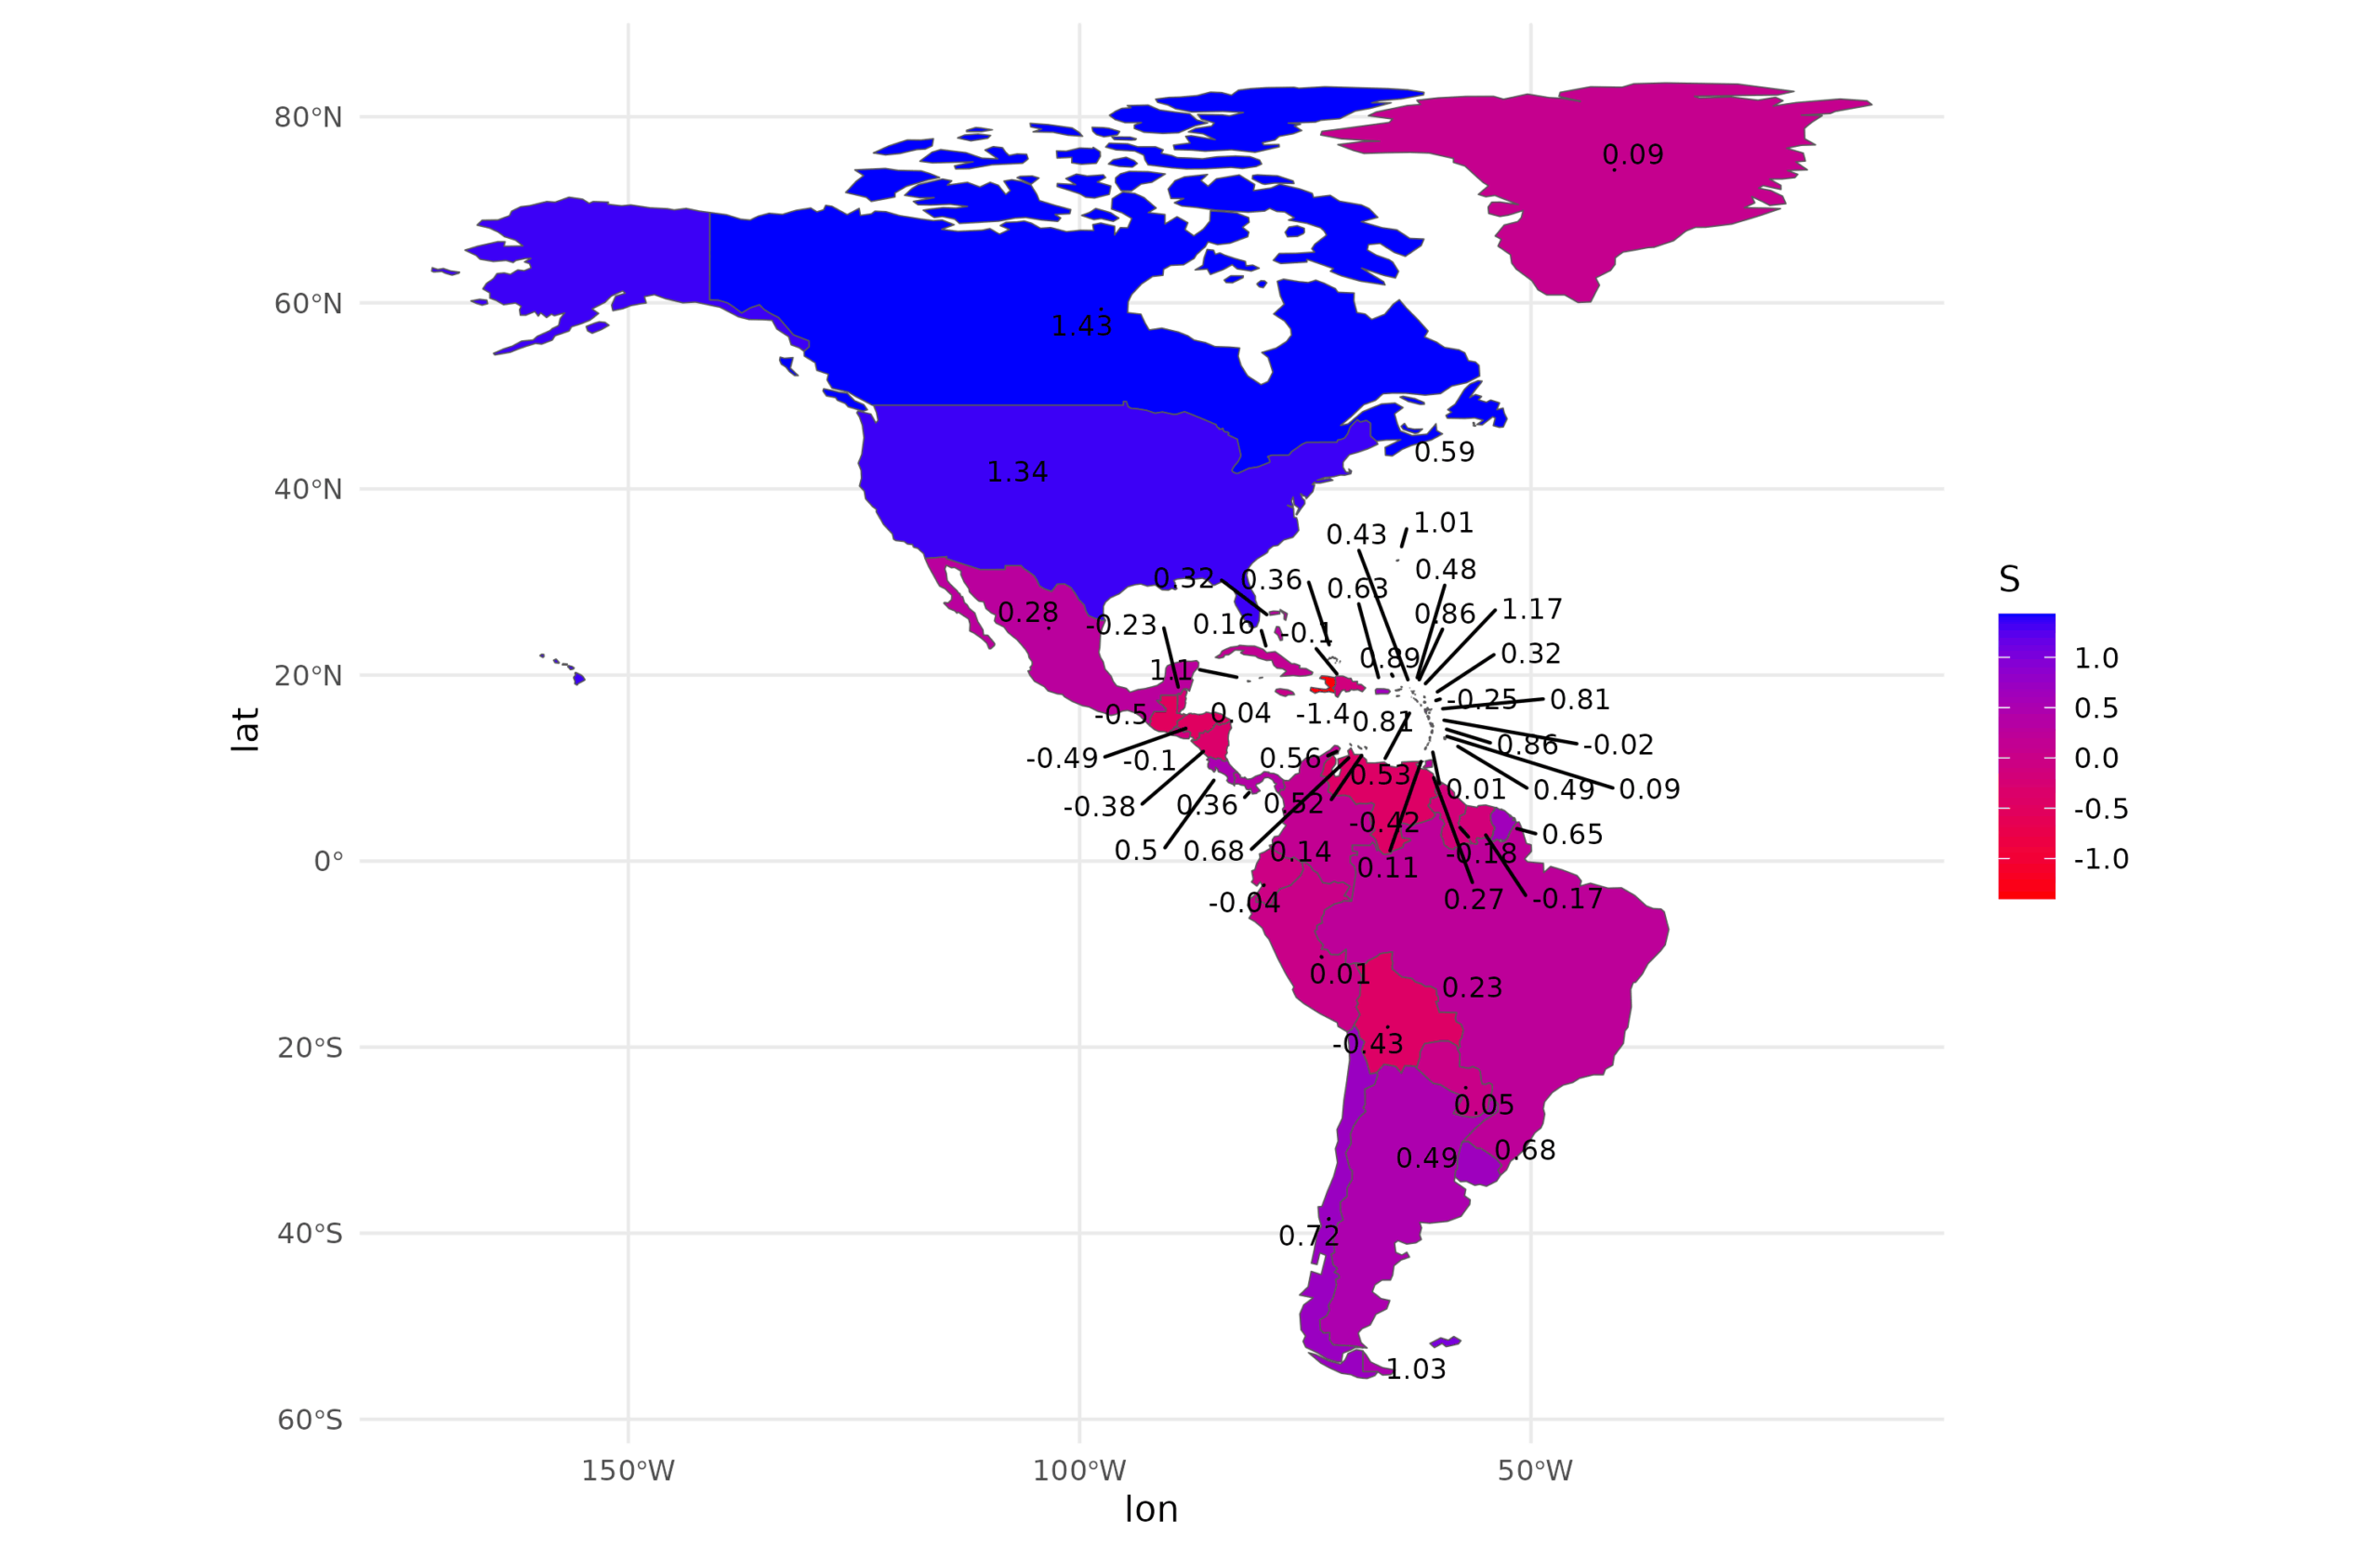
And socioeconomic development. This was measured using whatever composite indexes could be found for the particular units (often some kind of poverty index), and internationally it was based on Seb Jensen’s worldwide results. The data are scaled into the international units, so a score of -1 is 1 standard deviation below international country-level average (in international SD units):
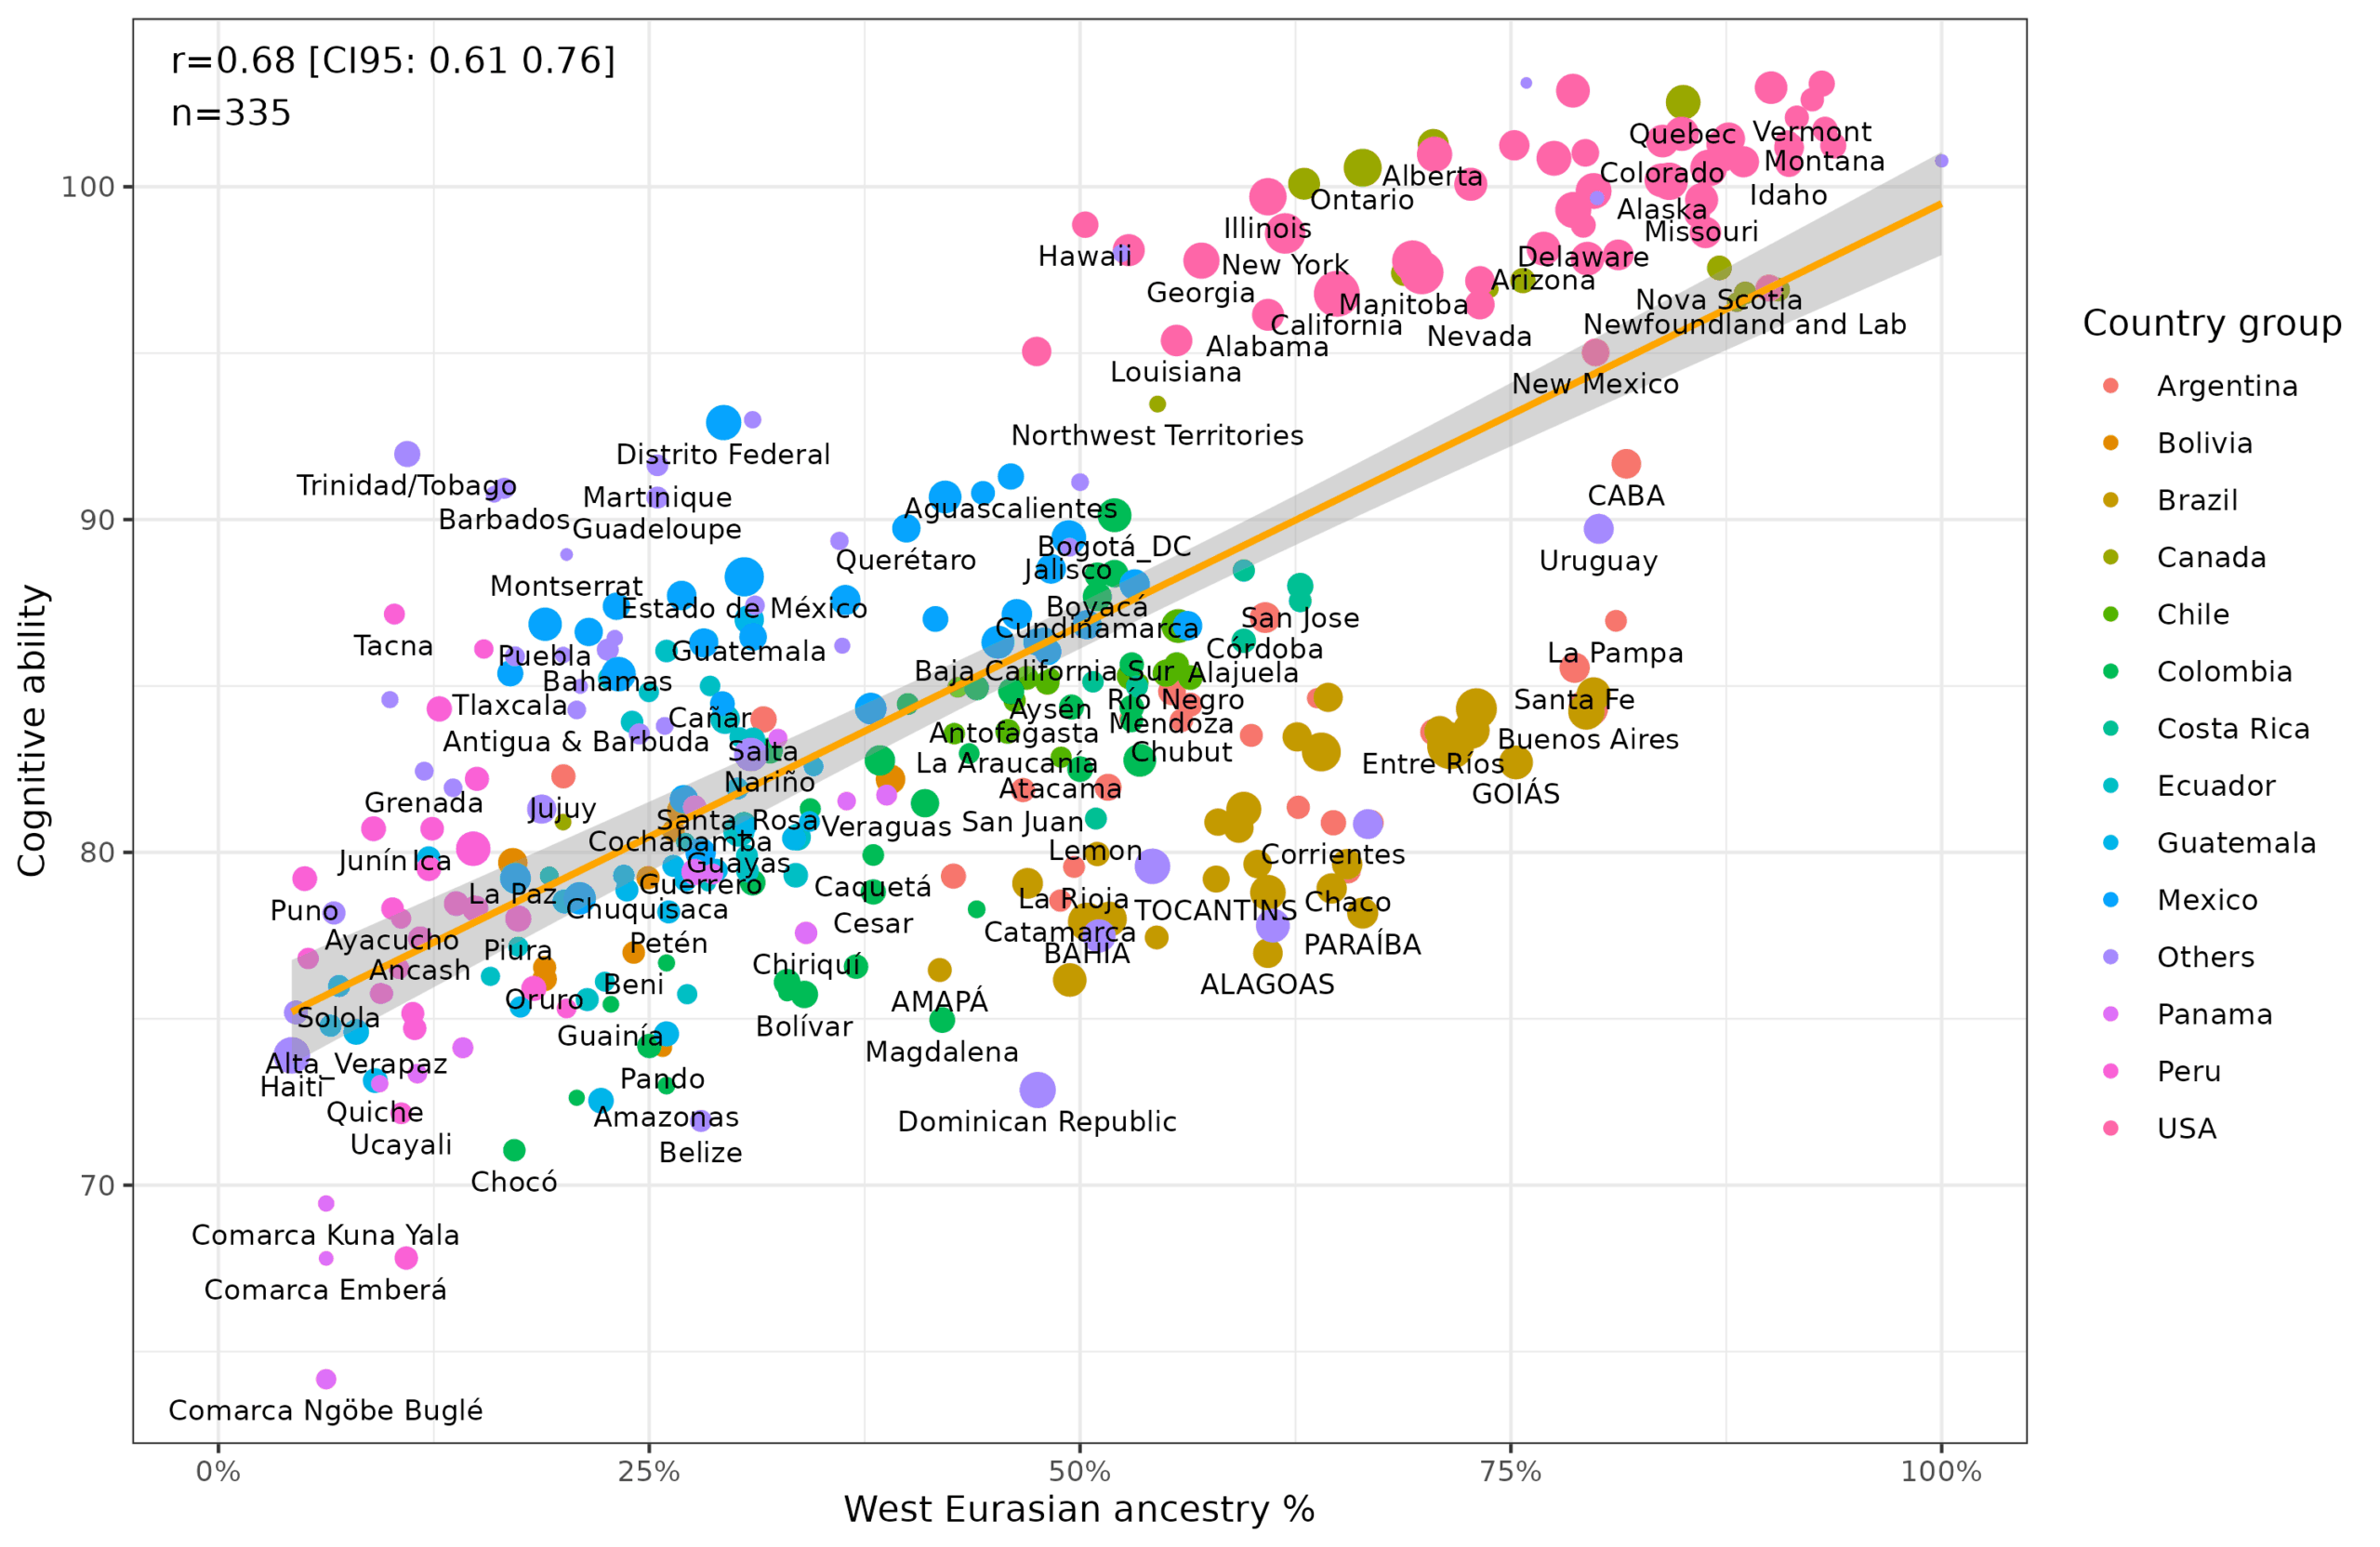
Armed with such data, one can make some basic regressions in the form of scatter plots. Here’s W. Eurasian (mostly European) vs. cognitive ability:
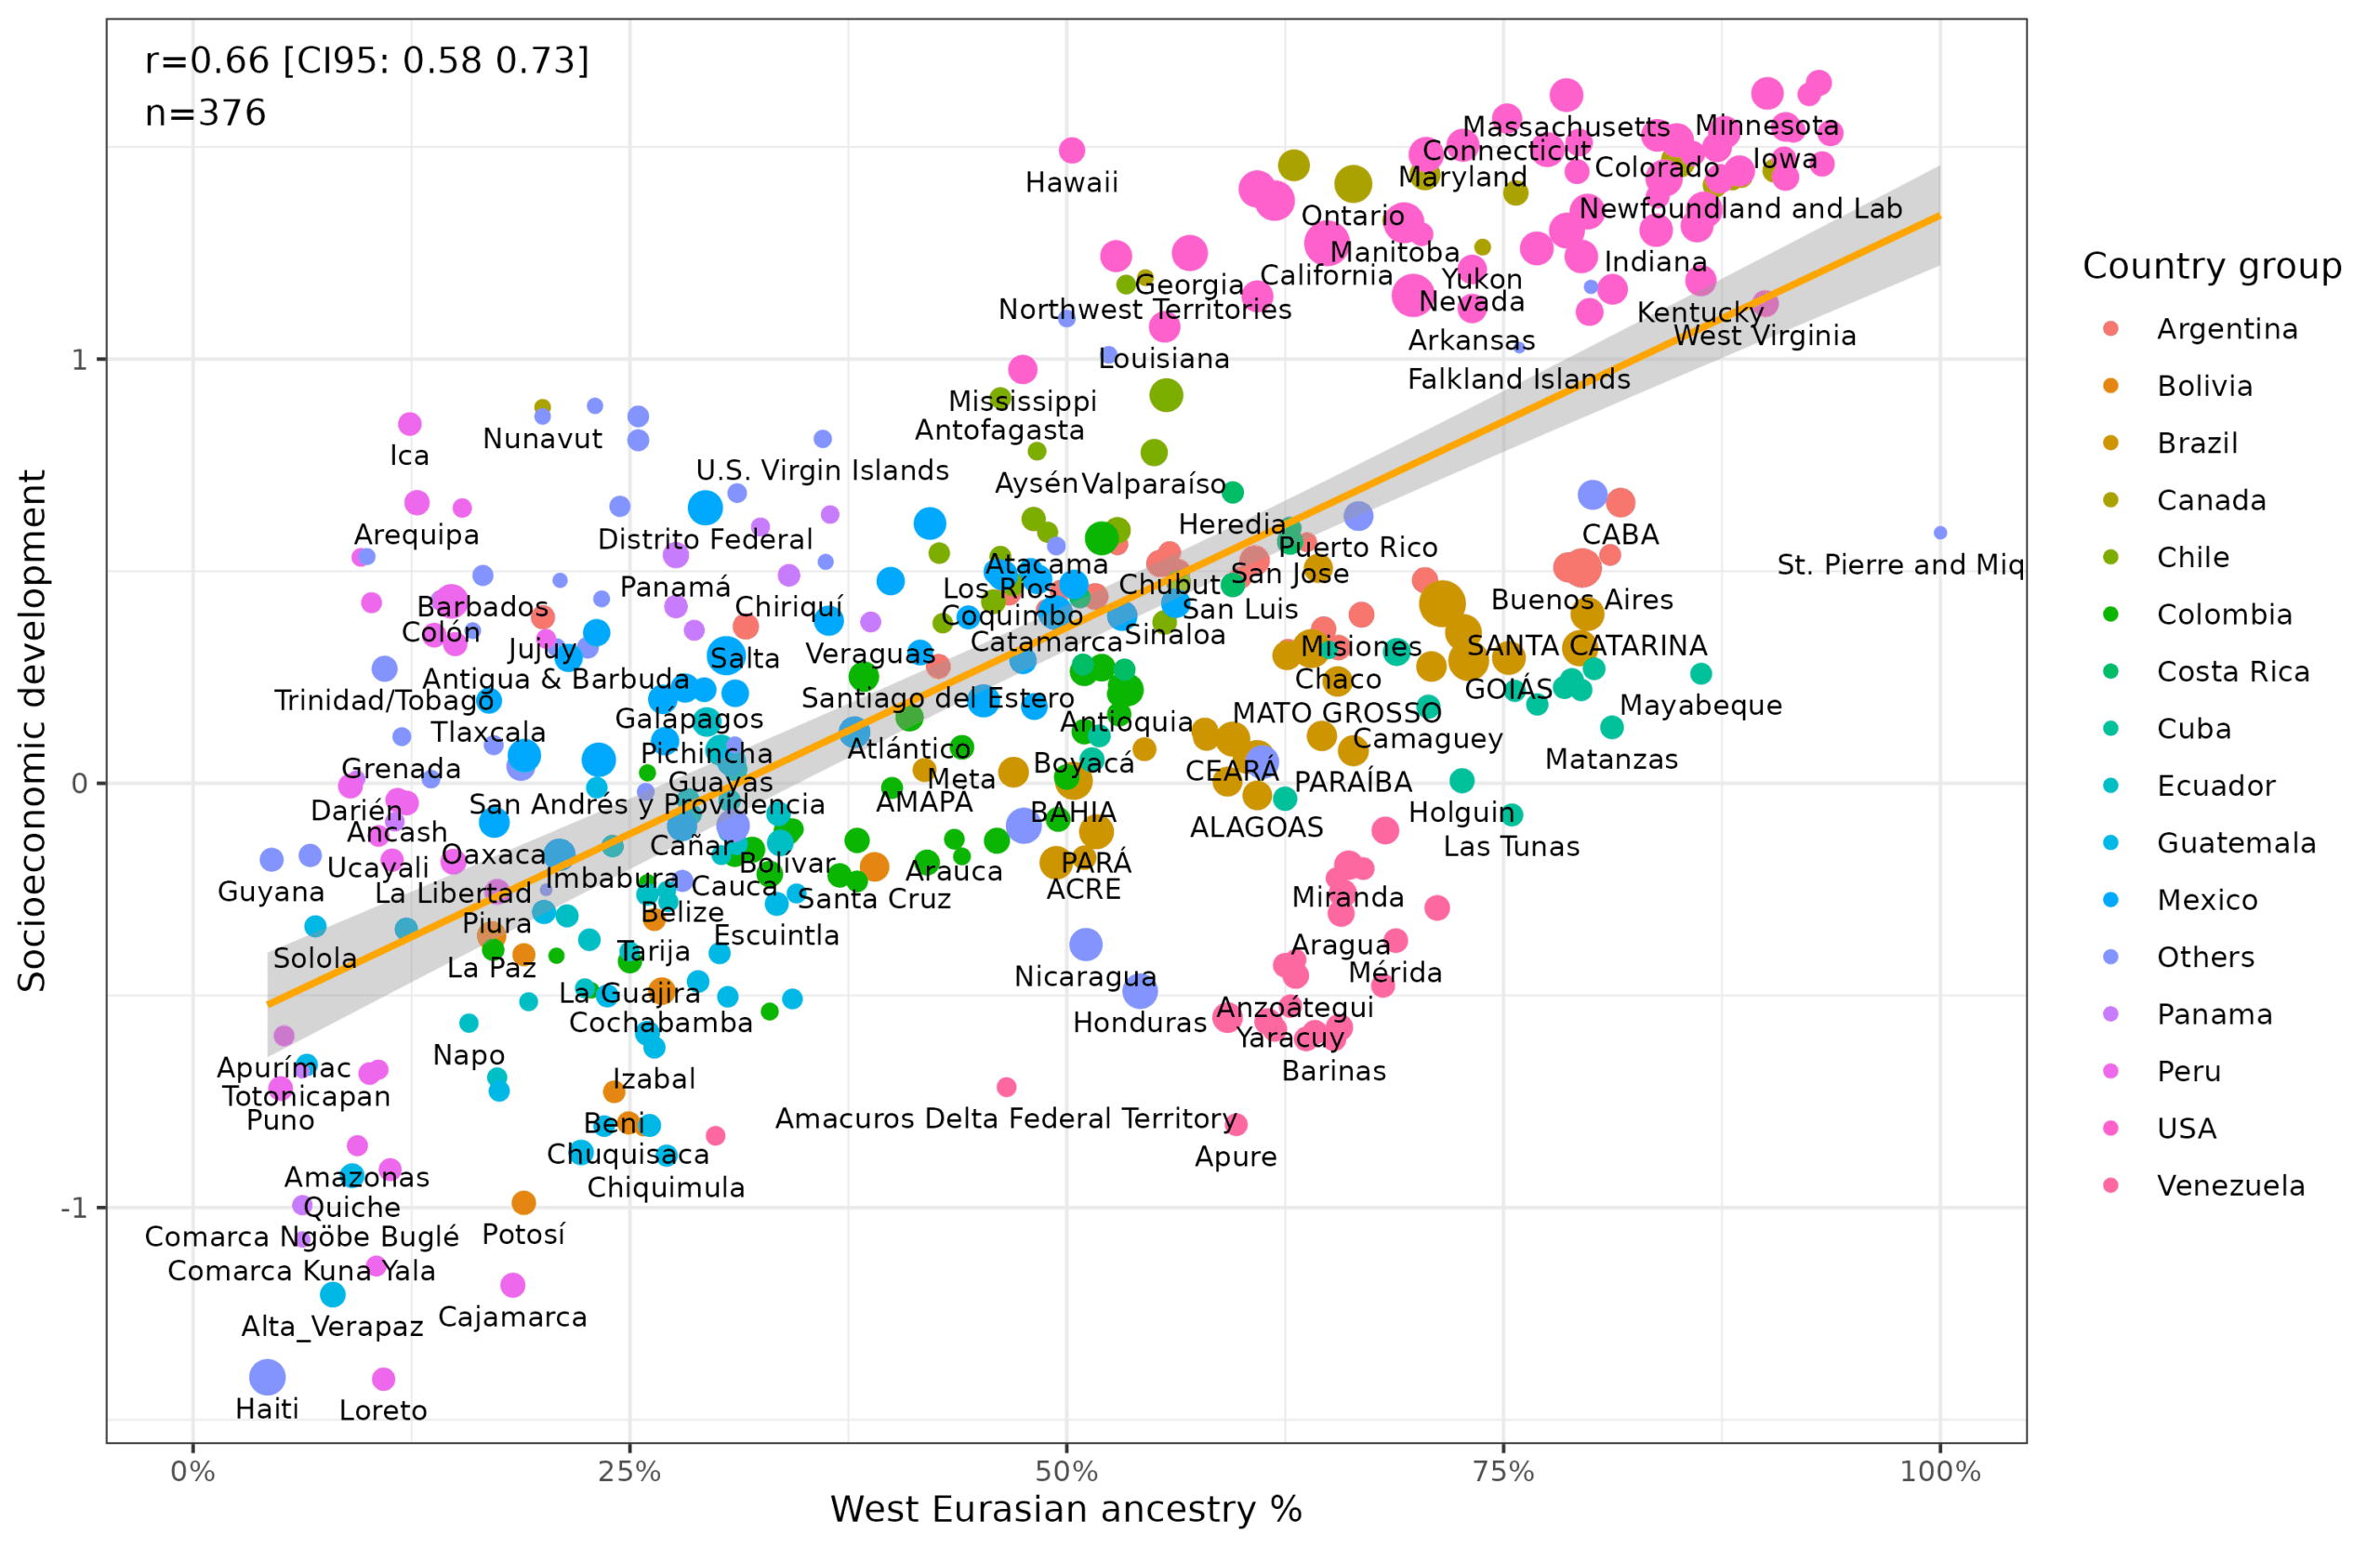
And W. Eurasian vs. socioeconomic development:
And socioeconomic development as a function of cognitive ability:
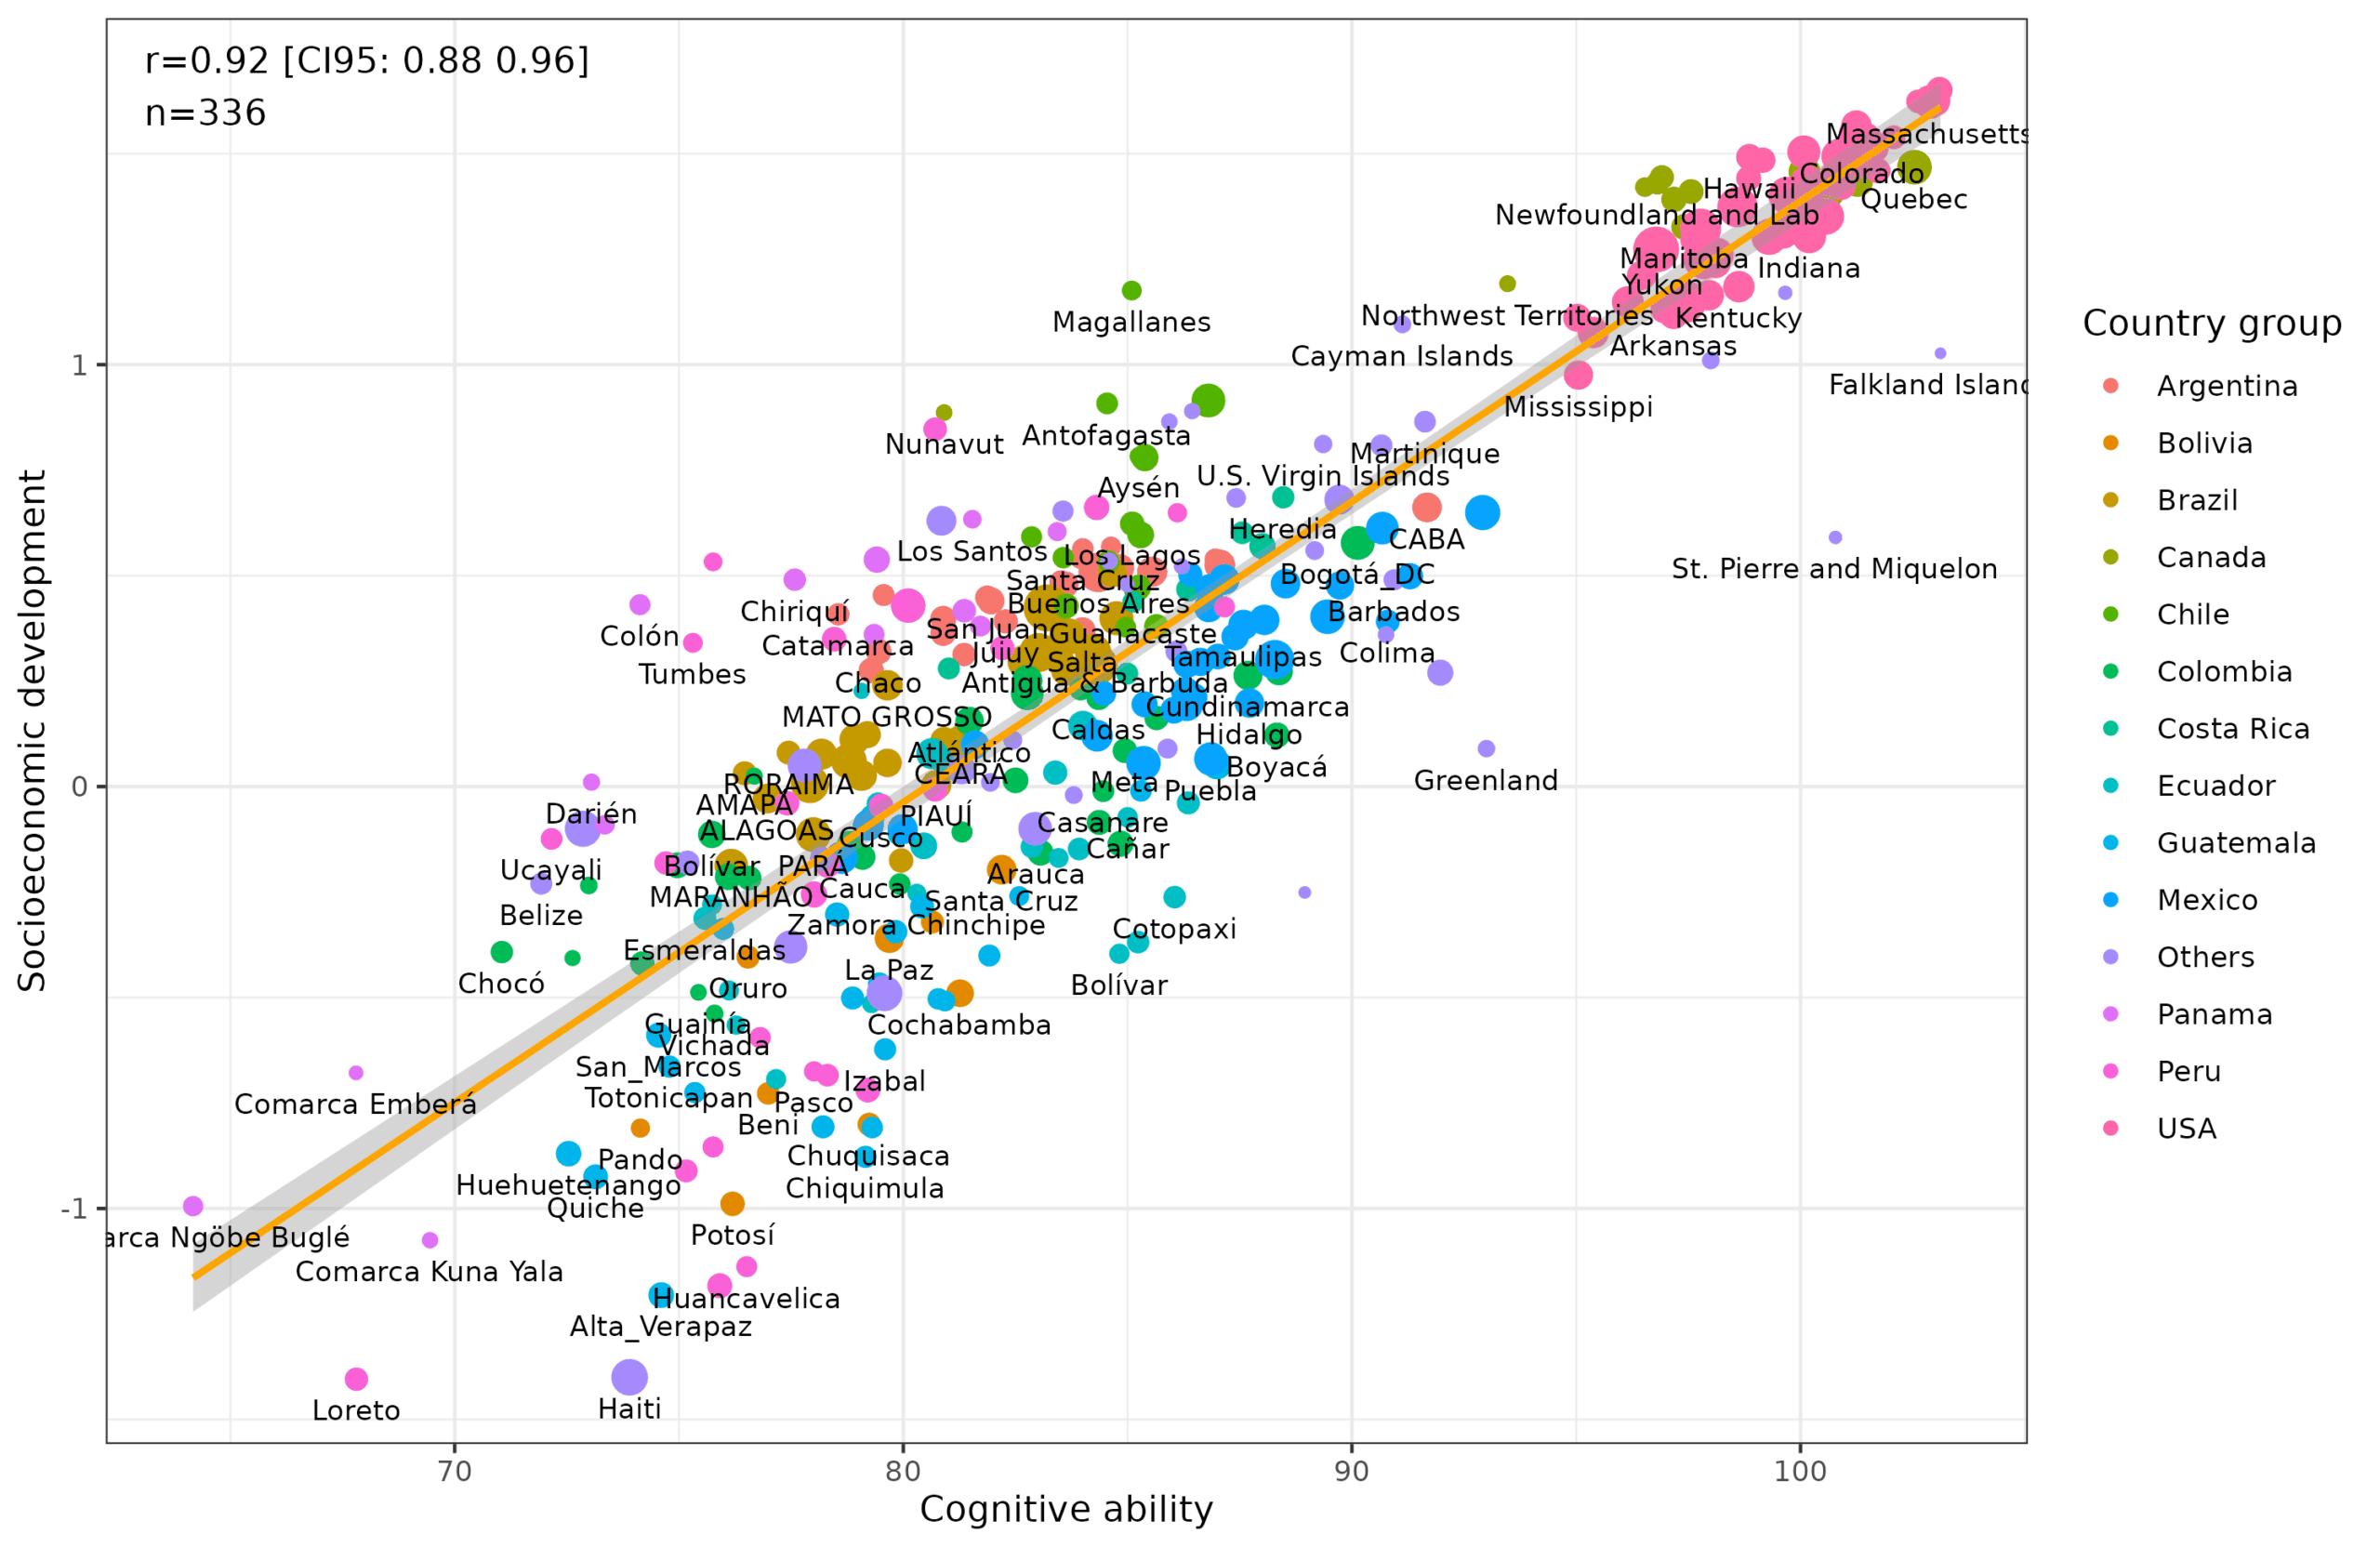
The latter is particularly strong because the presence of subnational with similar values to the countries duplicates the signal, so to say. Note that when we include subnational units for a country, the country itself is not included. E.g., “United States” is not included in the plot because its states/territories are, but Haiti is because we don’t have subnational data for Haiti.
Next up, we can once again thank Lyman Stone for so frequently being wrong in clear ways, that we can use his words as a lead:
in fact, national IQ’s predictiveness of GDP is often very weak within-region, i.e. within-ancestry-groups. measurement error is obviously a plausible part of this, but it also just tells us that whatever is happening with national IQs, they *might* explain why Europe and East Asia are rich and Africa isn’t, but they probably *won’t* explain why some East Asian countries are richer than others. they don’t much outperform just having categorical variables for major regions.
Naturally, if average IQs don’t predict well within world regions, they can’t predict well within countries either, at least, so one might think based on his words. So what does it look like? Here’s W. Eurasian ancestry and cognitive ability using within-country variation:
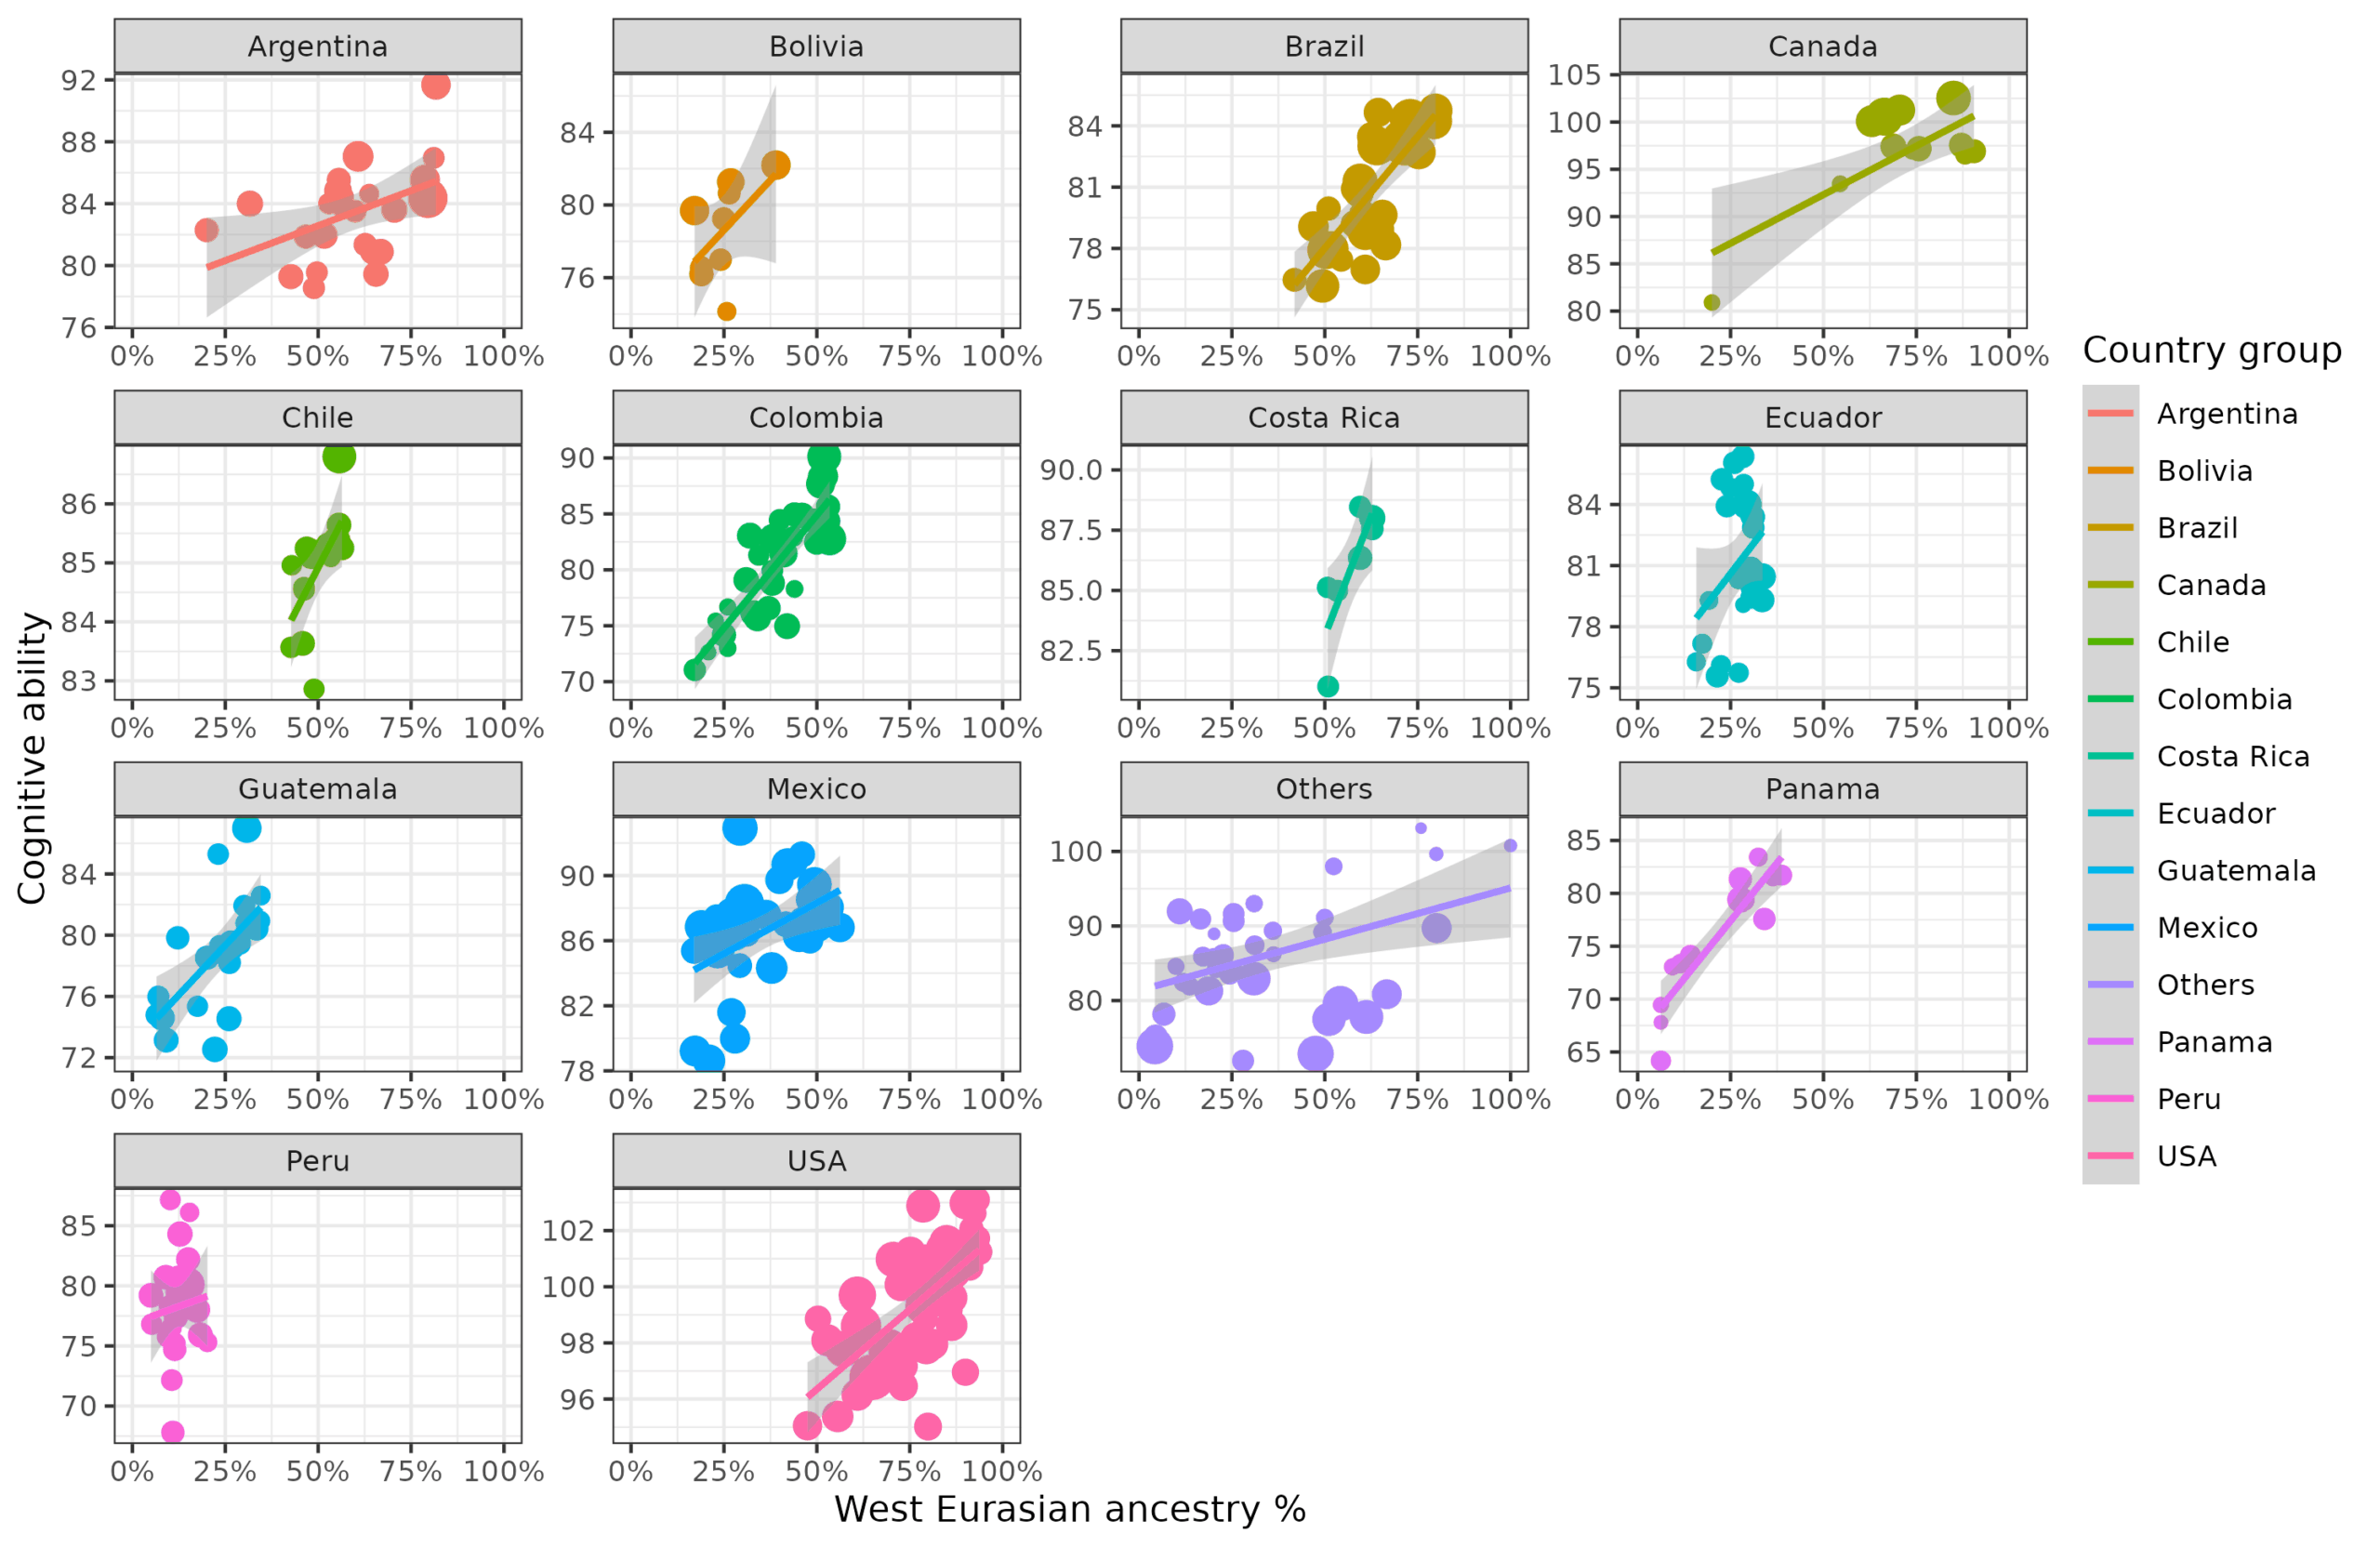
Note the scales are held constant to aid interpretation since otherwise they would change quite a lot. For instance, no unit in Peru has more than 25% W. Eurasian ancestry while no unit in USA has less than 45% or so. The sizes of the dots are proportional to the square roots of the population sizes. Here’s the same within-country plot for socioeconomic development and W. Eurasian ancestry:
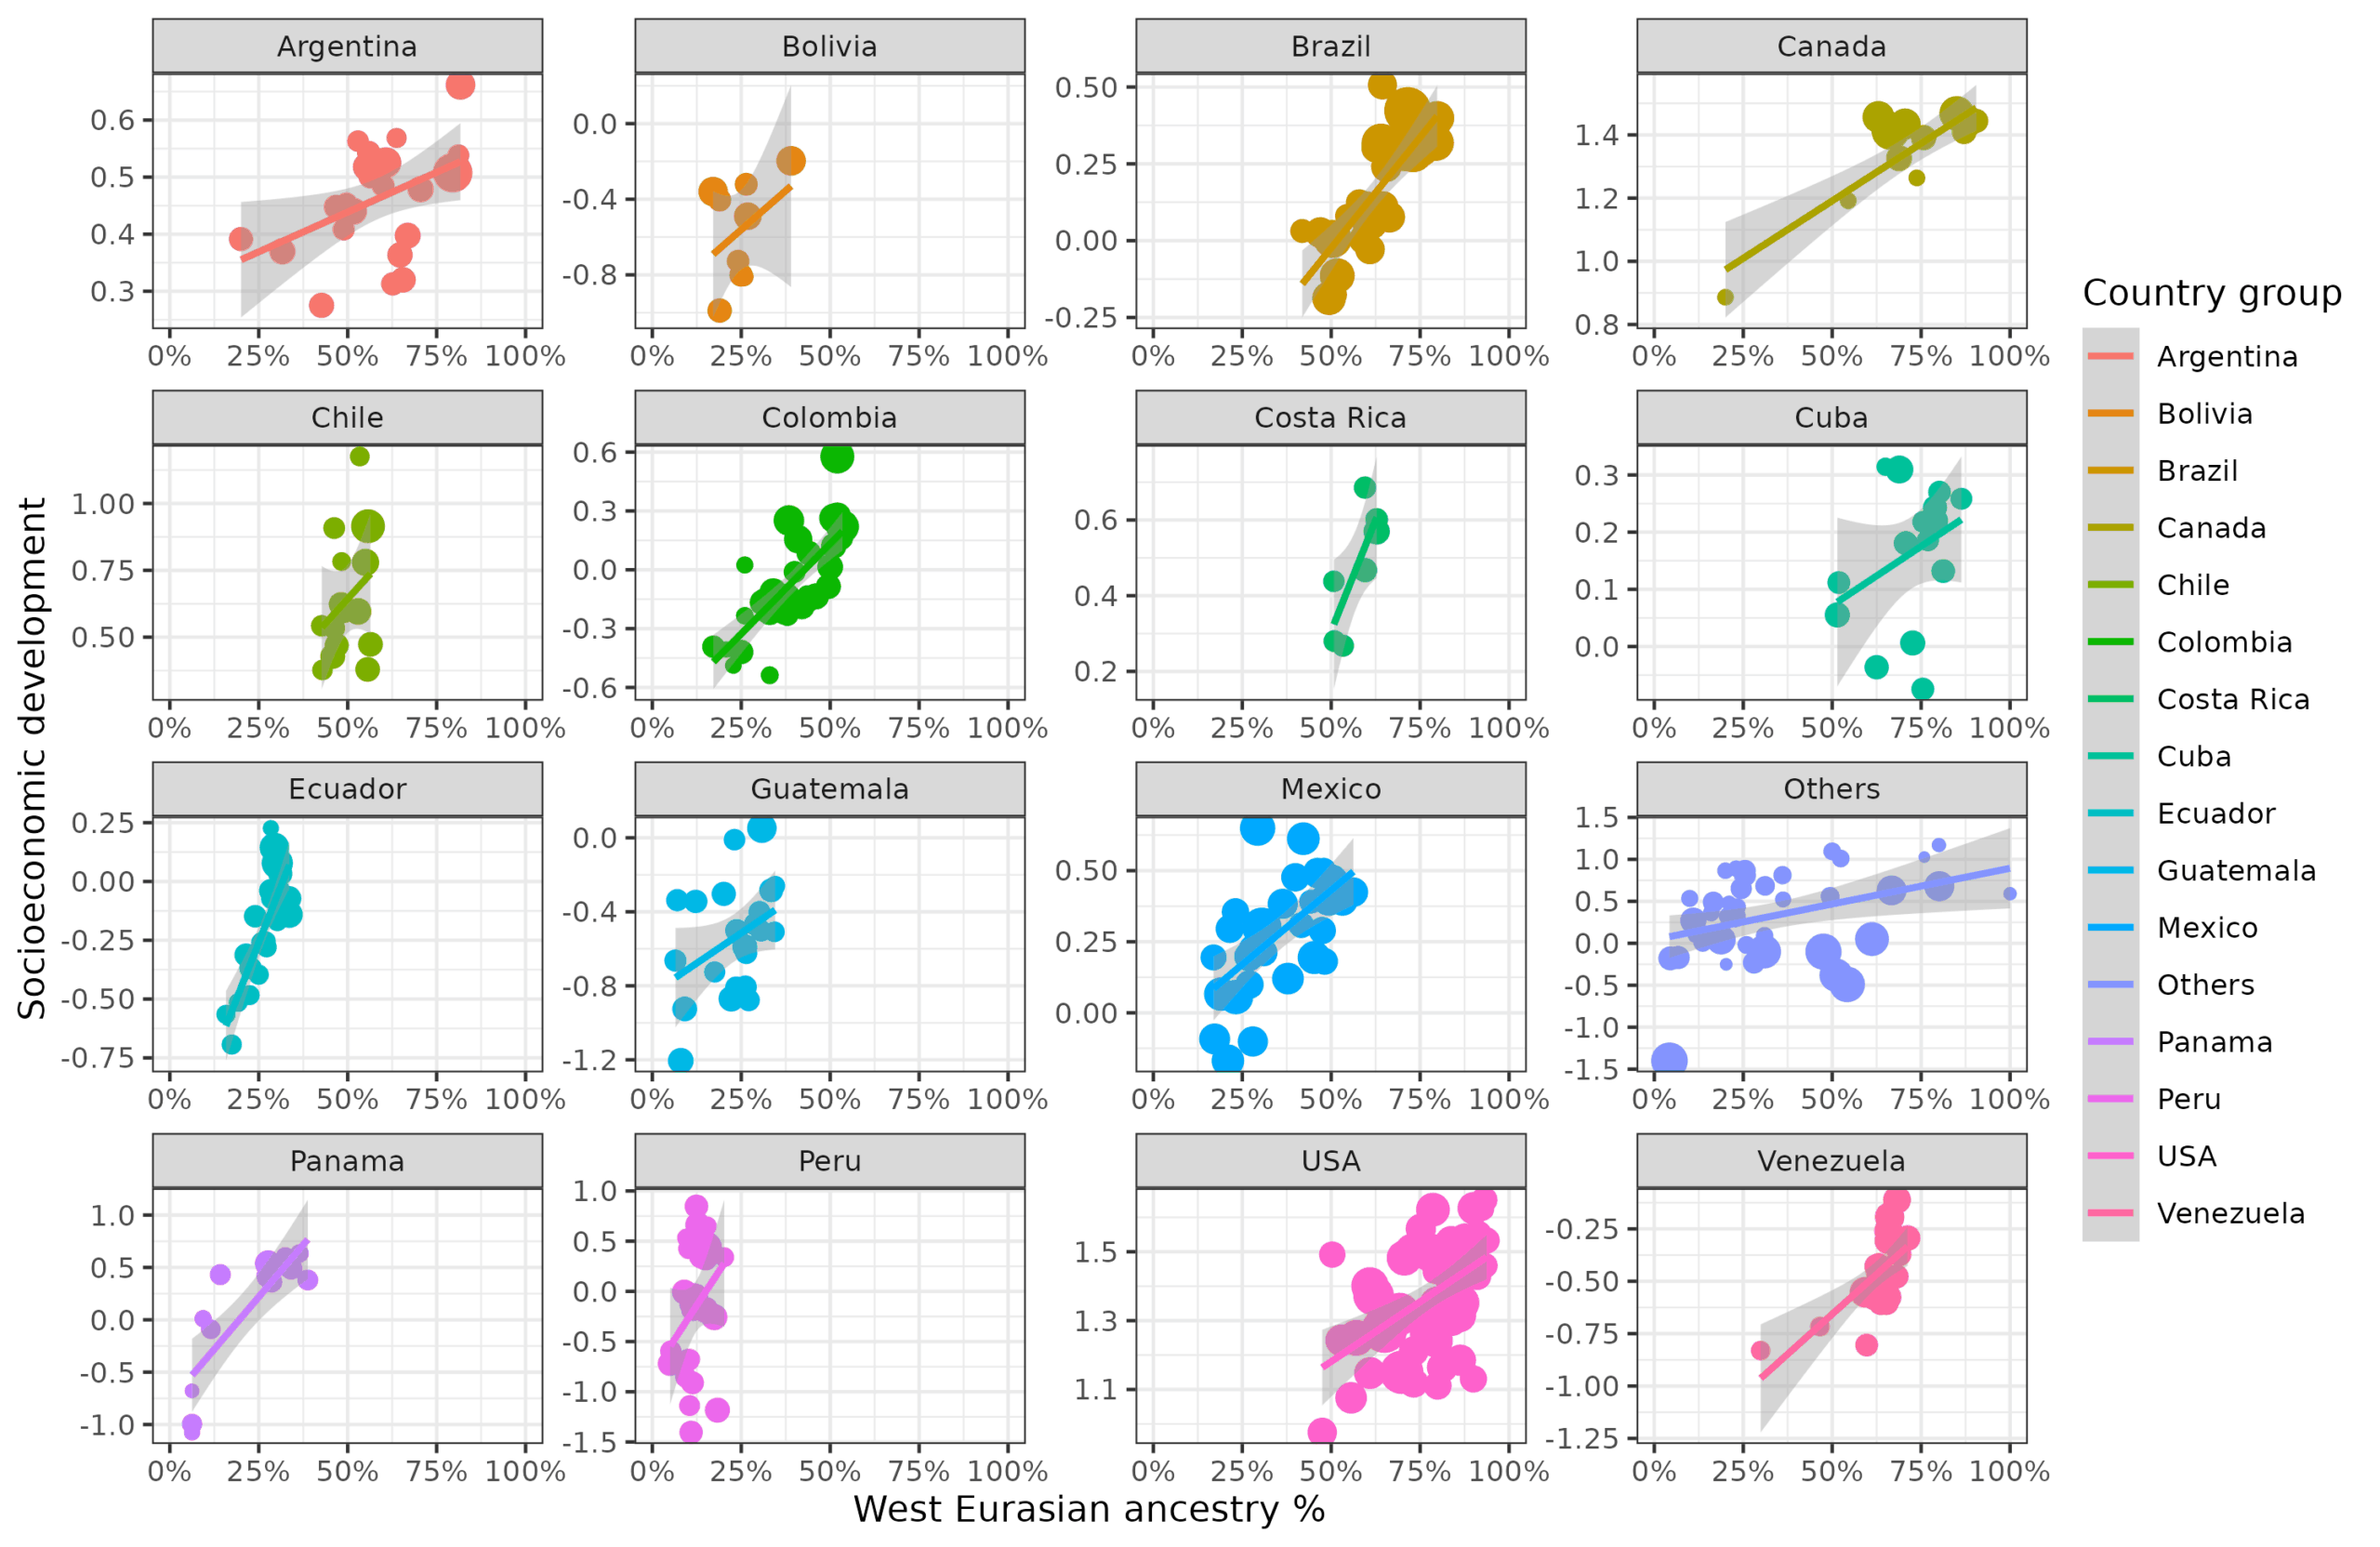
And cognitive ability and socioeconomic development:
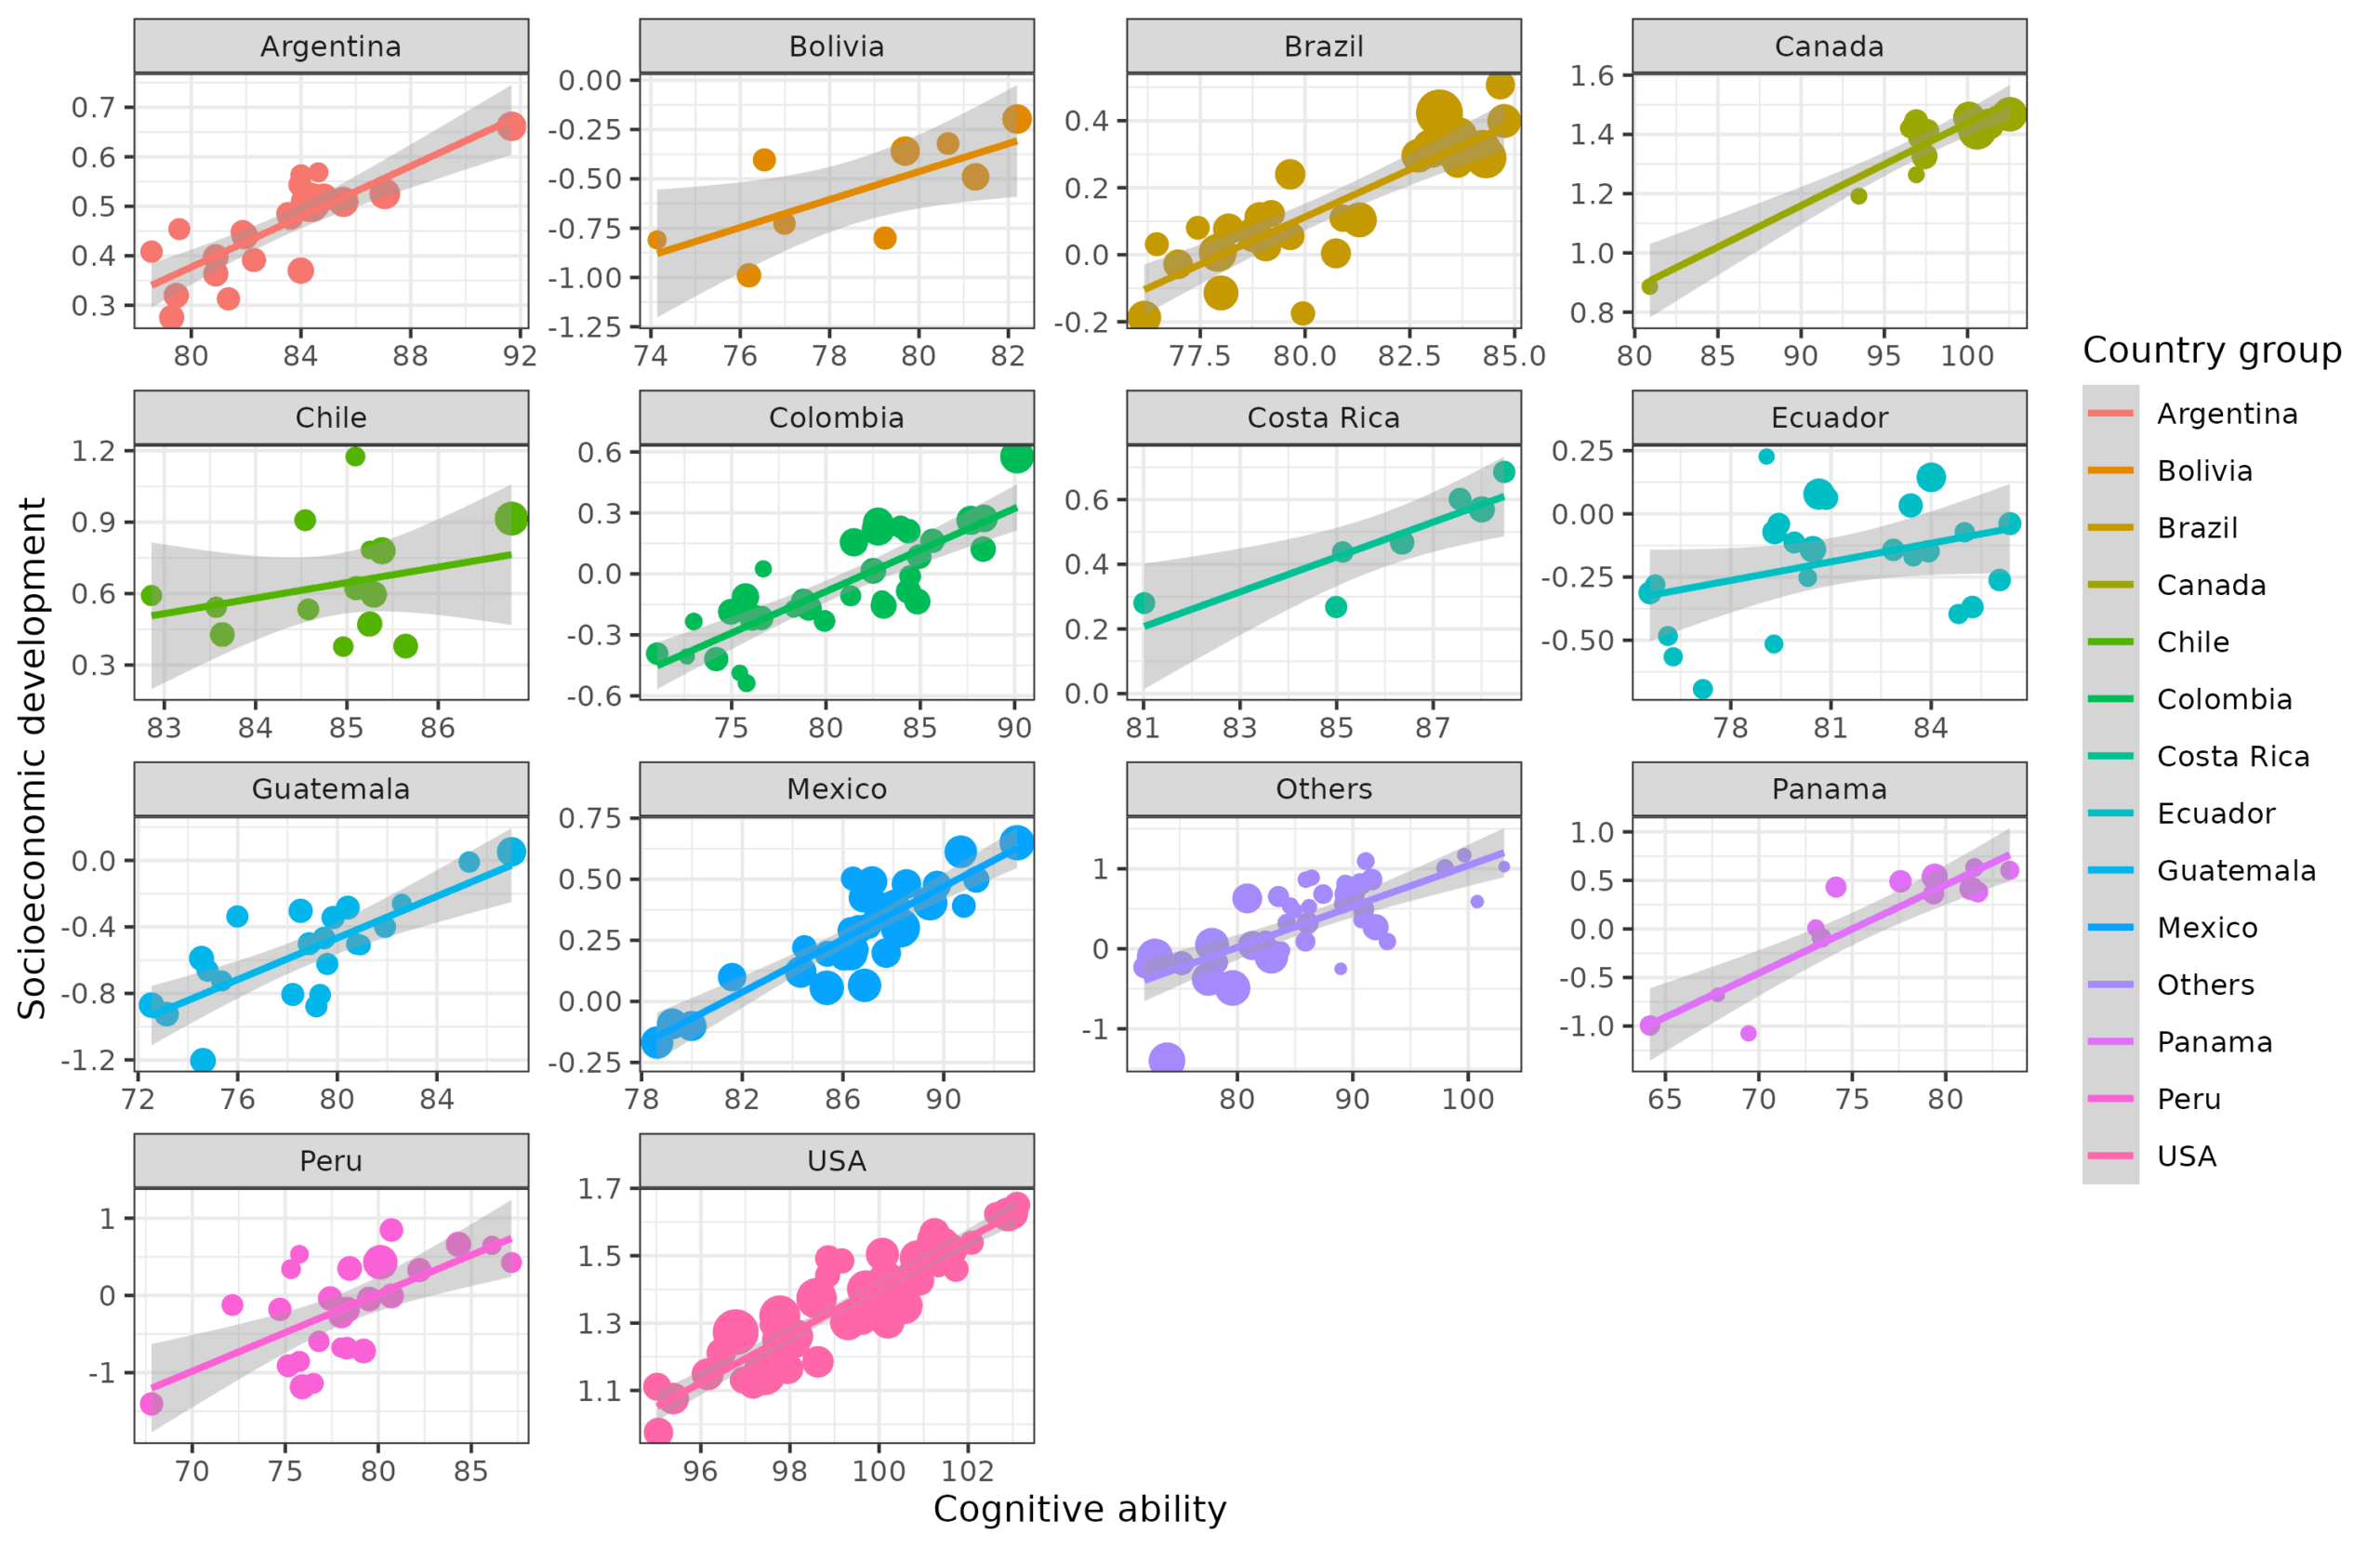
Clearly, these associations by and large hold up within countries too, just as they do overall within the Americas, which I guess Lyman Stone could consider one world region (the Americas) or two (north & south America).
These are just plots showing relationships without controls, aside from the ones using country-fixed effects. We can also do some regressions:
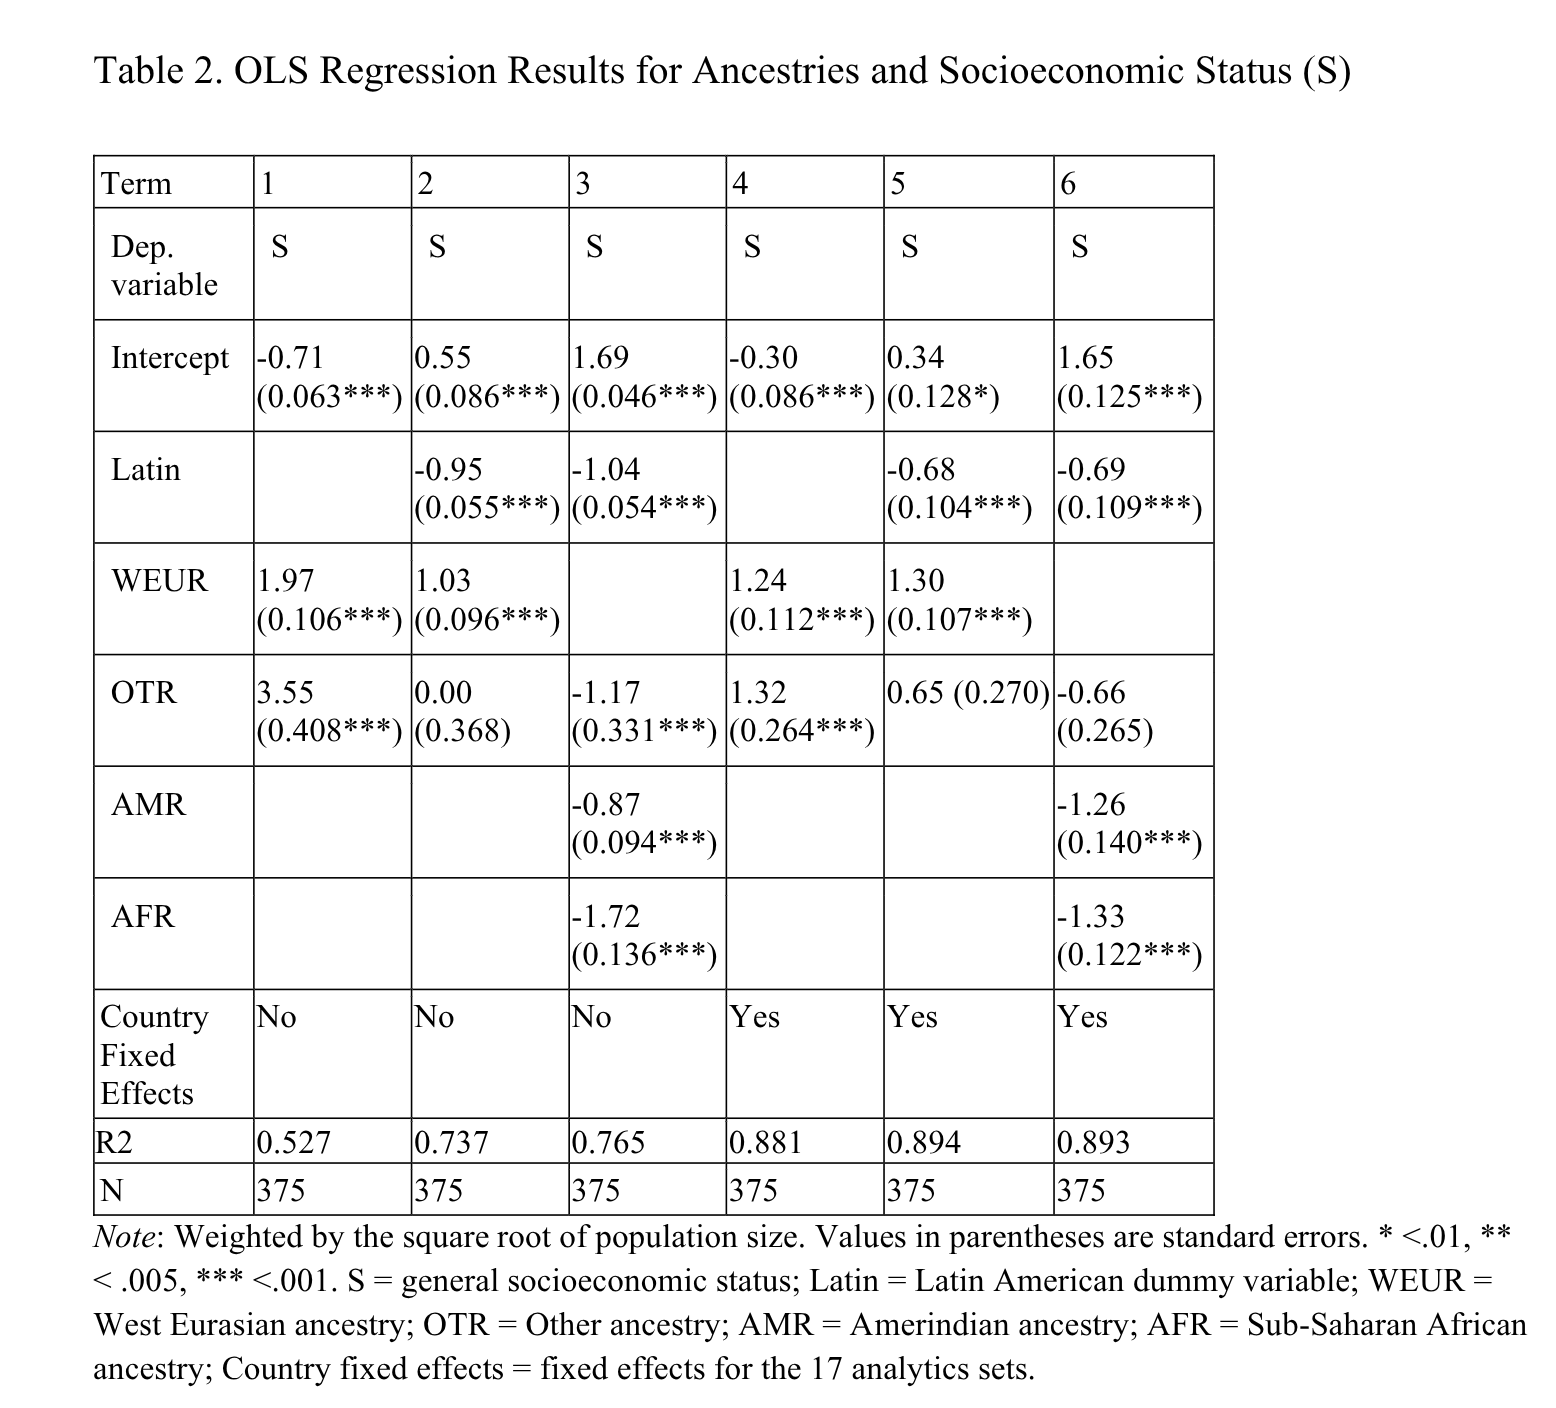
Here we use OLS to predict socioeconomic development of the full set of units, of which there are 375 (depends on the model). The first 4 models omit country dummies, and the latter 4 add them. Models 5 and 6 contrast whether we focus on W. Eurasian ancestry or the others. One cannot include all 4 ancestries in the same model because they sum to 1, so at least one must be left out. The ancestries left out serve as the reference. So in model 5 we see that compared to African and Amerindian ancestry, W. Eurasian predicts 1.30 SD higher level of development. What this means is that if we changed a hypothetical country from 0% to 100% W. Eurasian ancestry (and thus 100% to 0% African/Amerindian), the country would go up 1.30 SD in socioeconomic development. This is about the difference between USA and the world average (cf. the scatter plot above). On the other hand, if we are wondering whether it is OK to assume African and Amerindian ancestry have the same expected values, we can see in model 6 that they obtain betas of -1.26 and -1.33. Since W. Eurasian is left out here, it means that if one took a country and magically changed the population from 100% W. Eurasian to 100% African/Amerindian, the development would decline by about 1.30 SD. This is the same as what model 5 tells us. The models also show a moderate to strong effect of being Latin. This variable is open to interpretation. It can mean that W. Eurasian ancestry in Latin countries don’t have the same expectation because it is chiefly south European ancestry, or because there was negative selection into Latin countries (or positive selection out of them), or it can mean that Latin culture is bad for development ancestry aside, or some kind of negative cultural legacy from south Europe, or North American exceptionalism. Or something else, we can’t say with these data.
We can do the same models for cognitive ability as the outcome instead:
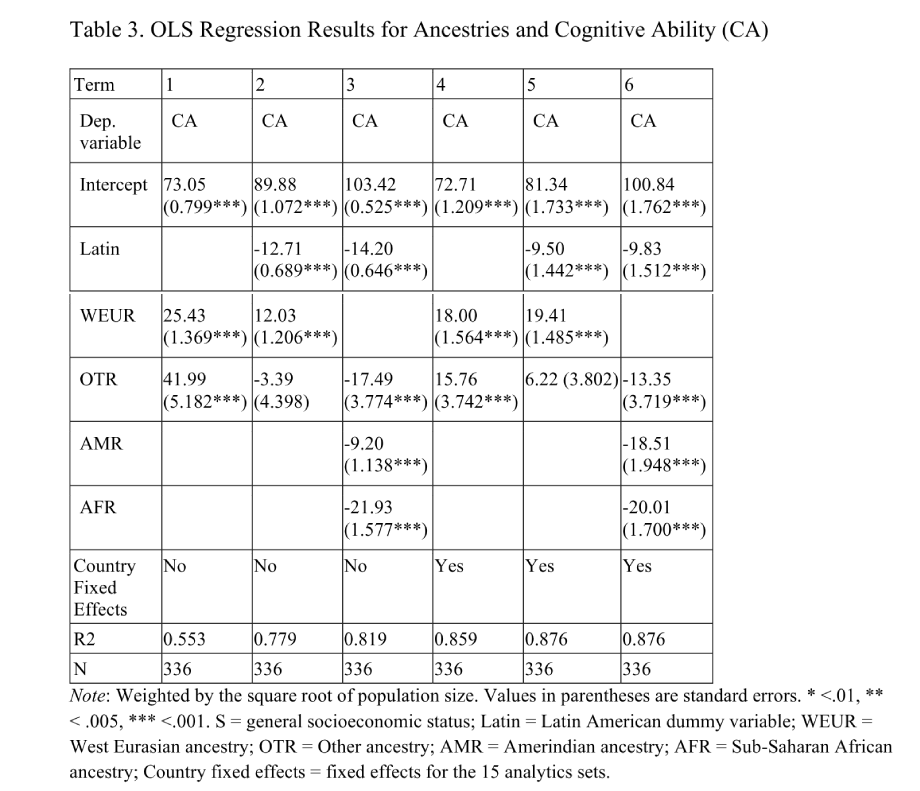
The data are scaled in British IQs (approximately). Thus, looking again at the last two models, we see that W. Eurasian ancestry has a slope of 19 IQ. The interpretation is the same as before: if we took a country that was 100% African/Amerindian country and magically changed it to 100% W. Eurasian, it would gain about 19 IQ. Model 6 tells us the opposite, that starting with a 100% W. Eurasian country and changing it to 100% Amerindian would reduce IQ by 19, to 100% African by 20 IQ, and for “Other” ancestry by 13 IQ. In a naive interpretation, these tell you about the genotypic mean IQs of these ancestries, which would be: 82 IQ for Amerindian, 80 IQ for African, and 87 for “Other”.
However, you might say, the data has residual spatial variation that isn’t captured by our controls. That’s true! This is the eternal problem of spatial autocorrelation in geographically based data. So we tried a spatial error model to account for this:
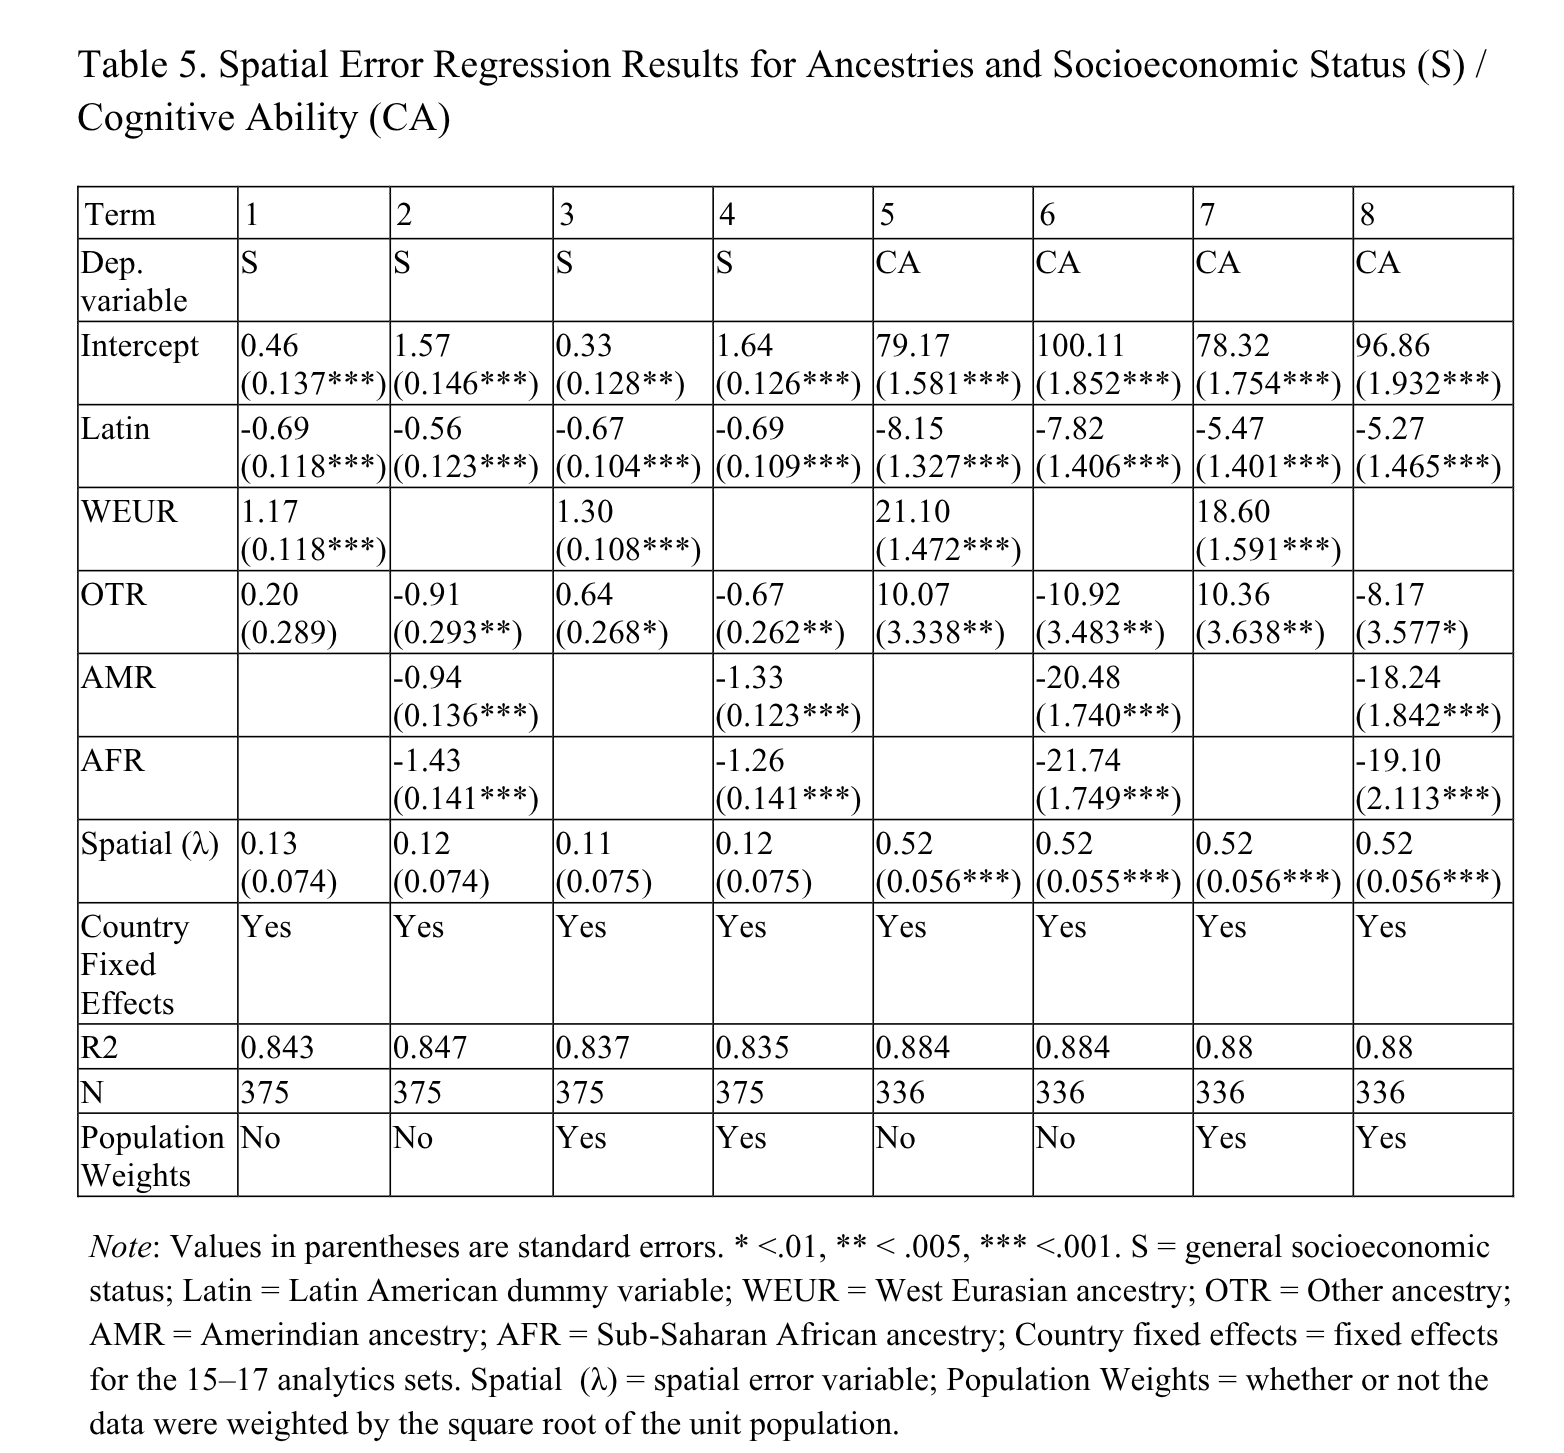
The spatial row is the strength of the residual spatial autocorrelation (in standardized units), which was weak for development but strong for IQs. Nevertheless, accounting for these spatially autocorrelated errors did not substantially change the findings, as the slopes remained about the same as before.
A variety of researchers have also forwarded models that particular aspects of the natural environment directly causes or maybe caused evolved differences net of ancestry, so we tried these too:
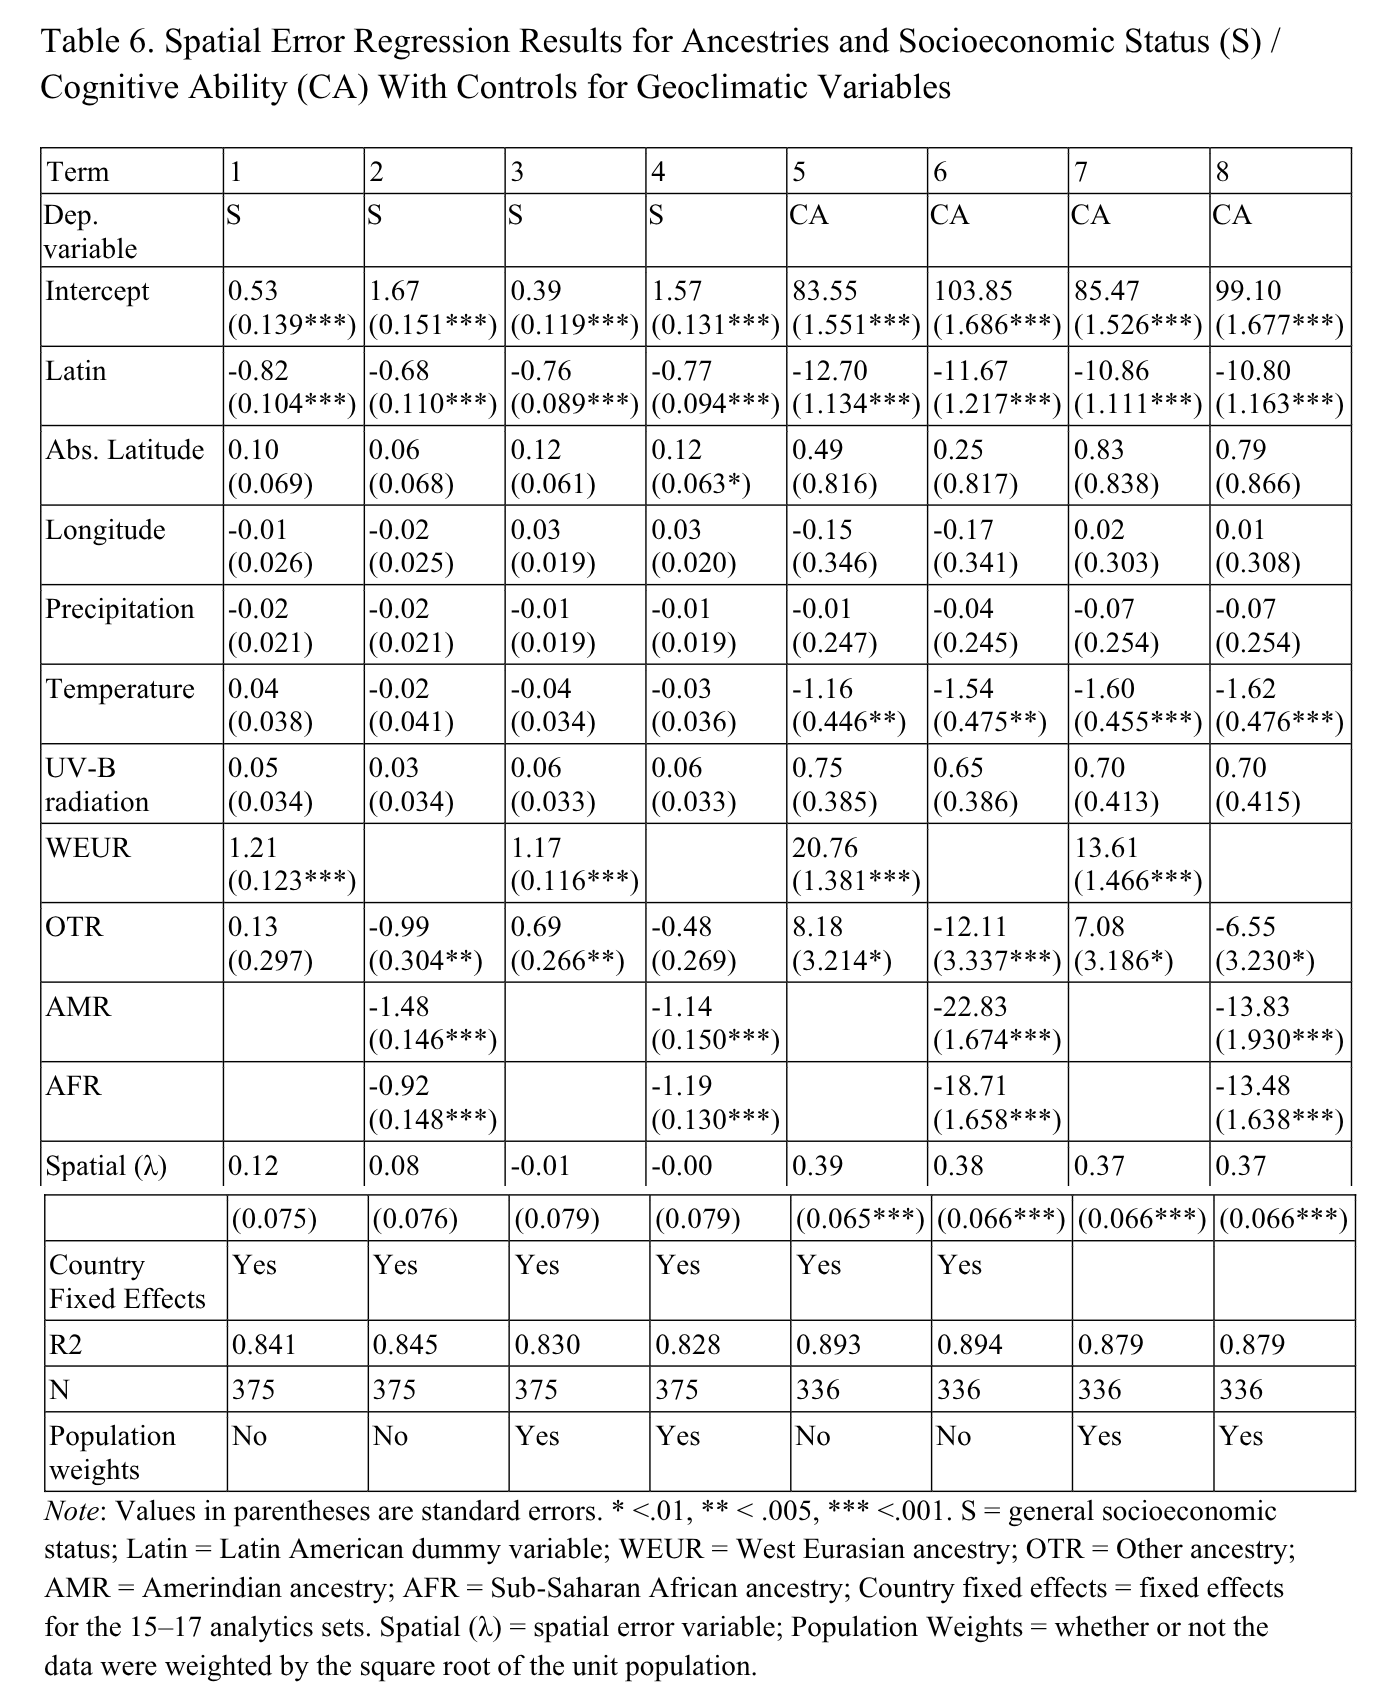
Here we included: 1) UV radiation, 2) temperature, 3) precipitation, 4) longitude, and 5) absolute latitude in addition to the variables from before, and the spatial error model. In other words, even with a sample size of 300+ we are really pressing the models to try to distinguish between the hypothetically causal variables.
Overall, the ancestry effects remained for the outcomes, and the geoclimatical variables did not perform well. An exception is that temperature appears to predict some of the IQ variation and shrinks the estimate for W. Eurasian from 20 to 13 IQ in model 7. Note that this is not true for model 5 which doesn’t use population weights. I don’t know why this happens, and maybe it could be further studied.
There’s more in the preprint, so give it a read! And post the plots online, they are much nicer than the older ones.
To be noted:
- These cross-sectional (same-time) data cannot give strong evidence of causality. The indirect of causality is just that the ancestry associations remains in the presence of all the controls we tried, and the spatial error models. Clearly, ancestry associations cannot be hand-waved away as being merely due to world regions, spatial autocorrelation etc.
- The data quality is not always great. As you can imagine, data quality correlates with development too, so since a lot of the units are in, by western standards, poor countries, they don’t always have top-notch data. Such data quality issues would however tend to obscure the patterns we see rather than enhance them. The true strength of some of the associations will thus be stronger than what we see here.
- In theory, one could obtain time-series data and repeat this kind of study. In practice, obtaining precise enough estimates across time is generally not possible, so this method cannot be pursued here. At least not for now.
