-
Wang, M., Rieger, M. O., & Hens, T. (2016). How time preferences differ: Evidence from 53 countries. Journal of Economic Psychology, 52, 115-135.
We present results from the first large-scale international survey on time preference, conducted in 53 countries. All countries exhibit hyperbolic discounting patterns, i.e., the immediate future is discounted more than far future. We also observe higher heterogeneity for shorter time horizons, consistent with the pattern reviewed by Frederick, Loewenstein, and O’Donoghue (2002). Cultural factors as captured by the Hofstede cultural dimensions (Hofstede, 1991) contribute significantly to the variation of time discounting, even after controlling for economic factors, such as GDP, inflation rate and growth rate. In particular, higher levels of Uncertainty Avoidance are associated with stronger hyperbolic discounting, whereas higher degrees of Individualism and Long Term Orientation predict stronger tendency to wait for larger payoffs. We also find the waiting tendency is correlated with innovation, environmental protection, crediting rating, and body mass index at country level after controlling for county wealth. These results help us to enhance the understanding of differences across financial markets and economic behavior worldwide.
This paper dropped some years ago. You can probably guess how the results look like:
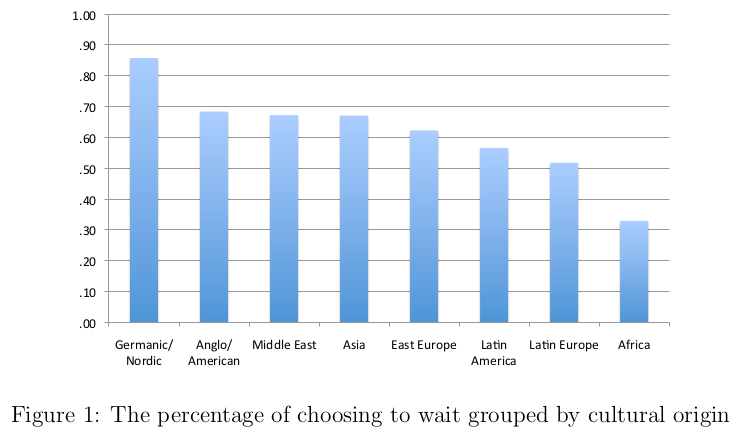

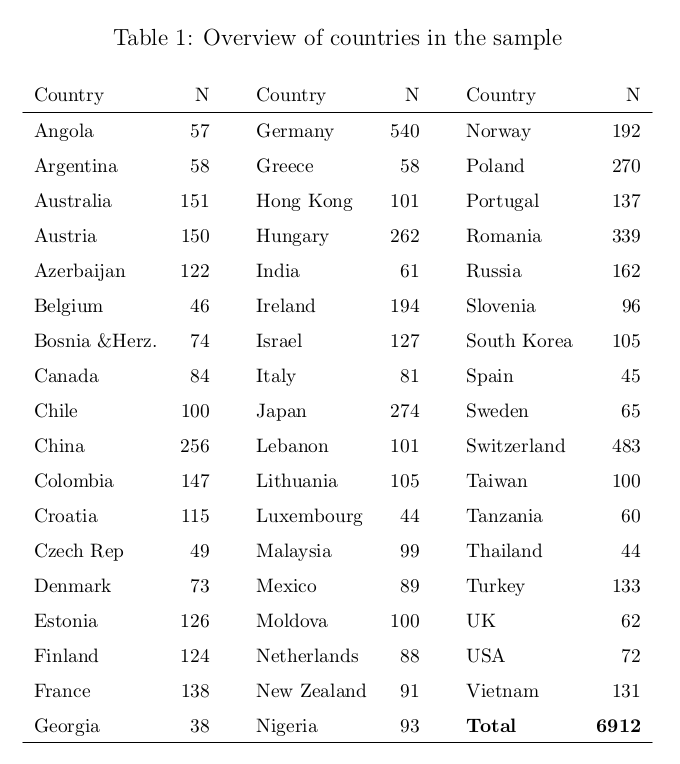
Some of the samples are quite small, so that probably explains some strange outliers. (You don’t want to focus on particular countries, but on general patterns.) Why should New Zealand be so different from UK and Canada? It probably isn’t really, we just estimated it poorly. Also, these are all students:
A total of 6912 university students in 53 countries/regions participated in our survey. Most participants were first or second year students from departments of economics, finance and business administration. The average age of participants was 21.5 years (SD=3.77), and 52.5% of the participants were males.
So because rates of enrollment vary by country, the selectivity varies by country too. Furthermore, unless they picked equivalent level universities within country, there will be some additional selectivity differences there. All in all, these data are quite imperfect owing to selective small samples — but probably roughly right.
We can merge with national data to do a quick analysis (details at https://rpubs.com/EmilOWK/time_pref_natl_iq).

We can see if it adds anything to a regression to predict national well-being (S factor). Standardized betas (SE, p). Variables standardized in full dataset. We can see that national IQ predicts the outcome extremely well, and time preference somewhat. If both are in a model, IQ does about the same, and time preference has no detectable validity. And their interaction is p<.05. And national IQ keeps most of its validity if we add regional dummies (base group = NW European + offshoots). Given this, so far this time preference measure adds virtually nothing: model overfitting adjusted R2 before 72.1% and after 72.4%.
| Predictor/Model | 1 | 2 | 3 | 4 | 5 | 6 |
| Intercept | 0.02 (0.045, 0.629) | 0.07 (0.086, 0.438) | 0.85 (0.081, <0.001***) | 0.14 (0.102, 0.184) | 0.15 (0.122, 0.223) | 0.60 (0.247, 0.02) |
| IQ | 0.79 (0.045, <0.001***) | 0.87 (0.076, <0.001***) | 0.79 (0.096, <0.001***) | 0.78 (0.108, <0.001***) | 0.59 (0.193, 0.004**) | |
| Choose_to_wait | 0.43 (0.081, <0.001***) | 0.09 (0.068, 0.209) | 0.10 (0.082, 0.249) | 0.04 (0.055, 0.521) | ||
| IQ * Choose_to_wait | -0.01 (0.060, 0.832) | |||||
| UN_macroregion=Latin America | -0.17 (0.224, 0.459) | |||||
| UN_macroregion=Africa | -1.02 (0.475, 0.038) | |||||
| UN_macroregion=Eastern Asia | -0.80 (0.208, <0.001***) | |||||
| UN_macroregion=Eastern Europe | -0.46 (0.137, 0.002**) | |||||
| UN_macroregion=MENA | -0.38 (0.220, 0.095) | |||||
| UN_macroregion=South-Eastern Asia | -0.74 (0.197, <0.001***) | |||||
| UN_macroregion=Southern Asia | -0.87 (0.392, 0.033) | |||||
| UN_macroregion=Southern Europe | -0.13 (0.138, 0.371) | |||||
| R2 adj. | 0.643 | 0.721 | 0.351 | 0.724 | 0.718 | 0.857 |
| N | 170 | 51 | 51 | 51 | 51 | 51 |