Most environmentalists have by now given up denying the existence of racial gaps in head size, but they only retreated a few yards:
- Nisbett, R. E., Aronson, J., Blair, C., Dickens, W., Flynn, J., Halpern, D. F., & Turkheimer, E. (2012). Intelligence: new findings and theoretical developments. American psychologist, 67(2), 130.
Brain size and IQ. The evidence cited by supporters of the genetic view that has received the most attention is the claim that because brain size is related to IQ for both Whites and Blacks and because Blacks have smaller brains than Whites, lower IQ for Blacks is genetically determined and mediated by brain size. As indicated above, it is not clear that the brain size correlation with IQ is genetically mediated. Moreover, a within-group correlation does not establish that between-group differences have the same origin. Brain size differences between men and women are much greater than the race differences in brain size, yet men and women have the same average IQ. Brain size of full-term Black and White infants is the same at birth (Ho, Roessmann, Hause, & Monroe, 1981), and several postnatal factors known to reduce brain size are more common for Blacks than for Whites (Bakalar, 2007; Ho et al., 1981; Ho, Roessmann, Straumfjord, & Monroe, 1980a, 1980b). Finally, sheer brain size is a rather blunt measure of brain differences, which may be less predictive of IQ than measures of the size of particular regions or measures such as the ratio of gray matter to white matter. It is noteworthy, for example, that at a given level of IQ, Chinese have smaller frontal cortexes than Americans (Chee, Zheng, Goh, & Park, 2011), although Chinese brains as a whole may be larger than those of Americans (Rushton, 2010). Even with brain size equated between Chinese and Americans, the frontal cortex is larger in Americans (Chee et al., 2011).
A few claims worth looking at.
“it is not clear that the brain size correlation with IQ is genetically mediated”
There was never any serious doubt, but modern studies do show genetic correlations between brain size and IQ. In fact, such a study was published in 2002, 10 years before the claim above.
- Posthuma, D., De Geus, E. J., Baaré, W. F., Pol, H. E. H., Kahn, R. S., & Boomsma, D. I. (2002). The association between brain volume and intelligence is of genetic origin. Nature neuroscience, 5(2), 83.
- Pol, H. E. H., Schnack, H. G., Posthuma, D., Mandl, R. C., Baaré, W. F., van Oel, C., … & Bürgel, U. (2006). Genetic contributions to human brain morphology and intelligence. Journal of Neuroscience, 26(40), 10235-10242.
This sample seems to overlap with the above, but not sure exactly.
There’s a review of neuroscience of intelligence from 2010 — 2 years before the above environmentalist review:
- Deary, I. J., Penke, L., & Johnson, W. (2010). The neuroscience of human intelligence differences. Nature reviews neuroscience, 11(3), 201.
Shared genetic influences between brain structure– function and intelligence? In adults, there are strong genetic influences on many brain structures and regions — including on the density and the volume of grey and white matter in corpus callosum, superior frontal and temporal cortex, medial frontal cortex, amygdala, hippocampus, Broca’s area, anterior cingulate cortex, Heschl’s gyrus and postcentral gyrus — and on overall brain volume; this explains 70–90% of the variance in these measures 29–33 . This is also true of aspects of brain functioning, such as the dynamic complexity of brain oscillations thought to be involved in executive function 34 , and information processing capacity and efficiency as measured in tests of executive function 35 and inspection time 26. variations in these structures and functions may be endophenotypes for intelligence — that is, they might be intermediate physiological markers that contribute directly to intelligence. Therefore, genes involved in intelligence might be more closely linked to these variations in brain structure and function than to intelligence itself. In fact, in all studies to date, the genetic influences on these structures and functions were highly correlated with those on general intelligence 29,31 , 32,36 . This important result — that at least some neural correlates of intelligence owe their associations to shared genetic influences — is drawn from multivariate genetic studies.
“Brain size of full-term Black and White infants is the same at birth“
They cite:
- Ho, K. C., Roessmann, U., Hause, L., & Monroe, G. (1981). Newborn brain weight in relation to maturity, sex, and race. Annals of neurology, 10(3), 243.
Two issues. First, they say it is at birth but their study is about autopsies, i.e. we’re conditioning on infant death, which might disrupt the pattern. Second, they also want to condition on term length. Both are not assumptions one can make when arguing against the genetic model because these are posited to be downstream causes. Indeed, Rushton had argued that at length, so for the authors to just assume that isn’t so is quite odd. Nevertheless, their source looks like this:

The study is too small to say something conclusive though we can note that Black > White in the data.
But why are we citing a study from 1981? There must be something newer. I reviewed 13 pages of results on Google Scholar. I looked for studies that reported head circumference, but also included other relevant ones if I came across them.
- https://scholar.google.dk/scholar?start=0&q=%22head+circumference%22+race+ethnicity+fetal&hl=en&as_sdt=0,31&as_ylo=2000
Studies review
- Mujugira, A., Osoti, A., Deya, R., Hawes, S. E., & Phipps, A. I. (2013). Fetal head circumference, operative delivery, and fetal outcomes: a multi-ethnic population-based cohort study. BMC pregnancy and childbirth, 13(1), 106.
[fetal head circumference = FHC]
We conducted a population-based retrospective cohort study using Washington State birth certificate data. We included singleton, term infants born to nulliparous mothers from 2003–2009. We compared mode of delivery and fetal outcomes in 10,750 large-FHC (37-41 cm) infants relative to 10,750 average-FHC (34 cm) infants, frequency matched by birth-year.
…
Relative to mothers of average FHC infants, mothers of large FHC infants were more likely to be aged 30 years or greater (30% vs. 25%), white (82% vs. 74%), obese (23% vs. 17%), and to have had labor induction (35% vs. 24%) (Pearson Chi-square p < 0.001 for all comparisons). Compared to average FHC infants, large FHC infants were more likely to be male (70% vs. 50%) and were more likely to have a birth weight greater than 3500 grams (86% vs. 40%) (Table 1).
Really bad statistical approach though.
- Jacquemyn, Y., Sys, S. U., & Verdonk, P. (2000). Fetal biometry in different ethnic groups. Early human development, 57(1), 1-13.
Objective: The aim of this study was to determine whether differences in ultrasound-measured fetal biometry exist between pregnant woman of autochthonous Belgian origin and migrant women from Morocco and Turkey. Method: A prospective cross-sectional study was performed in which fetal biparietal diameter, head circumference, abdominal circumference and femur length were measured in pregnant women presenting between 18 and 40 weeks of gestation. Fetal weight was calculated using the formulae by Shepard and Hadlock. Only uncomplicated singleton pregnancies with a certain date of the last menstrual period, confirmed by early ultrasound, were included. The father of the child had to be of the same ethnic origin as the mother. Polynomial regression of the different measurements was performed for women of autochthonous Belgian origin and for migrant women from Morocco and from Turkey. Results:Singleton fetuses numbering 524 were examined, including 369 Belgian, 78 Moroccan and 77 Turkish. Polynomial regression was performed for the three groups for the biparietal diameter, head circumference, abdominal circumference, femur length and estimated fetal weight. No significant difference between the three different ethnic groups could be demonstrated for the biparietal diameter (P=0.39). There was a significant difference for the head circumference (P=0.017), the abdominal circumference (P=0.0015), the femur length (P=0.0014) and the estimated fetal weight for both formulae (Shepard P=0.047; Hadlock P=0.0006). Conclusion: In this set of cross-sectional data no significant difference for ultrasound-measured fetal biparietal diameter between autochthonous Belgian women and migrant women from Morocco and from Turkey could be demonstrated. Differences do exist for the head circumference, the abdominal circumference, the femur length and the estimated fetal weight. The use of adapted charts of fetal size for pregnant women of Turkish or Moroccan origin should be considered.
Though sample sizes are not too impressive.
- Drooger, J. C., Troe, J. W. M., Borsboom, G. J. J. M., Hofman, A., Mackenbach, J. P., Moll, H. A., … & Joung, I. M. A. (2005). Ethnic differences in prenatal growth and the association with maternal and fetal characteristics. Ultrasound in obstetrics & gynecology, 26(2), 115-122.
A total of 1494 women from Rotterdam, The Netherlands, with a low‐risk pregnancy who participated in a population‐based cohort study, the Generation R Study, were offered three ultrasound examinations during pregnancy. Multilevel modeling was applied to determine ethnic differences in (estimated) fetal weight (including birth weight) and in the separate biometric variables that were used to calculate the estimated fetal weight (abdominal circumference, head circumference and femur length). Additionally the association of ethnic differences with maternal and fetal characteristics (i.e. maternal weight, height, age, parity and fetal gender) was studied.
Results
Turkish, Cape Verdian, Surinamese‐Creole and Surinamese‐Hindustani women had on average smaller fetuses than the native Dutch women. The differences became more pronounced towards term. In the Turkish group the differences were no longer statistically significant when adjusted for maternal weight, height, age, parity and fetal gender. In the Cape Verdian, Surinamese‐Creole and Surinamese‐Hindustani groups the differences decreased after adjustment (31%, 16% and 39%, respectively).
Key table:

So at 30 weeks, every non-Dutch group had smaller heads.
- Louis, G. M. B., Grewal, J., Albert, P. S., Sciscione, A., Wing, D. A., Grobman, W. A., … & Nageotte, M. P. (2015). Racial/ethnic standards for fetal growth: the NICHD Fetal Growth Studies. American Journal of Obstetrics & Gynecology, 213(4), 449-e1.
We recruited for prospective follow-up 2,334 healthy women with low-risk, singleton pregnancies from 12 community and perinatal centers between July 2009 and January 2013. The cohort comprised: 614 (26%) non-Hispanic Whites, 611 (26%) non-Hispanic Blacks, 649 (28%) Hispanics, and 460 (20%) Asians. Women were screened at 8w0d to 13w6d for maternal health status associated with presumably normal fetal growth (aged 18–40 years; body mass index 19.0–29.9 kg/m2; healthy lifestyles and living conditions; low-risk medical and obstetrical history); 92% of recruited women completed the protocol. Women were randomized among four ultrasonology schedules for longitudinal fetal measurement using the Voluson E8 GE Healthcare. In-person interviews and anthropometric assessments were conducted at each visit; medical records were abstracted. The fetuses of 1,737 (74%) women continued to be low-risk (uncomplicated pregnancy, absent anomalies) at birth, and their measurements were included in the standards. Racial/ethnic-specific fetal growth curves were estimated using linear mixed models with cubic splines. Estimated fetal weight and biometric parameter percentiles (5th, 50th, 95th) were determined for each gestational week and comparisons made by race/ethnicity, with and without adjustment for maternal and socio-demographic factors.
Their control for these factors is problematic as it was above. They report detailed tables of quantiles by gestational week and race, so we can plot them better than the authors did.
The authors plotted things on absolute scale, as first picture in the series below. This shows the impressive growth during gestation, but we can’t really see the differences well. So in the 2nd part, we regress out the effect of age (restricted cubic spline). In the first three plots we see that races differ in thigh size, not so surprisingly with Asians at the bottom, though hispanics are quite short-legged too. There are two measures of brain size, rather, proxies for it: head circumference and bi-parietal diameter (‘head width’). Both show the expected order more or less.


However, if we control for abdominal size using the ratio approach (i.e. divide by it, which one can do since we have ratio scale units), the result is quite different.

Rushton and Ankney explain why this method is problematic (in context of sex):
- Rushton, J. P., & Ankney, C. D. (2009). Whole brain size and general mental ability: a review. International Journal of Neuroscience, 119(5), 692-732.
Ankney (1992) suggested that the large sex difference in brain size went unnoticed for so long because earlier studies used improper statistical techniques to correct for sex differences in body size and thus incorrectly made a large difference “disappear.” The serious methodological error was the use of brain mass/body size ratios instead of analysis of covariance (see Packard & Boardman, 1988). Ankney (1992) illustrated why this is erroneous by showing that, in both men and women, the ratio of brain mass to body size declines as body size increases. Thus, as can be seen in Figure 2, larger women have a lower ratio than smaller women, and the same holds for larger men compared with smaller men. Therefore, because the average-sized man is larger than the average-sized woman, their brain mass to body size ratios are similar. Consequently, the only meaningful comparison is that of brain mass to body size ratios of men and women of equal size. Such comparisons show that at any given size, the ratio of brain mass to body size is much higher in men than in women (Figure 2).

- Thomas, P., Peabody, J., Turnier, V., & Clark, R. H. (2000). A new look at intrauterine growth and the impact of race, altitude, and gender. Pediatrics, 106(2), e21-e21.
Methods. From 1996 to 1998, we collected birth weight, length, head circumference, estimated gestational age (EGA), gender, race, and place of birth (<4000 feet or ≥4000 feet) on 27 229 neonates to evaluate the effects of each on intrauterine growth and the diagnoses of small for gestational age (SGA) and large for gestational age (LGA). We compared the gestation-specific growth parameters derived from our sample with those reported in 1966 and 1969.
Results. Gestational age had the largest influence on each growth parameter. Race and gender both had effects on birth weight. Female neonates were smaller than male neonates, and black neonates were smaller than Hispanic and white neonates at each EGA.
Doesn’t have any nice tables or figures for head size, but:
Gestational age had the largest influence on each birth parameter, and there was a significant increase for each additional week of gestation up to 40 weeks of EGA. Both race and gender had gestational age- independent effects on birth weight (Fig 2). Although neonates born at higher altitude were slightly lighter, altitude did not have a significant gestational age- independent effect on any of the birth parameters (Fig 2). At each specific week of gestation, female neonates had lower average birth weights, lengths, and head circumferences than male neonates (Fig 2). Racial comparisons showed that black neonates were consistently shorter and had lower birth weights than Hispanic and white neonates. Although the differences were consistent for race and gender, they were small. Female neonates were, on average, 95 g lighter, .6 cm shorter, and had head circumferences that were .6 cm smaller than male neonates. White and Hispanic neonates were, on average, 90 g larger, .4 cm longer, and had head circumferences that were .4 cm larger than black neonates. Both gender and racial differences increased with gestational age (Fig 3). The only growth parameter significantly affected by race and gender independent of gestational age was birth weight. Head circumference and length differences by race and gender were consistent across gestational age. However, these differences were small and not statistically different.
- Madan, A., Holland, S., Humbert, J. E., & Benitz, W. E. (2002). Racial differences in birth weight of term infants in a northern California population. Journal of Perinatology, 22(3), 230.
“small (SGA) or large size(LGA) for gestational age”
STUDY DESIGN: Data was collected prospectively from May 1 to September 13, 2000 on all singleton term infants born at this hospital. Gestational age was assessed by the best obstetrical estimate and ethnicity was determined by parental report. Infants were categorized as White, Hispanic, Chinese, Asian Indian, Other Asian, and Other. Birth weights, length, and head circumferences were compared using ANOVA and the Student–Newman–Keuls test. Differences in rates of diagnosis of SGA or LGA were assessed by chi square.
RESULTS: 1539 infants were included in the study sample; 30% were White, 21% Asian Indian, 15% Chinese, 9% Hispanic, 7% other Asian, and 18% Other. Asian (Chinese, Asian Indian, or Other Asian), Hispanic, and Other babies had lower mean birth weights, shorter mean lengths, and smaller mean head circumferences than White babies. Asian, Hispanic, and Other male babies were lighter, shorter, and had smaller heads than white male babies. Asian females, but not Hispanic or Other ones, were lighter and had smaller head circumferences than White females; Asian Indian, Other Asian, and Other females had shorter lengths than White female infants. Indian and Other Asian, but not Chinese, babies were more likely than White babies to be SGA; babies in all three Asian groups were less likely than White babies to be LGA.
Table has the numbers.

We see the usual pattern, though the study has no explicit black group, presumably they are in the “Other” group.
- Gould, J. B., Madan, A., Qin, C., & Chavez, G. (2003). Perinatal outcomes in two dissimilar immigrant populations in the United States: a dual epidemiologic paradox. Pediatrics, 111(6), e676-e682.
Methods. The vital records for self-reported foreign-born Asian Indian (0.8%) and Mexican women (26.7%) and US-born black (31.2%) and white women (31.2%) were extracted from California’s 1 622 324 births, 1995–1997. Sociodemographic risk profiles; the percentage of LBW, very low birth weight (VLBW), prematurity, and intrauterine growth retardation (less than third percentile); and percentage of fetal, neonatal, and postneonatal death rates were compared. Logistic models were used to estimate the importance of selected sociodemographic and medical factors to the prediction of LBW infants in each racial/ethnic group.
Table has their primary results:

Just about the usual patterns, though selective immigration and sampling (perhaps) makes it a bit hard to interpret.
- Parikh, L. I., Nolan III, J., Tefera, E., & Driggers, R. (2014). Fetal biometry: does patient ethnicity matter?. The Journal of Maternal-Fetal & Neonatal Medicine, 27(5), 500-504.
Methods: We performed a retrospective chart review of prenatal ultrasounds completed in our Perinatal Center from January 2009 to December 2010. Singleton pregnancies 17 to 22.9 weeks were included. Pregnancies complicated by IUGR, fetal anomalies, chronic maternal diseases, or dated by an ultrasound after the first trimester were excluded. Biparietal diameter (BPD), head circumference (HC), abdominal circumference (AC), femur length (FL), and humerus length (HL) were compared between African Americans (AA), Caucasians, and Hispanics using ANOVA and Student t-test.
Results: Included were 1327 AA, 147 Caucasian, and 86 Hispanic subjects. The AC was significantly smaller in AA than Caucasians (p = 0.008). There was no difference between AA and Caucasians in BPD, HC, FL, or HL. There were no differences between Hispanics and either Caucasians or AA in any of the biometries evaluated.
So, sample too small, but their table shows the results which are in line with the usual findings from other studies.

- Weigel, M. M., & Sanchez, M. E. C. (2013). Ethnic/racial disparities in the fetal growth outcomes of Ecuadorian newborns. Journal of immigrant and minority health, 15(1), 198-206.

A bit odd groups to compare and small samples. Mestizo is presumably more European admixture, and they did have larger heads, but less birth weight. Odd.
- Araujo Junior, E., Martins Santana, E. F., Martins, W. P., Júnior, J. E., Ruano, R., & Pires, C. R. (2014). Reference charts of fetal biometric parameters in 31,476 Brazilian singleton pregnancies. Journal of Ultrasound in Medicine, 33(7), 1185-1191.
A cross‐sectional retrospective study was conducted including 31,476 low‐risk singleton pregnancies between 18 and 38 weeks’ gestation. The following fetal parameters were measured: biparietal diameter, head circumference, abdominal circumference, femur length, and estimated fetal weight. To assess the correlation between the fetal biometric parameters and gestational age, polynomial regression models were created, with adjustments made by the determination coefficient (R2).
Sounds good, but then:
We decided not divide our sample by race or ethnic- ity because the Brazilian population is considered a mixed population of miscellaneous origins. 22 Therefore, there is no pure black or pure white in the general Brazilian society anymore. 13,23 Moreover, genetic studies have found that 61% of white people have black and indigenous ancestries in their DNA in proportions of 28% and 33%, respectively. 24
Hmmm…
- Cragan, J. D., Isenburg, J. L., Parker, S. E., Alverson, C. J., Meyer, R. E., Stallings, E. B., … & Ethen, M. K. (2016). Population‐based microcephaly surveillance in the United States, 2009 to 2013: An analysis of potential sources of variation. Birth Defects Research Part A: Clinical and Molecular Teratology, 106(11), 972-982.
Methods
Thirty birth defects surveillance programs provided data on infants diagnosed with microcephaly born 2009 to 2013. The pooled prevalence of microcephaly per 10,000 live births was estimated overall and by maternal/infant characteristics. Variation in prevalence was examined across case finding methods. Nine programs provided data on head circumference and conditions potentially contributing to microcephaly.
Results
The pooled prevalence of microcephaly was 8.7 per 10,000 live births. Median prevalence (per 10,000 live births) was similar among programs using active (6.7) and passive (6.6) methods; the interdecile range of prevalence estimates was wider among programs using passive methods for all race/ethnicity categories except Hispanic. Prevalence (per 10,000 live births) was lowest among non-Hispanic Whites (6.5) and highest among non-Hispanic Blacks and Hispanics (11.2 and 11.9, respectively); estimates followed a U-shaped distribution by maternal age with the highest prevalence among mothers <20 years (11.5) and ≥40 years (13.2). For gestational age and birth weight, the highest prevalence was among infants <32 weeks gestation and infants <1500 gm. Case definitions varied; 41.8% of cases had an HC ≥ the 10th percentile for sex and gestational age.
As with IQ < 70/retardation, it can arise from either normal left tail causes, or from strong single causes such as single gene disorders or aneuploidy. Given that White mothers are older, they should be at somewhat higher risk for the syndromic causes, thus biasing the expected pattern a bit, but as we see, it is quite clear.
Conclusion
Taken together, there is ample evidence that racial differences in head size and hence brain size arise in utero, particularly in second part of gestation and are clearly present at birth when large, representative studies are reviewed. Generally, the ethnic group differences seen are what one would expect based on intelligence gaps, with some allowance for body size confounding, primarily relevant to Asian, Amerindian and Indian groups.
Between study approach
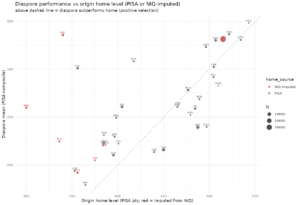
Above I’ve only included studies with within study comparisons. Another option is to collect estimates from different studies. This however means that one faces issues of between study heterogeneity in measurement. For instance, this large Turkish study finds larger head circumference for Turks than for Europeans in the studies reported above, which is implausible given the results, including one study finding that Euro > Turkish in within study comparison. A similar issue was discussed in Fuerst and Dalliard (2014).
Added 25th October 2018
I found another study I should have found earlier because it’s from Rushton and in Intelligence no less:
- Rushton, J. P. (1997). Cranial size and IQ in Asian Americans from birth to age seven. Intelligence, 25(1), 7-20.
The Collaborative Perinatal Project is a longitudinal study of over 53,000 children 10.1016/S0160-2896(97)90004-0. Up to now, studies have analyzed data on the 17,000 European American children and the 19,000 African American children. Here data are reported and analyzed for a sub-sample of 100 Asian Americans. The Asian sub-sample averaged a higher IQ (110) at age 7 than did the white (102) or the black sub-samples (90). At birth, 4 months, 1 year, and 7 years, the Asians averaged a larger cranial capacity than did the whites or blacks despite being smaller in stature and lighter in weight (at age 7, Asian z scores from -0.20 to -0.40 in height and weight). Head circumference (or cranial capacity) at birth correlated .46 with head circumference (or cranial capacity) at age 7 which correlates .21 with IQ test scores at age 7. The Asians also averaged a higher parental socioeconomic status at birth than did the whites or blacks (Asian z scores = +0.41 and 1.27 respectively). Socioeconomic status related to cranial capacity and to IQ scores but not to stature or to weight, neither of which correlated with IQ. Males averaged larger body and cranial sizes than did females (and, by 12 months, larger cranial sizes even after correction for body size).
Key figure:

This study was published by a main proponent of hereditarian approach 15 years before the Nisbett review and in the biggest name journal in the field, so why was it not cited by Nisbett et al? I also note that the USPP/CPP is public domain, but the data format is terrible. There’s probably a lot of stuff waiting to be found in that, it as a sibling control design. Some day, I will get someone to spend a few days reading all this data into proper format and putting it out there for easy use. Some day.
Added 27th April 2019: INTERGROWTH 21st project
In January 2019, various media were telling us about a new study that showed that all babies were born equal (Telegraph, DailyMail, MSN). As usual, they get some new but wrong quotes:
“At every single stage we’ve shown that healthy mothers have healthy babies and that healthy babies all grow at exactly the same rate,” said Prof Stephen Kennedy, the co-director of the Oxford Maternal and Perinatal Health Institute.
“It doesn’t matter where you are living, it doesn’t matter what the colour of your skin is, it doesn’t matter what your race and ethnicity is, receiving decent medical care and nutrition is the key.”
So, we check the study, and it’s actually not new, and in fact, the press release is from 2014. So, apparently, some journalist found the old press release, and decided to make a splash about the ‘new’ study. The study itself is:
-
Villar, J., Papageorghiou, A. T., Pang, R., Ohuma, E. O., Ismail, L. C., Barros, F. C., … & Gravett, M. G. (2014). The likeness of fetal growth and newborn size across non-isolated populations in the INTERGROWTH-21st Project: the Fetal Growth Longitudinal Study and Newborn Cross-Sectional Study. The lancet Diabetes & endocrinology, 2(10), 781-792.
Background
Large differences exist in size at birth and in rates of impaired fetal growth worldwide. The relative effects of nutrition, disease, the environment, and genetics on these differences are often debated. In clinical practice, various references are often used to assess fetal growth and newborn size across populations and ethnic origins, whereas international standards for assessing growth in infants and children have been established. In the INTERGROWTH-21 st Project, our aim was to assess fetal growth and newborn size in eight geographically defined urban populations in which the health and nutrition needs of mothers were met and adequate antenatal care was provided.
MethodsFor this study, fetal growth and newborn size were measured in two INTERGROWTH-21 st component studies using prespecified markers and the same methods, equipment, and selection criteria. In the Fetal Growth Longitudinal Study (FGLS), we studied educated, affluent, healthy women, with adequate nutritional status who were at low risk of intrauterine growth restriction. The primary markers of fetal growth were ultrasound measurements of fetal crown-rump length at less than 14 weeks and 0 days of gestation and fetal head circumference from 14 weeks and 0 days to 40 weeks and 0 days of gestation, and birth length for newborn size. In the concomitant, population-based Newborn Cross-Sectional Study (NCSS), we measured birth length in all newborn babies from the eight geographically defined urban populations with the same methods, instruments, and staff as in FGLS. From this large NCSS cohort, we selected an FGLS-like subpopulation to match FGLS with the same eligibility criteria.
FindingsBetween May 14, 2009, and Aug 2, 2013, we enrolled 4607 women in FGLS and 59 137 women in NCSS. From NCSS, 20 486 (34·6%) women met the FGLS eligibility criteria, and constituted the FGLS-like subpopulation. With variance component analysis, only between 1·9% and 3·5% of the total variability in crown-rump length, fetal head circumference, and newborn birth length could be attributed to between-site differences. With standardised site effect analysis in 16 gestational age windows from 9 weeks and 0 days of gestation to birth for the three measures (128 comparisons), only one was marginally higher than 0·5 SD of the standardised site difference range. Sensitivity analyses, excluding individual populations in turn from the pooling of all-site centiles across gestational ages, showed no noticeable effect on the 3rd, 50th, and 97th centiles derived from the remaining populations. Our populations were consistent at birth with those in the WHO Multicentre Growth Reference Study (MGRS). The mean birth length for term newborn babies in that study was 49·5 cm (SD 1·9), which was very similar to that in the FGLS cohort (49·4 cm [1·9]) and the NCSS derived FGLS-like subpopulation (49·3 cm [1·8]).
Interpretation
Fetal growth and newborn length are similar across diverse geographical settings when mothers’ nutritional and health needs are met, and environmental constraints on growth are low. The findings for birth length are in strong agreement with those of the WHO MGRS. These results provide the conceptual frame to create international standards for growth from conception to newborn baby, which will extend the present infant to childhood WHO MGRS standards.
Funding
Bill & Melinda Gates Foundation.
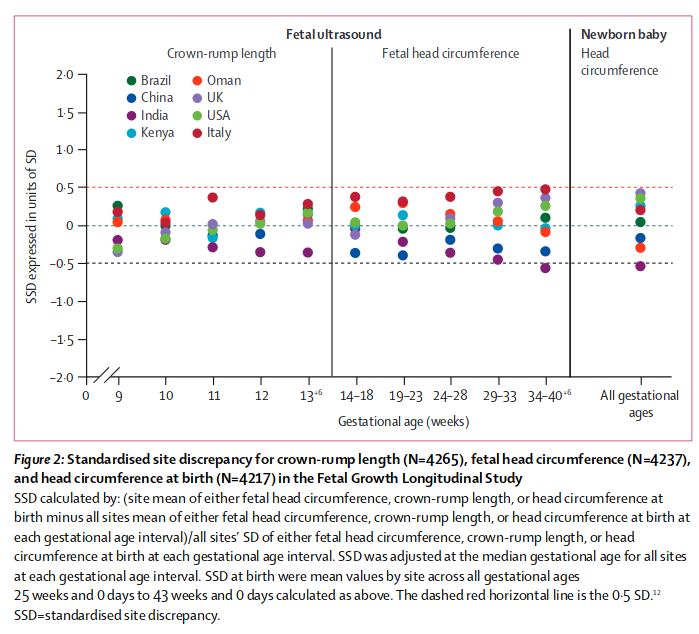
Nevertheless, as we recognised in the protocol,15 some variability in these populations remained, mostly at the extremes of gestational age in some parameters. This variation might have arisen because of residual secular trends, true inter-ethnic differences,10 unstable estimations due to the small sample sizes at some gestational age windows, or simply differences in protocol implementation despite our best efforts to standardise rigorously across the study sites. However, we confirmed that such variability among sites represents only 3% of the total variance for skeletal growth, whereas the variability in individuals within a site is seven times higher (table 3). This finding addresses our a priori question: is the variability across populations for the three primary size measures larger than the variability of the same measures within populations?15 Lastly, the study patients did not undergo genetic profi ling and, although this might seem to be a limitation, the eight populations included in the study are unlikely to be homogeneous when compared with each other.