Genetic variation between populations/races of a species is a nice single summary statistic about how large between population phenotypic differences to expect. In case of humans, this value (Fst, the fixation index) is about 15%. This finding is due to Lewontin (1972) and is now mindlessly repeated (Lewontin’s fallacy) as some kind of slam dunk argument against race realism. However, it’s somewhat of a double-edged sword because the choice of this particular metric allows one to look up comparisons with other species, species which have obviously agreed upon subspecies/races/populations (Woodley 2010). Of particular interest to humans are dogs and cats, so how large are their genetic differences?
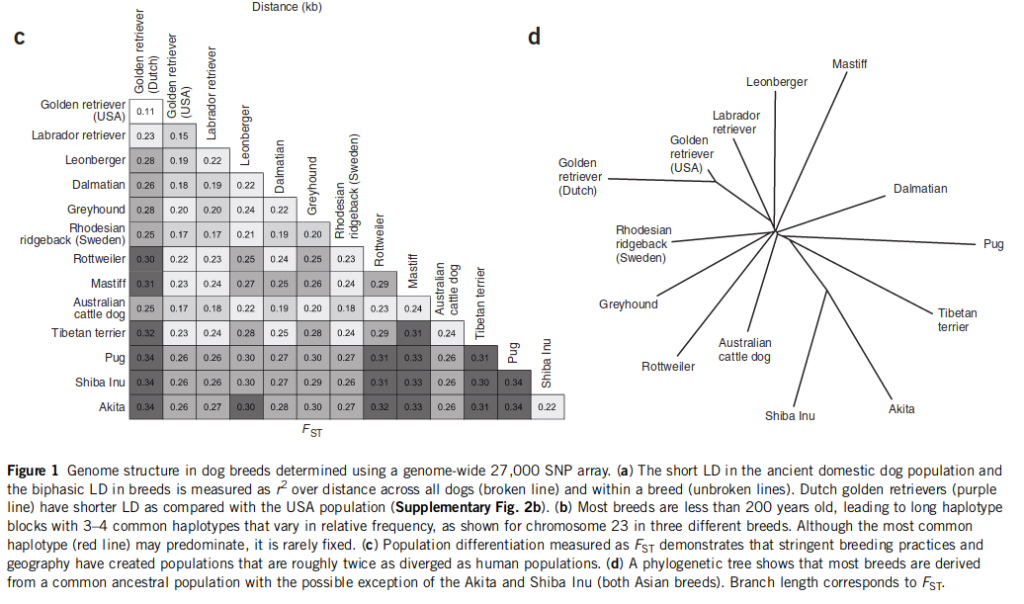
- Karlsson, E. K., Baranowska, I., Wade, C. M., Hillbertz, N. H. S., Zody, M. C., Anderson, N., … & Comstock, K. E. (2007). Efficient mapping of mendelian traits in dogs through genome-wide association. Nature genetics, 39(11), 1321.
With several hundred genetic diseases and an advantageous genome structure, dogs are ideal for mapping genes that cause disease. Here we report the development of a genotyping array with ∼27,000 SNPs and show that genome-wide association mapping of mendelian traits in dog breeds can be achieved with only ∼20 dogs. Specifically, we map two traits with mendelian inheritance: the major white spotting (S) locus and the hair ridge in Rhodesian ridgebacks. For both traits, we map the loci to discrete regions of <1 Mb. Fine-mapping of the S locus in two breeds refines the localization to a region of ∼100 kb contained within the pigmentation-related gene MITF. Complete sequencing of the white and solid haplotypes identifies candidate regulatory mutations in the melanocyte-specific promoter of MITF. Our results show that genome-wide association mapping within dog breeds, followed by fine-mapping across multiple breeds, will be highly efficient and generally applicable to trait mapping, providing insights into canine and human health.
Authors write both that the average Fst is about twice that of humans, and that it is 2-3 times, so I don’t know which it is, for they don’t report the actual value. I copied their table and found the mean Fst to be .26, which is not even twice the usual human value of .15. I also recall reading another paper finding a value of upper 20s, but I can’t find it right now.
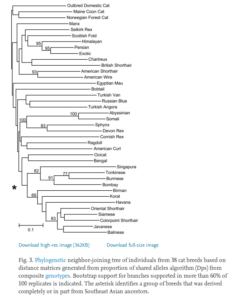
- Menotti-Raymond, M., David, V. A., Pflueger, S. M., Lindblad-Toh, K., Wade, C. M., O’Brien, S. J., & Johnson, W. E. (2008). Patterns of molecular genetic variation among cat breeds. Genomics, 91(1), 1-11.
Genetic variation in cat breeds was assessed utilizing a panel of short tandem repeat (STR) loci genotyped in 38 cat breeds and 284 single-nucleotide polymorphisms (SNPs) genotyped in 24 breeds. Population structure in cat breeds generally reflects their recent ancestry and absence of strong breed barriers between some breeds. There is a wide range in the robustness of population definition, from breeds demonstrating high definition to breeds with as little as a third of their genetic variation partitioning into a single population. Utilizing the STRUCTURE algorithm, there was no clear demarcation of the number of population subdivisions; 16 breeds could not be resolved into independent populations, the consequence of outcrossing in established breeds to recently developed breeds with common ancestry. These 16 breeds were divided into 6 populations. Ninety-six percent of cats in a sample set of 1040 were correctly assigned to their classified breed or breed group/population. Average breed STR heterozygosities ranged from moderate (0.53; Havana, Korat) to high (0.85; Norwegian Forest Cat, Manx). Most of the variation in cat breeds was observed within a breed population (83.7%), versus 16.3% of the variation observed between populations. The hierarchical relationships of cat breeds is poorly defined as demonstrated by phylogenetic trees generated from both STR and SNP data, though phylogeographic grouping of breeds derived completely or in part from Southeast Asian ancestors was apparent.
Their results:
An analysis of molecular variance (AMOVA) demonstrated moderate Fst values among cat breeds, from a high of 0.53 to a low of 0.0 (Table 3). The average pairwise Fst value observed in cat breeds is 0.17, with most of the variation in cat breeds observed within a breed population (83.7%), versus 16.3% of the variation observed between populations (Table 3).
Genetic differences -> phenotypic differences?
A nice thing about these papers is that they published the entire Fst matrix, so one can reuse this with any dataset of cat phenotypic values to look for congruence between genetic distance and trait distances. Such a study has also been done for humans with intelligence as the trait of interest.
- Becker, D., & Rindermann, H. (2016). The relationship between cross-national genetic distances and IQ-differences. Personality and Individual Differences, 98, 300-310.
The study analyzes whether genetic differences (“genetic distances”) help to explain cross-national IQ differences being controlled for environmental factors. Genetic distances are an indicator of evolutionary history and of difference or similarity between populations. Controlled for environmental determinants the relationship between genetic distances and intelligence differences can be interpreted as an effect of genetic factors. Genetic distances were calculated in Y-chromosomal haplogroup frequencies between N = 101 national populations based on k = 27 genetic studies. Correlations and path-analyses with differences in geographical coordinates and the Human Development Index (HDI) as background and control factors revealed a positive impact of genetic distances on cross-national IQ-differences (r = .37, β = .22 to .40). The strongest impact was found for HDI (r = .67, β = .58). Longitudinal differences have no positive effect (r = −.09, β = −.13 to −.26), latitudinal differences have a positive one (r = .37, β = .07 to .21). The positive relationship to latitudinal differences underpins an evolutionary explanation. Chances and limits of this approach (e.g. no intelligence coding genes detected) understanding national differences in cognitive ability and the role of environmental factors are discussed.
This Fst difference-difference approach was also used recently in another large scale dog study:
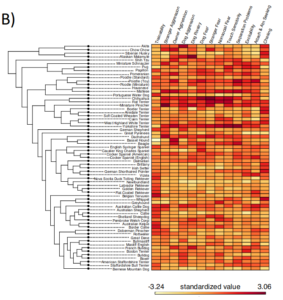
- MacLean, E., Snyder-Mackler, N., & Serpell, J. (2019). Highly Heritable and Functionally Relevant Breed Differences in Dog Behavior. bioRxiv, 509315.
Variation across dog breeds presents a unique opportunity for investigating the evolution and biological basis of complex behavioral traits. We integrated behavioral data from more than 17,000 dogs from 101 breeds with breed-averaged genotypic data (N = 5,697 dogs) from over 100,000 loci in the dog genome. Across 14 traits, we found that breed differences in behavior are highly heritable, and that clustering of breeds based on behavior accurately recapitulates genetic relationships. We identify 131 single nucleotide polymorphisms associated with breed differences in behavior, which are found in genes that are highly expressed in the brain and enriched for neurobiological functions and developmental processes. Our results provide insight into the heritability and genetic architecture of complex behavioral traits, and suggest that dogs provide a powerful model for these questions.
Caption:
Heritability estimates, breed-level behavioral data, and clustering based on behavioral and genetic data.A) Heritability (h2) estimates (proportion of variance attributable to genetic factors) for 14 behavioral traits.Genotypic variation accounts for five times more variance in analyses across vs. within breeds (within-breed estimates compiled from Ilska et al., 2017).Points for Hayward et al. and Parker et al. reflect the results of analyses with independent genetic datasets. Error bars reflect the 95% confidence intervals. B) Heatmap of breed-average behavioral scores plotted alongside a cladogram of breed relatedness from Parker et al., 2017. C) Breed dendrograms from clustering based on behavioral (left panel) and genetic (right panel) similarity. Colors correspond to clades from Parker et al., 2017.
Why the relevance? Studies of animals provide a reasonable prior for what to expect about human race differences. The general idea here is that if dog/cat breeds show obvious and accepted heritable subspecies differences, and 2) these species have comparable between group genetic variation to humans, then 3) it’s likely that human phenotypic gaps also reflect genetic ones. Sensing the danger, perhaps, some SJWs have decided to bite the bullet and accept dog blank slatism!
One major issue with this comparison is that dogs, cats etc. have been under intense human-directed selection in recorded and unrecorded history, whereas humans are thought to have evolved perhaps mostly in response to environmental variation. The question of how well the analogy works depends on current research topic into whether humans can be said to be domesticated too — by themselves.
Sign of differential selection
Another idea is that one could try out a lot of correlations for phenotypes and genetic correlations. The traits that produce the largest positive values are those that are have been under the strongest differential selection. This method depends on some assumption, such that one is operating with a single dimension of the trait, which is obvious for e.g. height. Genetic drift will also produce large gaps for more distant populations, but not as large ones, and not consistent ones since drift is random.
A related idea is to get Fst values for GWAS hits across traits, and see which traits have larger genetic gaps than one would generally expect by chance levels. Davide Piffer has been using this sort of approach (Piffer 2018), though not with a phenome-wide approach.


