Recently, I found a Swedish language report that discusses economic consequences of refugee immigration to Sweden.
- Ruist, Joakim. 2018:3 Tid för integration – en ESO-rapport om flyktingars bakgrund och arbetsmarknadsetablering.
The report is published by “Expertgruppen för Studier i Offentlig ekonomi”, expert group for studies in public finances, which is a subunit under the ministry of finance, where the author also works. So, it is essentially as good as it gets with regards to mainstream source credibility. Fortunately, they included a long English summary which we shall quote in full with my highlights:
This study investigates the labor market integration of refugees who arrived in Sweden from different countries of origin over the period 1982–2014. These are observed in 1983–2015. The main focus is on refugees who were 20-50 years old when immigrating. Refugees who immigrated from 1990 onwards can be identified with good precision. For those who immigrated earlier, all immigrants from Iraq, Iran, Chile, Hungary, Romania, Vietnam, Ethiopia, Lebanon, Somalia, Syria, and Afghanistan are assumed to be refugees. Apart from this, those who immigrated as family members of refugees are not included in the analysis.
Labor market integration is primarily measured by employment rates. Employment is defined as an annual income that is higher than 40 per cent of the median income of 20-50-year-old native men in the same year. This limit is equivalent to 34,000 kronor in 1983, 67,000 kronor in 1990, 92,000 kronor in 2000, and 138,000 kronor in 2015. This definition is considered suitable because it corresponds to approximately the income required for self-sufficiency in a one-person household.
The report initially shows that refugees’ employment rates have gradually fallen across successive cohorts over the last three decades. Refugee integration was considerably faster in the 1980s than what it has been thereafter. Refugees who arrived in Sweden in 1982–1988 had an employment rate above 60 per cent already after two-three years for men and five years for women. Reaching similar levels has taken later arrivals six to nine years for men and eight to twelve years for women. It is doubtful whether it is possible to reach this fast employment integration again, as unemployment was kept low in the 1980s in a way that was not macro-economically sustainable. Early integration was more difficult for refugees who arrived during the economic crisis of the early 1990s. Subsequent arrivals performed slightly better, yet also between the mid-1990s and 2015, a gradual slow decline in the speed of integration can be observed.
It is only the early pace of refugee integration that differs substantially between the 1980s and later decades though. After 15-20 years in the country, employment rates of those who arrived in the 1980s and those who arrived later have been similar, at around 70–80 per cent for men, and 65–70 per cent for women.
However, over the long period of gradually declining employment rates for refugee immigrants, there have also been important changes in these immigrants’ distributions across countries of origin. Refugee immigration from Eastern Europe and Chile was high in the 1980s, but ceased thereafter. Former Yugoslavia dominated refugee immigration in much of the 1990s, while Iraq and Somalia were more important in the 2000s, and Syria – and to some extent Eritrea – in the 2010s. For this reason, refugee employment is also studied separately by country of origin, to determine to what extent the reported trends are valid also for refugees from each country of origin, versus to what extent they may represent shifts between countries.
This analysis finds very substantial differences in refugee employment rates depending on the country of origin. The most successful groups may at certain points in time have employment rates that are a full 40 percentage points above those of the least successful, and the differences are often as large as 20 percentage points also after more than 15 years in the country. The pattern of which groups integrate faster versus slower has also been stable over long periods of time, in spite of much variation over time within countries of origin in the types and intensities of refugee-generating conflicts.
It is difficult to determine what causes these stable differences between refugees from different countries of origin. Differences in education levels appear at most to explain a minor share. Possible explanations, which cannot be verified, are stable differences in the selection of refugees who move to Sweden, or in the general qualifications of populations in different countries, or in patterns of discrimination against different groups in Sweden.
When the analysis is broken down by country of origin, the conclusion that integration was considerably faster for refugees who arrived in the 1980s remains. Yet the conclusion that it has been gradually slower for successive groups who have arrived since the middle of the 1990s and onwards does not. Instead, over the last two decades, refugees’ integration patterns by country of origin appear to have been quite stable. This is in spite of potentially negative macro trends, i.e. large shares of less-qualified manufacturing jobs leaving Sweden, and a tripling of the share of refugees in the total working-age population. Hence an increasing number of refugees in the population does not appear to noticeably harm labor market integration.
It is thus also reasonable to expect that the large refugee groups who have immigrated over the last few years, will on average find employment at approximately the same pace as their predecessors over the previous twenty years did. The high stability of employment integration patterns by country of origin over a long period of time makes it likely that also future patterns will look similar. Also considering their distribution across countries of origin, the average integration potential of the most recent arrivals appears likely to be similar to those of the previous two decades.
Employment gaps between men and women are generally large during refugees’ first ten years in Sweden. Plausibly, this is to a non-negligible extent because large shares of most refugee groups are in child-rearing ages at the time of immigration. Hence women taking larger responsibility than men for small children at home will be reflected to a larger extent in the gender employment gap among newly-arrived refugees compared to in a population with a more even age-distribution, such as the total Swedish working-age population. Yet after around ten years in the country, refugees’ gender employment gaps tend to decrease rapidly. After twenty years they are in many cases fully eradicated, and in certain cases even reversed, so that women have higher employment rates than men.
Which industries employ most newly-arrived refugees has changed importantly over time, in particular for men. Among all newly-arrived employed male refugees in 1990, more than 30 per cent worked in the manufacturing sector. Yet in 2015, the corresponding share was merely 5 per cent. This decrease is considerably stronger than that in the total male population over the same period. In later years, the care sector has instead come to dominate newly-arrived refugees’ employment. Among all newly-arrived employed refugees in 2015, 60 per cent of the women and 30 per cent of the men worked in this sector. The share of newly-arrived refugees working in the hotels and restaurants sector has also increased markedly over time.
Age at immigration importantly influences refugees’ employment integration. Among men, integration has been somewhat slower for those who were above 35 years old when immigrating, and considerably slower for those who were above 40. This pattern is similar for women, yet takes a few years to become fully manifest. Plausibly, the differences between older and younger women are initially counterbalanced by the younger women’s higher degree of responsibility for small children.
Resettled refugees (those who did not apply for asylum in Sweden) generally integrate slower into the labor market compared with other refugees. This confirms previous empirical research, and is to be expected in a context where those who succeed to apply for asylum on site are likely to possess physical, economic, or other resources that may also be useful on the labor market. Resettled refugees, on the other hand, are to a large extent chosen based on their “vulnerability”. The magnitudes of the employment gaps between resettled and other refugees differ substantially across countries of origin and arrival periods though.
Refugees’ employment integration differs substantially across Swedish regions, and along different patterns in different time periods. The few patterns that have been relatively stable include that employment is generally higher in Jönköpings, Kronobergs, and Stockholms län, and lower in the Malmö region and in Gotland. It is difficult to determine the causes of these differences. Potentially they represent no more than differences in qualifications between refugees’ who have chosen to settle in different parts of the country. It may be noted though, that Jönköpings and Kronobergs län have the highest shares of manufacturing in total employment in the country, and that the Malmö region has the highest, and Gotland the lowest, share of refugees in the population.
Young adults (25-35 years old), who arrived in Sweden as refugees or their family members when they were children, have on average lower employment rates than similarly-aged natives. The differences are small for those who arrived in Sweden at below 15 years of age, and larger for those who were 16-19. These internal differences are somewhat more pronounced among women compared to men. Employment differences between countries of origin among these childhood-arrivals mostly follow a pattern that is similar to that among refugees who arrived at adult age, although there are exceptions.
The study also forecasts the effects of current refugee immigration on current and future Swedish public finances. This exercise makes use of the fact that refugees’ employment integration rates have been fairly stable by country of origin for successive cohorts who arrived over the last twenty years, which increases the likelihood that future patterns will also be similar. The forecasting exercise uses 2015 data to calculate net contributions to public finances of refugees’ and their family members, depending on their age and number of years since immigration. This is done separately for refugees from countries with historically high integration potential, and countries with low historical potential. An average between these two groups is assumed to be representative for an average refugee who arrives in Sweden today or in the near future.
The results show that refugee immigration has a negative fiscal impact, both in the short and the long run. The cost is highest in the first few years after immigration. Over a certain part of their time in Sweden, the average refugee makes a positive net fiscal contribution, yet not large enough to cover the initial deficit, and the deficit that appears later as they reach retirement age. Numerical estimates are highly uncertain, but indicate that the net fiscal transfer to the average refugee, over their entire lifetime in Sweden amounts to, on average, 74,000 kronor [7579 USD] per year. By comparison, the net transfer to the average refugee in Sweden in 2015 was 60,000 kronor. [6145 USD]
Phew, that was a lot. A key plot.
Employment rate by origin country and years since immigrating, men who immigrated 1996-2000

Employment rate by origin country and years since immigrating, women who immigrated 1996-2000
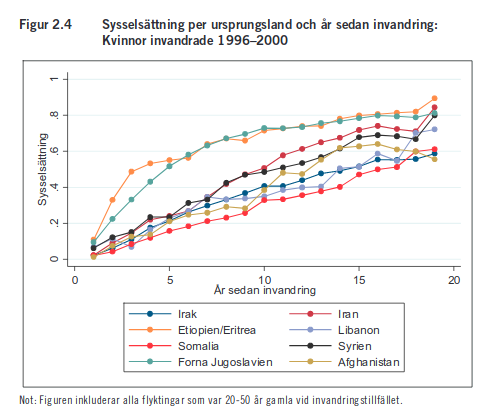
The curious results for Ethiopia and Eritrea decrease in later years as selection was lessened (and amounts increased!).
More juicy yet is that there is a 27 page online appendix with summary statistics (employment rate men/women, median income men/women, proportion of net positive homes) broken down by time of immigration, duration of stay, and country of origin, and which also includes some countries not covered in the plots or much in the report: Chile, Romania/Hungary, Vietnam. I will analyze them hopefully later this year.