We’ve been over this before, but it’s a perennial topic. People like to claim that beyond a certain level of intelligence, additional intelligence doesn’t help to get X, where X variously claimed to be creativity, income, or success in life more generally. Malcolm Gladwell famously claimed this in his 2008 book Outliers: The story of success:
But there’s a catch. The relationship between success and IQ works only up to a point. Once someone has reached an IQ of somewhere around 120, having additional IQ points doesn’t seem to translate into any measurable real-world advantage.*
“It is amply proved that someone with an IQ of 170 is more likely to think well than someone whose IQ is 70,” the * The “IQ fundamentalist” Arthur Jensen put it thusly in his 1980 book Bias in Mental Testing (p. 113): “The four socially and personally most important threshold regions on the I Q scale are those that differentiate with high probability between persons who, because of their level of general mental ability, can or cannot attend a regular school (about IQ 50), can or cannot master the traditional subject matter of elementary school (about IQ 75),can or cannot succeed in the academic or college preparatory curriculum through high school (about IQ 105), can or cannot graduate from an accredited four-year college with grades that would qualify for admission to a professional or graduate school (about IQ 115). Beyond this, the IQ level becomes relatively unimportant in terms of ordinary occupational aspirations and criteria of success. That is not to say that there are not real differences between the intellectual capabilities represented by IQs of 115 and 150 or even between IQs of 150 and 180. But IQ differences in this upper part of the scale have far less personal implications than the thresholds just described and are generally of lesser importance for success in the popular sense than are certain traits of personality and character.”
Jensen of course did not claim that, see prior post for digging into this false attribution. But there’s a new study that everybody keeps sending me. And it’s based on impeccable data too:
-
Keuschnigg, M., van de Rijt, A., & Bol, T. (2023). The plateauing of cognitive ability among top earners. European Sociological Review.
Are the best-paying jobs with the highest prestige done by individuals of great intelligence? Past studies find job success to increase with cognitive ability, but do not examine how, conversely, ability varies with job success. Stratification theories suggest that social background and cumulative advantage dominate cognitive ability as determinants of high occupational success. This leads us to hypothesize that among the relatively successful, average ability is concave in income and prestige. We draw on Swedish register data containing measures of cognitive ability and labour-market success for 59,000 men who took a compulsory military conscription test. Strikingly, we find that the relationship between ability and wage is strong overall, yet above €60,000 per year ability plateaus at a modest level of +1 standard deviation. The top 1 per cent even score slightly worse on cognitive ability than those in the income strata right below them. We observe a similar but less pronounced plateauing of ability at high occupational prestige.
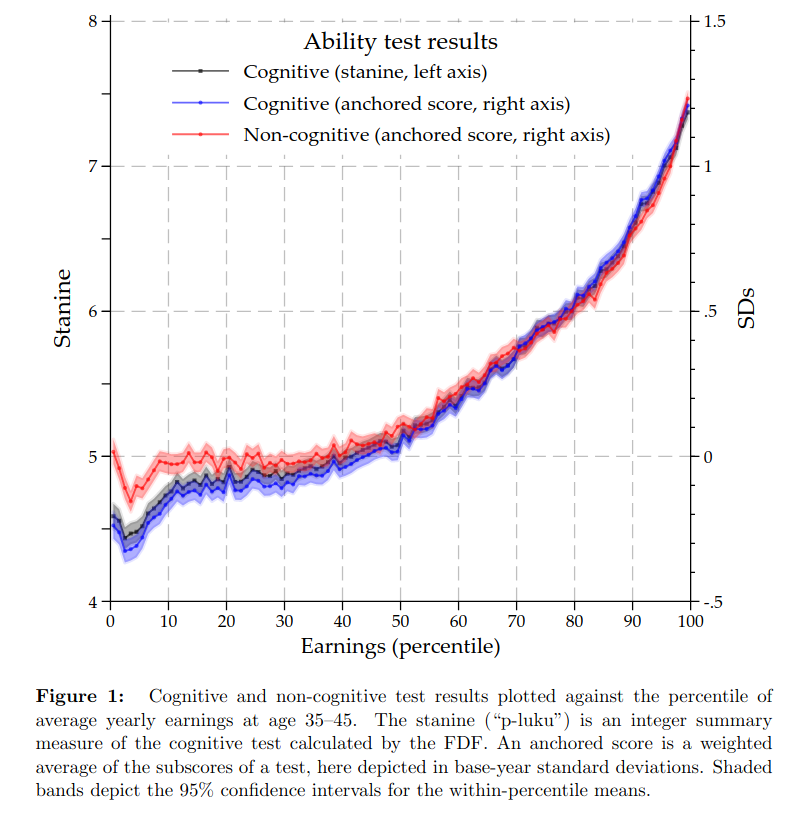
Their plot that everybody looks at:
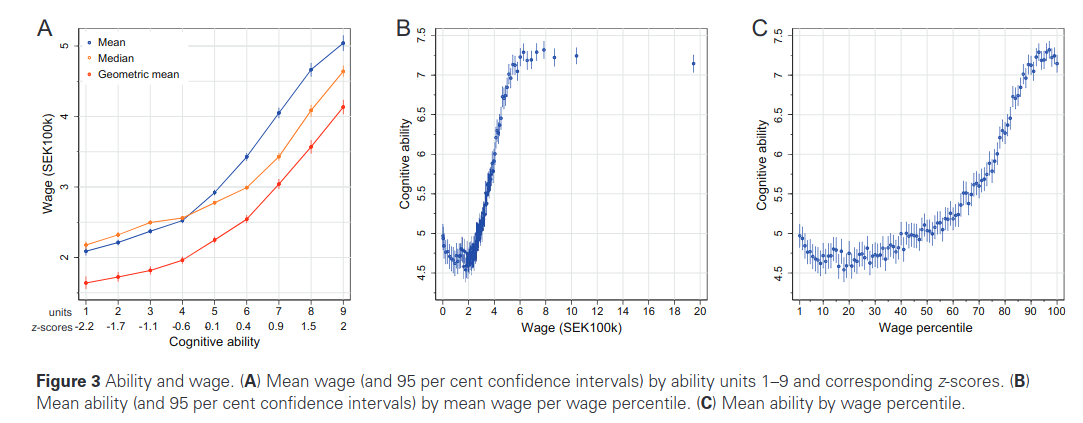
Note that their plot is causally reversed: wage is on the X axis, intelligence on Y, as if wages cause intelligence. They are particularly interested in the determinants of wages among the very wealthy, hence their flipped plots. They are citing various sociological theories about the usual lack of meritocracy, at least in some areas of the society, here at the top. Their C plot shows a strange looking nonlinear pattern where the very high waged people do not appear to have higher wage than the almost as highly salaried. This suggests lack of meritocracy at the very top of wages, maybe luck, or family connections. Their study does not actually show that there is an IQ threshold above a value which further intelligence does not result in yet higher wages (incomes, wealth etc.). We can see this by looking at the very intelligence people who were studied in the famous Terman study of the gifted. The income plot as a function of intelligence and personality look like this (Gensowski et al 2021):
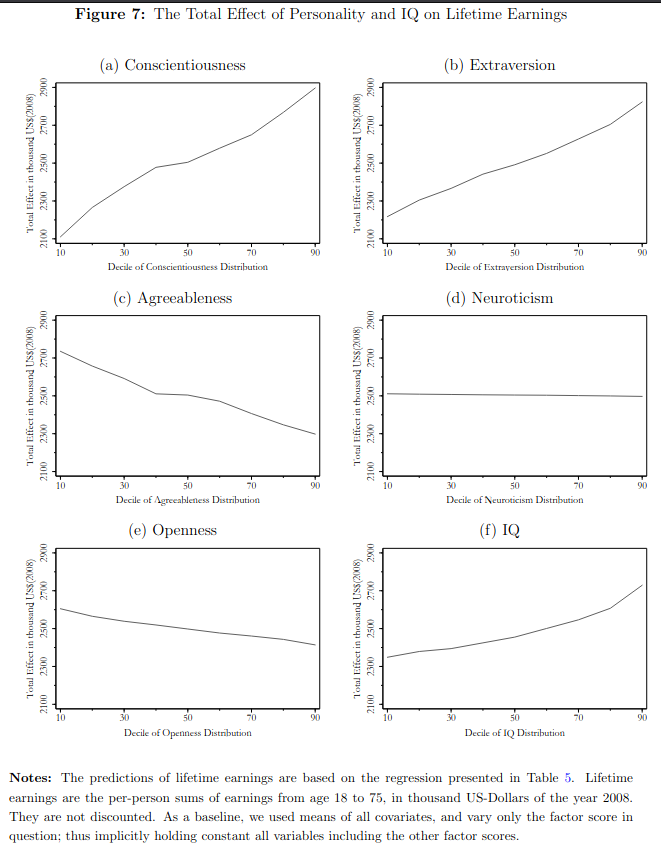
Look at the final plot, F. The curve has a slight upwards trend, so intelligence is actually more income for incomes the higher your IQ is, not less. Maybe being 150 instead of 140 makes you able to outsmart the last remaining competitors in your field, and reap all the benefits. And this lack of threshold is not just for income, it’s for other forms of achievement as well. This can be seen clearly in the SMPY study of the gifted (see near-complete bibliography at Gwern’s site) Lubinski 2009:
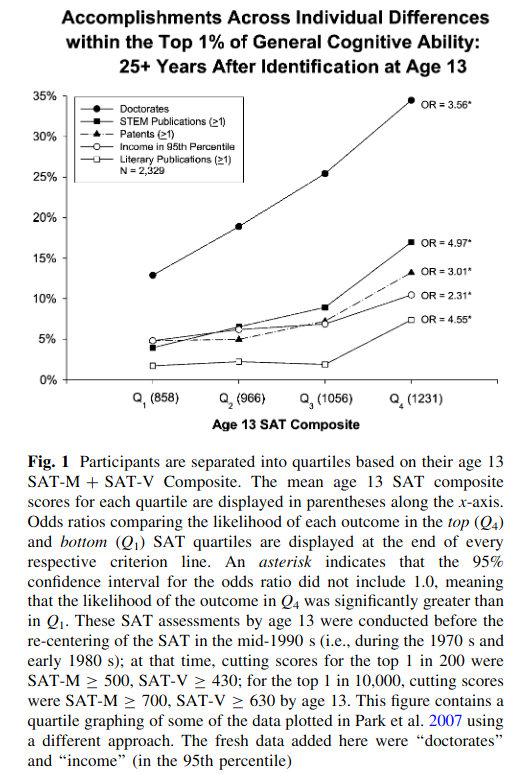
Here we see that within the SMPY cohort, which is very bright on average, maybe 140 IQ, the top quartile of super brights (160 IQ?) do better than the merely very brights (135?). This is true for: obtaining PhDs (doctorates), producing science (STEM publications), filing patents as a measure of innovation, income, and literacy production.
And just to bring it home, Finnish researcher Marko Terviö looked at their data following the publication of the Swedish study. Here’s his results (Terviö 2023):
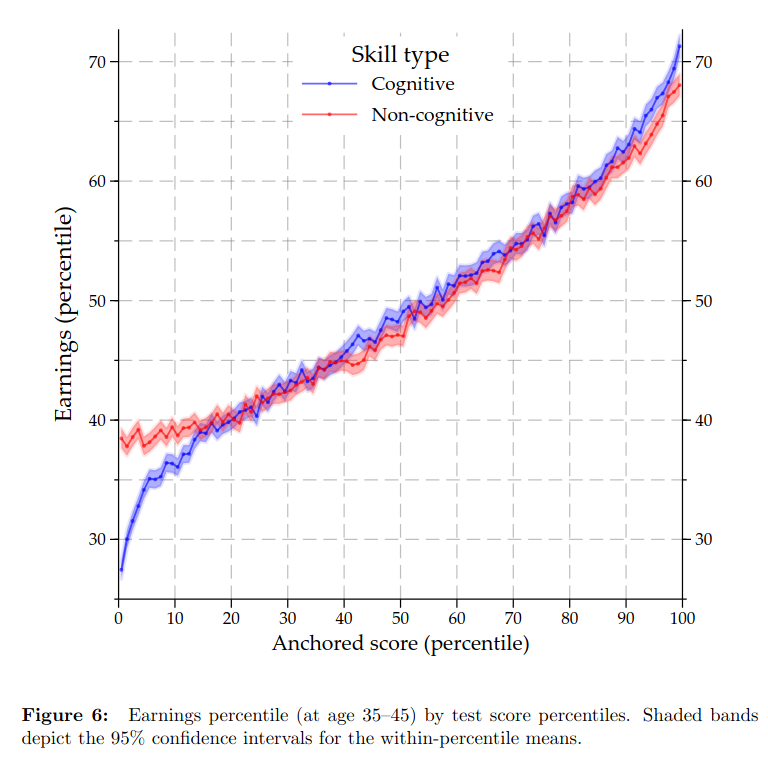
Note the normal direction of the axes, but the results are the same when he flipped them:
He tried various other subsets and transformations of the data (raw scores or centiles, cohort standardization), but all of them produced a similar looking plot with regards to the right tail. Note also the steeper income gradient at the very high IQs, same as the other datasets. So what causes the Swedish results? We don’t know but some ideas:
The shape of the flipped axis relationship of ability conditional on earnings looks mostly very similar here to what was found in similar Swedish data by Keuschnigg et al. (2023), with one very notable difference. Whereas they find that the relation- ship flattens out at about the 90th percentile of earnings, I find that in Finnish data the relationship becomes if anything steeper among top earners. The reason for this difference remains a mystery at the time of this writing, but I will offer a couple of speculative directions for closer investigation.
The first possibility is some mundane difference in data between Finland and Sweden. For example, the set of birth cohorts in Keuschnigg et al. (2023) is partly different, and the Swedish cognitive test has four subtests instead of the three in Finland. The hard part is to find a difference in data that would mostly affect the top earnings decile, while at lower deciles the picture looks so remarkably similar.
One such candidate is the definition of what counts as earnings as opposed to capital income—this distinction can be problematic in the best of cases. It is conceivable that differences in such categorizations would make much more of a difference among the top earners. Those with significant entrepreneurial income may be able to transform much it into capital income or private asset appreciation; the Finnish tax system certainly results in incentives to do so. Incidentally, in this Finnish data, changing the definition of earnings so as to exclude entrepreneurial income made little difference to the results (not shown).
Another possibility is that there were differences in test-taking behavior between the countries that affected the eventual top decile of earners differently from those below. In any case it is probably true that men with low motivation produce a noisier test result. If noisy-test-taking behavior is positively correlated with eventual top decile earnings in Sweden but not in Finland then this could explain why the ability-earnings relation plateaus only in Sweden.
One fact that makes the difference in test-taking behavior a plausible candidate for country differences is that in Sweden the cognitive ability test was taken before the start of actual military service, so the data covers also men who end up not doing the military service (it covers 94% of native-born men according to Keuschnigg et al. (2023)). Yet, as seen in Figure 8, of the top decile of Finnish male earners over 85% did serve in the military, and this propensity is about the same all along the top half of the earnings distribution. The top earners that are missing from the FDF data would have had to have an inordinate impact for their test results to flatten out the top of the ability-earnings curve, and again this would have to work out differently for the earners below them.
Finally, one possibility is that, despite their many similarities, the economic processes that determine the mapping from cognitive ability to top earnings really are that different in Finland and Sweden. However, I cannot come up with a mechanism what would cause it to be so.
I can think of a mechanism. Sweden famously has a strong elite with a large familial component (Björklund et al 2012):
This paper presents new evidence on intergenerational mobility at the top of the income and earnings distributions. Using a large dataset of matched father-son pairs in Sweden, we find that intergenerational transmission is very strong at the top, more so for income than for earnings. At the extreme top (top 0.1%) income transmission is remarkable with an intergenerational elasticity of approximately 0.9. We also study potential transmission mechanisms and find that IQ, non-cognitive skills and education of the sons are all unlikely channels in explaining the strong transmission. Within the top percentile, increases in the income of the fathers, if they are related at all, are negatively associated with these variables. Wealth, on the other hand, has a significantly positive association. Our results suggest that Sweden, known for having relatively high intergenerational mobility in general, is a society in which transmission remains strong at the very top of the distribution and wealth is the most likely channel.
Looks like this:
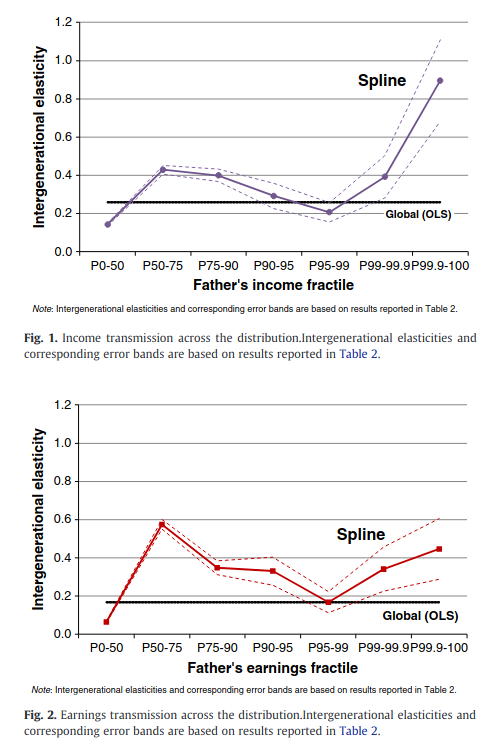
In other words, the correlations between fathers and sons is not that strong generally, but it becomes really strong at the high end of the distribution, probably because sons inherit large amounts of wealth from the father which they use for business purposes to enhance their own incomes, giving a very strong familial correlation for non-genetic reasons. So this is my guess for why the Swedish results are weird: they have a large familial elite that transmits wealth between generations, whereas Finland has a much smaller such elite (source: I don’t have any).
Honorary mention: if you are interested in high such strange nonlinear patterns can arise from perfectly linear data due to stanines (9 splits) and axis flipping, check out the “Brief Data Post” (5000 words) by Cremieux.