Prior results: 2019
Personal genomics company 23andme has a new preprint out describing their current approach and results:
-
Durand, E. Y., Do, C. B., Wilton, P. R., Mountain, J. L., Auton, A., Poznik, G. D., & Macpherson, J. M. (2021). A scalable pipeline for local ancestry inference using tens of thousands of reference haplotypes. BioRxiv, 2021.01.19.427308. https://doi.org/10.1101/2021.01.19.427308
Ancestry deconvolution is the task of identifying the ancestral origins of chromosomal segments of admixed individuals. It has important applications, from mapping disease genes to identifying loci potentially under natural selection. However, most existing methods are limited to a small number of ancestral populations and are unsuitable for large-scale applications.
In this article, we describe Ancestry Composition, a modular pipeline for accurate and efficient ancestry deconvolution. In the first stage, a string-kernel support-vector-machines classifier assigns provisional ancestry labels to short statistically phased genomic segments. In the second stage, an autoregressive pair hidden Markov model corrects phasing errors, smooths local ancestry estimates, and computes confidence scores.
Using publicly available datasets and more than 12,000 individuals from the customer database of the personal genetics company, 23andMe, Inc., we have constructed a reference panel containing more than 14,000 unrelated individuals of unadmixed ancestry. We used principal components analysis (PCA) and uniform manifold approximation and projection (UMAP) to identify genetic clusters and define 45 distinct reference populations upon which to train our method. In cross-validation experiments, Ancestry Composition achieves high precision and recall.
It’s pretty good, but technical. For most readers, an illustration may suffice. Results from my profile for my close family:


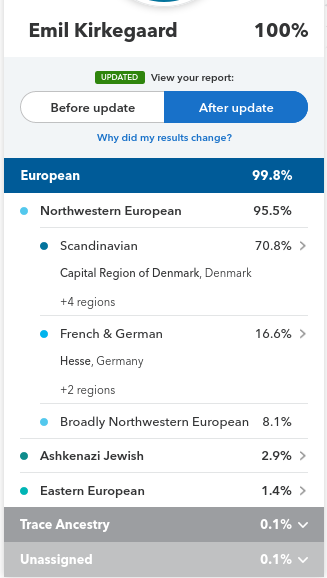
Quantitatively, we see these have some discrepancies. Putting the values into a spreadsheet, we get this result:
| Ancestry | Emil | Brother | Sibling cohort mean | Difference | Parental mean | Father | Mother | Mother’s mother |
| Scandinavian | 70.80% | 79.50% | 75.15% | -4.10% | 79.25% | 77.30% | 81.20% | 91.20% |
| French and German | 16.60% | 6.80% | 11.70% | 1.85% | 9.85% | 13.00% | 6.70% | 0% |
| British and Irish | 0.00% | 2.00% | 1.00% | 0.15% | 0.85% | 0.00% | 1.70% | 2.50% |
| Broadly Northwestern European | 8.10% | 9.90% | 9.00% | 2.90% | 6.10% | 2.80% | 9.40% | 3% |
| Ashkenazi Jewish | 2.90% | 0.80% | 1.85% | -0.75% | 2.60% | 5.20% | 0.00% | 0% |
| Eastern European | 1.40% | 0.60% | 1.00% | 0.05% | 0.95% | 1.00% | 0.90% | 1.90% |
| Southern European | 0.00% | 0.30% | 0.15% | 0.15% | 0.00% | 0.00% | 0.00% | 1.40% |
| Unassigned/trace | 0.20% | 0.10% | 0.15% | -0.25% | 0.40% | 0.70% | 0.10% | 0.00% |
So, if a parent was pure ancestry, the children must be exactly half of the parents’ mean. However, if parent’s homologous (the two copies of the same numbered chromosome) differ in ancestry, and they give a chromosome that’s a mix of these chromosomes (recombination), then children can differ from their parents’ mean ancestry. In my family’s case, there are 3 dead grandparents which I don’t have data from. For my parents, we can compute the expected value for the sibling cohort (i.e., me and my brother), and we can compute the actual average. These are fairly closely in line. We see that Scandinavian ancestry appears to be decreasing over time or generations: 91.2% in grandparent, 79.3% in parents, 75.2% in children. If this is not just a coincidence, I am guessing it is a modeling bias because they train their models on older people who has verified pure ancestry of that local region (as far as family records go), and it declines somewhat in accuracy for the younger generations due to haplotypes (blocks of DNA being inherited together) being mixed up.