Probably most social science is done using data that are based on self-report. Thus, they are crucially dependent on assumptions that self-report data reflect objective reality. There are some large studies or meta-analysis that compare self-report to objective results. To take a simple example. Kuncel et al 2005 meta-analyzed self-report GPA versus actual GPA from school records:
Results for the analyses of the accuracy of self-reported grades and ranks are presented in Table 1. The validity of GPA across all samples was relatively high (N = 56,265, k = 29, robs = .84), with college GPA being reported somewhat more accurately (N = 12,089, k = 12, robs = .90) than high school GPA (N = 44,176, k = 17, robs = .82). The validity of self-reported grades for individual subjects was lowest for art and music classes (N = 1,627, k = 3, robs = .67), and highest for social science classes (N = 8,937, k = 8, robs = .85). The validity of self-reported high school rank was slightly lower than the validity of self-reported high school GPA, both when high school rank was reported as a percentile (N = 1,346, k = 3, robs = .76) and when it was reported as a raw score (N = 6,897, k = 3, robs = .77). There were no large differences in the validity of self-reported GPA of males (N = 14,315, k = 7, robs = .79) and females (N = 13,179, k = 5, robs = .82). The validity of self-reported GPA for White students (N = 13,831, k = 3, robs = .80) was higher than the validity of self-reported GPA for non-White students (N = 5,544, k = 8, robs = .66).
[robs = r_observed, k = number of studies, N = sample size]
So men were just a bit less accurate than women (.79 vs. .82), but nonwhite students a lot less (.80 vs. .66). Overall, however, we are kinda happy enough here unless we happen to be studying something that relates to differential accuracy. It would be unwise to study race differences in self-reported GPA without being mindful of this reliability difference. They also found that self-reported SAT correlates .82 with real SAT. However, there is overall a lot of inflation. For grades in college, the Cohen’s d was 1.38! For SAT, only about 0.20 d.
Another common area is self-report criminal behavior and race. I wrote about this at length before, but evidence shows that blacks falsely report/lie more on questionnaires than whites do, and this results in very problematic group comparisons using self-report as proxies for real differences.
So, what happens when we move on to an area where we don’t just have an objective standard to compare with? The most obvious example is the study of personality. While one can come up with objective measures, these are rarely used. When people get fancy, they usually use other-report, meaning we ask someone else to rate the person, such as their class mates, teacher(s), or even their spouses. While this may introduce its own biases, these biases will be somewhat different from the self-evaluation biases. Thus, by averaging such measures, we can get closer to True Personality™. Evidence indeed supports this. Other-rated personality and composite personality (based on self and other report) correlates more strongly with other outcomes, and importantly, shows stronger heritabilities. This is also true in the psychiatric domain: 40% heritability for ADHD self-report, 80% for composite report. And even for physical measures: BMI heritability is about 5% lower when using self-report vs. doctor measured height (beware p = .03 but probably real).
Why is self-report so far off, though? In the case of physical traits using absolute metrics (centimeters), there is no question about the scale. However, what about the typical personality questionnaire? It essentially involves implicit comparison with other people. Do you like parties? Well, compared to whom? Japanese? Introverts? People use end up using different reference groups for their comparisons. Thus, this problem is called the reference group effect. There are some good papers on this:
- Heine, S. J., Lehman, D. R., Peng, K., & Greenholtz, J. (2002). What’s wrong with cross-cultural comparisons of subjective Likert scales?: The reference-group effect. Journal of Personality and Social Psychology, 82(6), 903–918. https://doi.org/10.1037/0022-3514.82.6.903
-
Crede, M., Bashshur, M., & Niehorster, S. (2010). Reference group effects in the measurement of personality and attitudes. Journal of Personality Assessment, 92(5), 390-399.
-
Heine, S. J., Buchtel, E. E., & Norenzayan, A. (2008). What do cross-national comparisons of personality traits tell us? The case of conscientiousness. Psychological Science, 19(4), 309-313.
The problem only gets worse when we are dealing with comparisons to people one doesn’t even know, such as most foreigners. What happens when we want to measure cultural distances using self-report? People don’t include, say, Japanese or Sengalese in their reference groups, so how exactly would one compare these groups? Heine et al 2008 tried to deal with this problem above by switching to objective measures of one key personality trait, conscientiousness.
Much research contrasts self-reported personality traits across cultures. We submit that this enterprise is weakened by significant methodological problems (in particular, the reference-group effect) that undermine the validity of national averages of personality scores. In this study, behavioral and demographic predictors of conscientiousness were correlated with different cross-national measures of conscientiousness based on self-reports, peer reports, and perceptions of national character. The predictors correlated strongly with perceptions of national character, but not with self-reports and peer reports. Country-level self- and peer-report measures of conscientiousness failed as markers of between-nation differences in personality.
Their table:
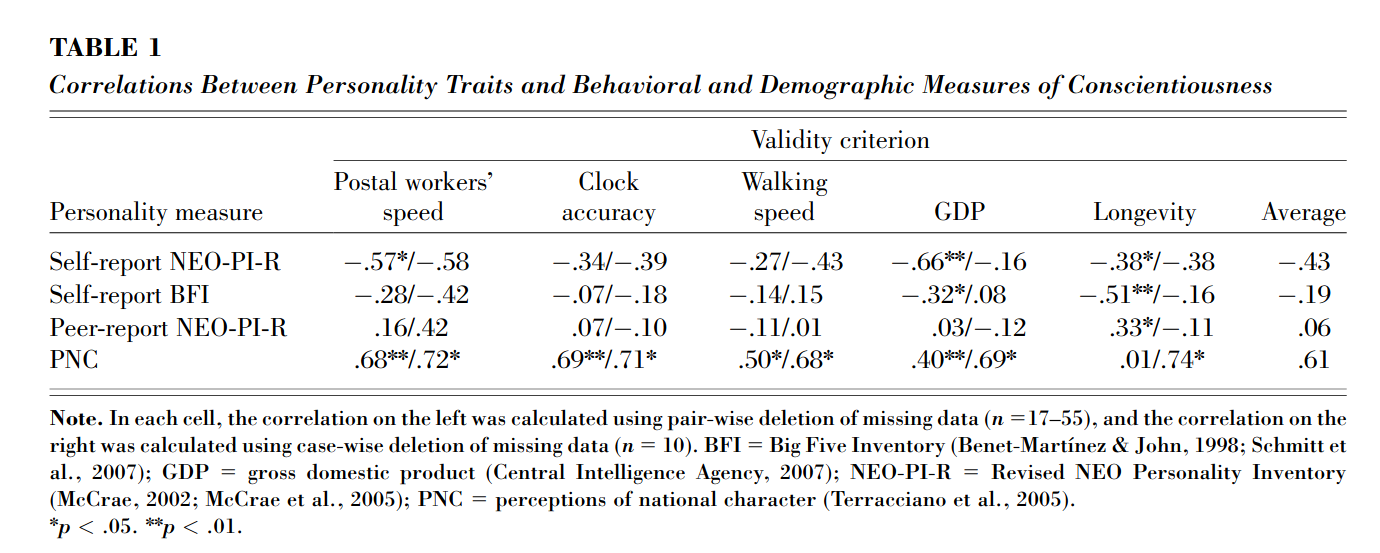
So, they paradoxically show that self-report measures of conscientiousness by country correlate mostly negatively with objective measures like clock accuracy BUT national stereotypes correlate strongly as expected.
Another name for mostly the same idea is the shifting standards model. The idea here is that when we use comparative adjectives such as strong or tall, they involve a comparison to some group, and who this group is depends on contextual features. When we say your friend Suzie is tall, generally, we mean she is tall for a woman, and probably for her ethnicity. A tall European woman might be about 180 cm, which is not at all tall for a European man, but about average. It would be very tall for Japanese women and tall for Japanese men. I covered this in some detail in a prior book review, but in an image, it looks like this:
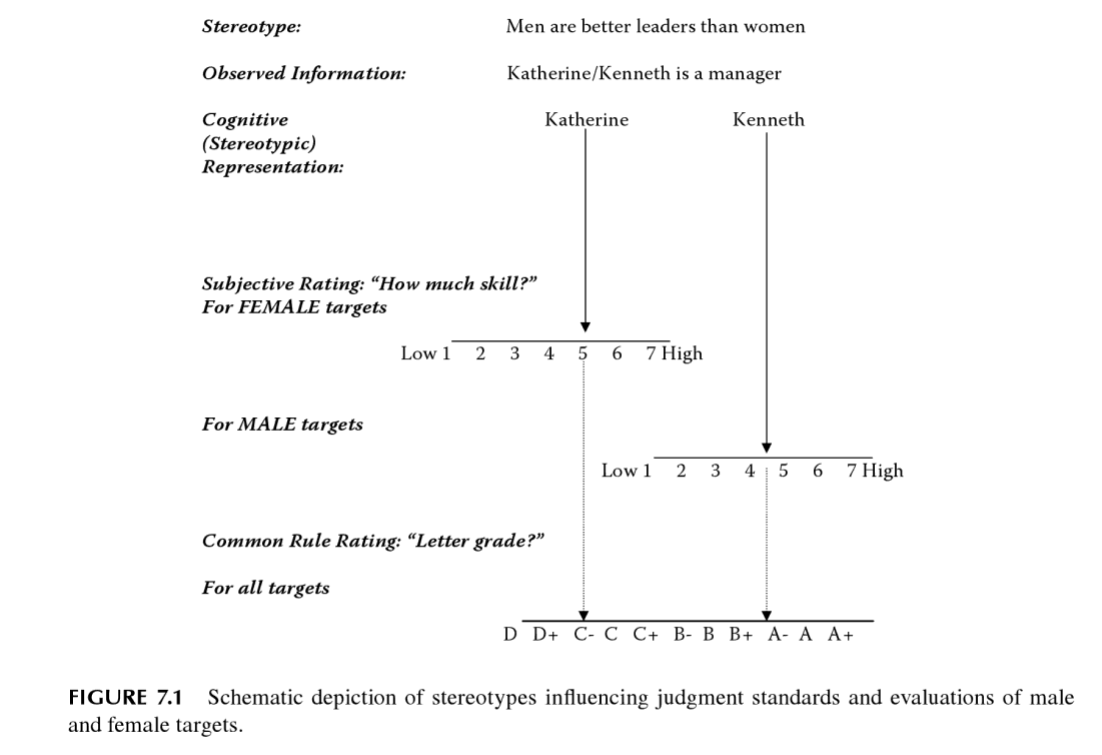
This figure is from the 2009 book chapter on the model. As you can imagine, since this is not exactly the usual ‘all stereotyping is bad and sexracist’, the model is mainly promoted by one person Monica Biernat. Judging from the titles, she haven’t been doing this work much the last 10 years, but shifted her attention to something more PC.