Back in 2017, I wrote about how Sweden has a policy of hiding their immigrant crime rate statistics. (See also this tweet.) One cannot even buy them from the statistics office, I tried in vain for a few months. However, it is also known that the Swedish authorities previously released such statistics from the 1980s and from around 2000 (in 2005). These we covered in the prior post and they look pretty much like the Danish data, i.e., Muslims and Africans are high, Asians low, other Europeans close to the Swedish average.
So what does the new report show? It’s in Swedish, and it’s called: Misstänkta för brott bland personer med inrikes respektive utrikes bakgrund (Suspects of crime among persons with domestic and foreign background). I read it over and wrote a piece in Danish that summarizes it for Kontrast magazine. This post is then the English summary (aside from my prior tweets).
To understand the results, we first need to understand how they classify people in Sweden. It’s based on the last 2 generations. So they have groups like native born with native born parents. These will be almost entirely ethnic Swedes and some other older mostly European immigrant descendants like Danes and Finns. Then they have two categories for native born with 1 or 2 foreign born parents. These are the 2nd generation immigrants, including mixed ancestry ones. Again, very sensible. Finally, there is the foreign born category, i.e., 1st generation immigrants. With that in mind, let’s look at their key figures.
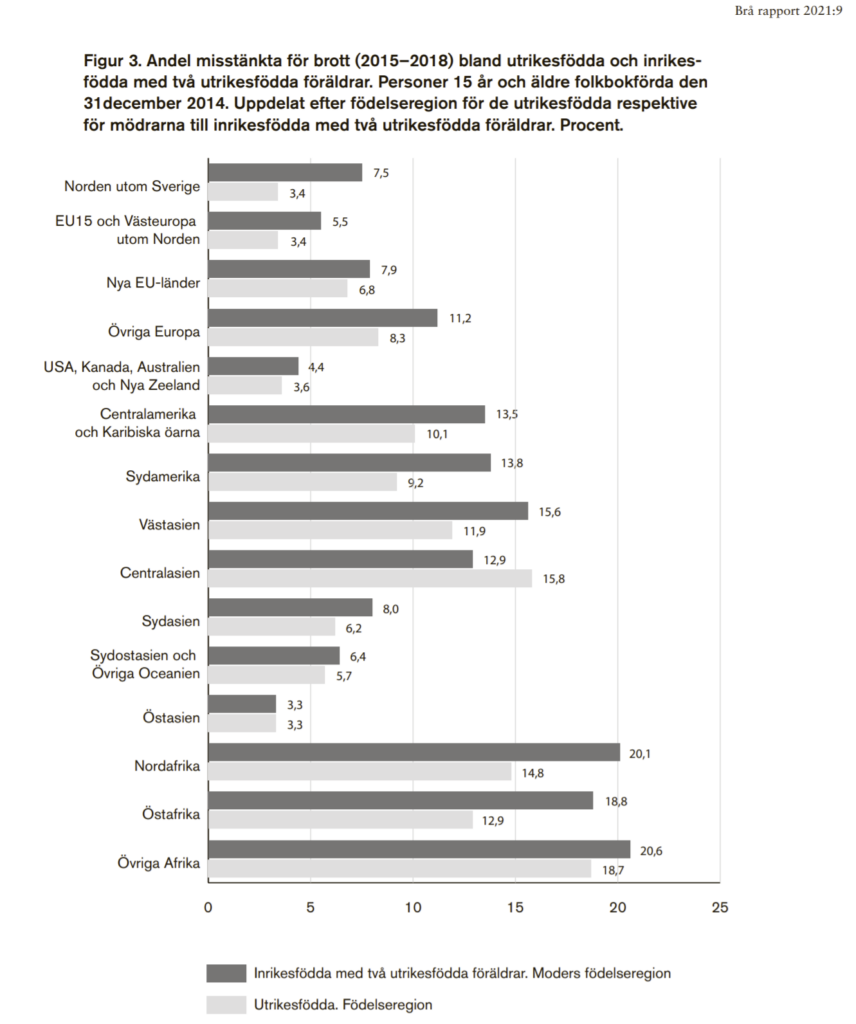
The dark color shows the native borns with 2 foreign born parents i.e., 2nd generations, while the light color shows the foreign borns, i.e., 1st generations. The country names and regions should be pretty readable in English, e.g. Nya EU-länder = new EU countries (i.e., the east expansion members), Östafrika = East Africa (Somalia, Ethiopia etc.), Övriga Afrika = remaining/other Africa (i.e., those not north or east African, so e.g. Congo). To note about this figure is that it is only about persons aged 15+ and it covers the percentage of persons who were suspected of at least one crime.
Of interest here is that the other Nordic countries are relatively high for the second generation. Why? Probably the fact that these are very young, and limited the data to persons aged 15+ does not fully adjust for this age confound. Aside from that, the typical offenders are present: the high scorers are almost tied between North Africa at 20.1% and other Africa at 20.6%. In their next key figure, they adjust for this problem.
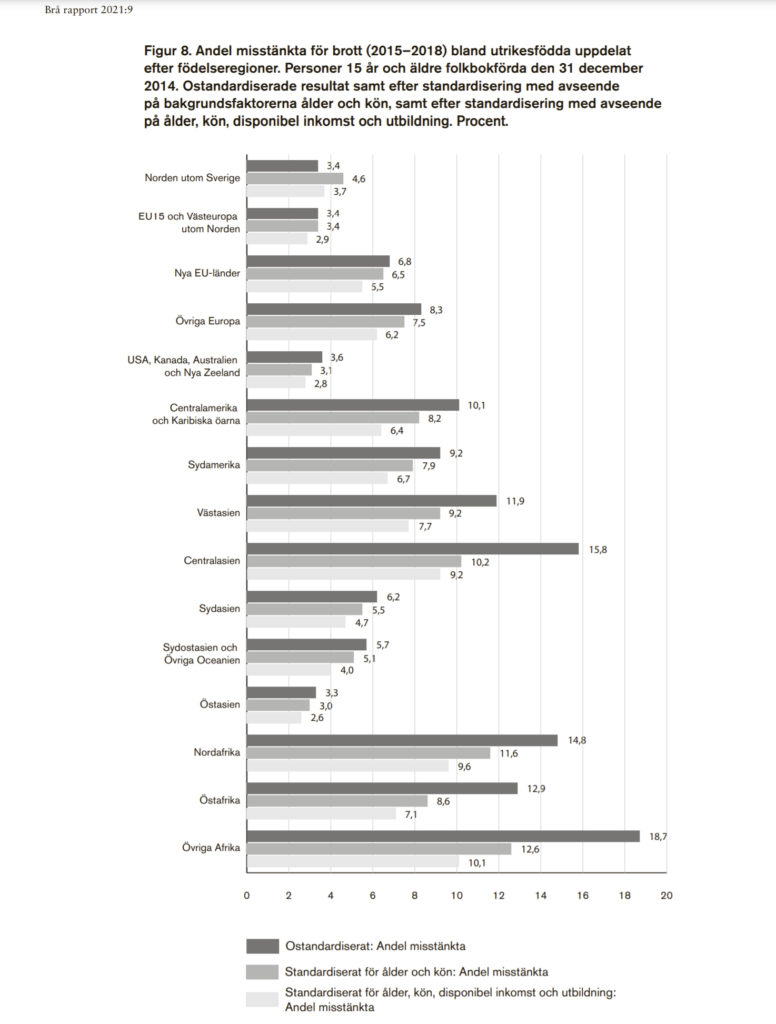
This figure concerns only foreign borns, i.e., 1st generations. There is seemingly no figures for 2nd generations with adjustments. Odd! The three colors show respectively: dark = no adjustments (same as the light bars in the prior figure), middle = adjusted for age and sex. Light = adjusted for age, sex, disposable income and education.
Generally, the adjustments make the gaps smaller. The first adjustment is very sensible if we want to compare expected long term rates, as the populations will eventually near-equalize in age and sex distributions, assuming no new immigrants (constant influx of new young males will keep the pattern closer to the current rates). This makes a large difference for the biggest offenders, e.g. other Africa is reduced from 18.7% to only 12.6%. The native Swede % is actually 3.2%, so this rate is still a lot more, 3.9 times (i.e. +290%). If we go further and overadjust á la sociologist fallacy, we get down to 10.1%, which is still 3.2 times as high.
Next they go back to the main groups of persons and look at specific crime rates of high interest:
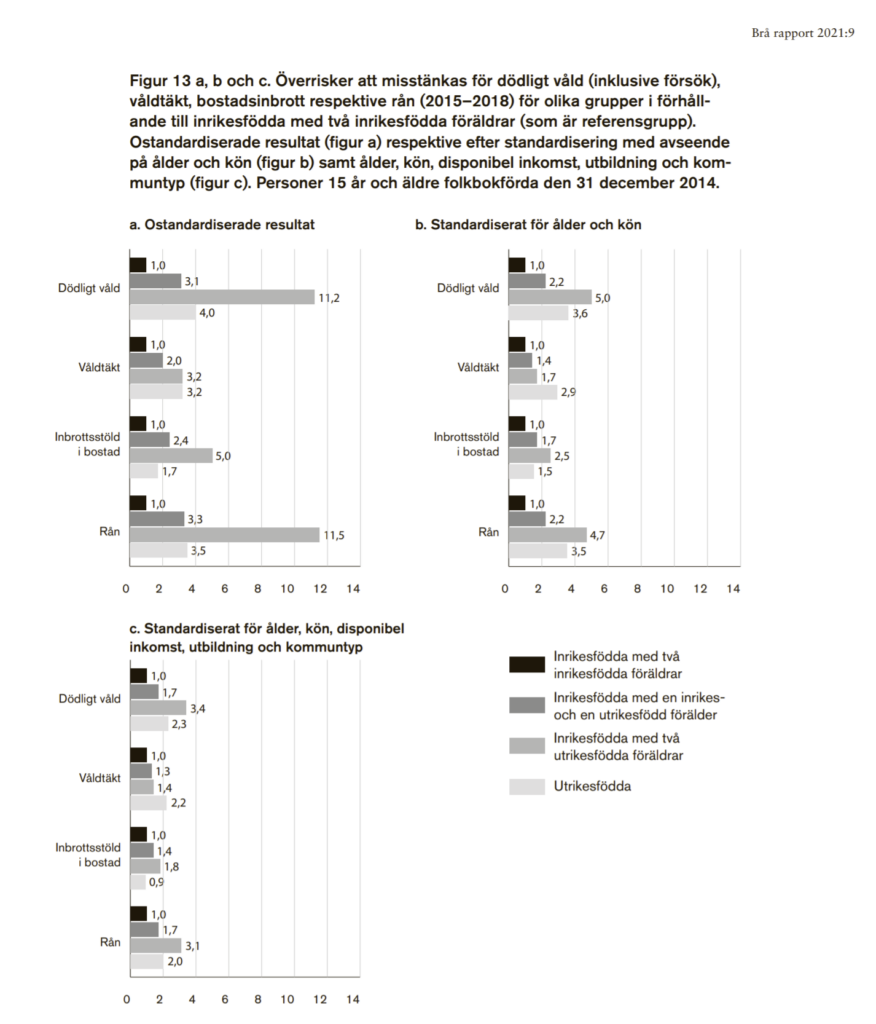
Here they no longer show the percentages, but relative rates (ethnic Swedes = 1.0). The four colors indicate the different groups: darkest = native born with 2 native parents, so these are 90%+ ethnic Swedes. next-darkest = native born with one foreign born parent (2nd generation mixed). Next-lightest = native born with 2 foreign born parents (2nd generation). Lightest = foreign borns (1st generation). The four category of crime are, from the top: deathly violence, rape, breaking and entering, and robbery. The three subplots represent the different adjustments: top left = no adjustments, top right = adjusted for age and sex, bottom left = adjusted for age, sex, disposable income, education, and commune of residence. As before, we are mainly interested in the top 2 subplots. For instance, among those born in Sweden with 2 foreign born parents, the relative rate of robbery is 4.7 times that of ethnic Swedes, and the rape relative rate is 1.7 times. Without age and sex adjustment, these values are 11.5 (+1050%!) and 3.2. In line with genetic models, we see that mixed origin persons are roughly halfway between the ethnic Swedes and the full blooded groups. E.g. for robbery, with age and sex adjustment, the relative rates are 4.7 and 2.2, respectively.
Finally, we might wonder about specific countries. The figures in the main report do not provide these values, but the appendix does:
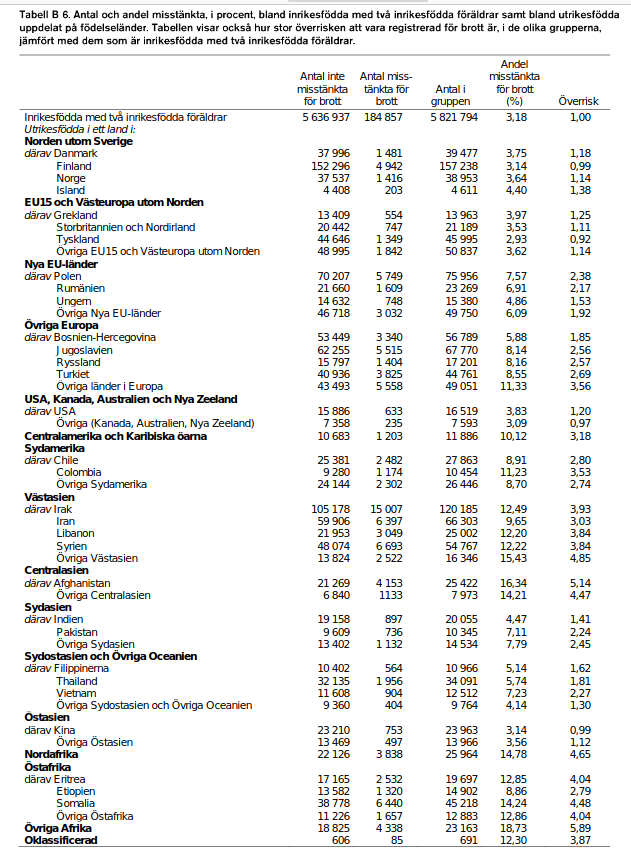
The table shows raw counts, the percentage (column 4) and the relative rate (column 5). The numbers concern only foreign born persons, again there appear to be no numbers for the 2nd generation. The numbers are not adjusted for age and sex, so they will have some amount of confounding. With that in mind, the top offenders are: Afghanistan at 16.3%, other African at 18.7%, north Africa at 14.8%. There are further tables that provide numbers with the adjustments (Tabell 10 and Tabell 11), click to see full size:


Are there any improvements? The authors themselves ask this question and you guessed the answer:
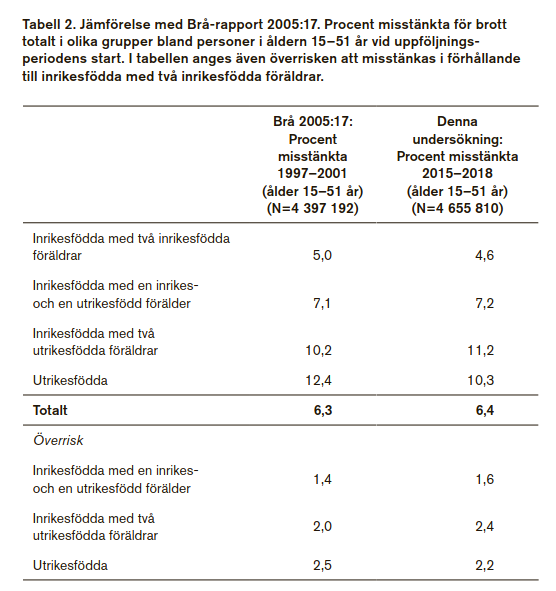
These are the same 4 groups as before: ethnic Swedes, native born 1 foreign parent, native born 2 foreign parents, foreign born. Rates on top, relative rates below. Authors conclude:
Although the follow-up period is one year shorter in the present study, the results are generally similar. It can further be stated that the proportion of suspects at current ages among domestic-born with two foreign-born parents is slightly higher in the present survey than in the previous one (11.2 compared with 10.2 per cent). This means that the proportion of suspects has increased somewhat in this group since the previous study, which referred to the period 1997–2001. The excess risk of being suspected, in this group in relation to domestic-born with two domestic-born parents, is also somewhat greater in the present study (2.4 compared with 2.0). [Google translate]
In other words, not much to see. The groups that were most criminal in the previous report from 2005, covering data from 1997-2001 and the current report, which covers data from 2015-2018, are pretty much the same and the results are the same too. There has been no improvement, no further ‘integration’.
So let’s look at how these numbers compare to those from the 1980s:
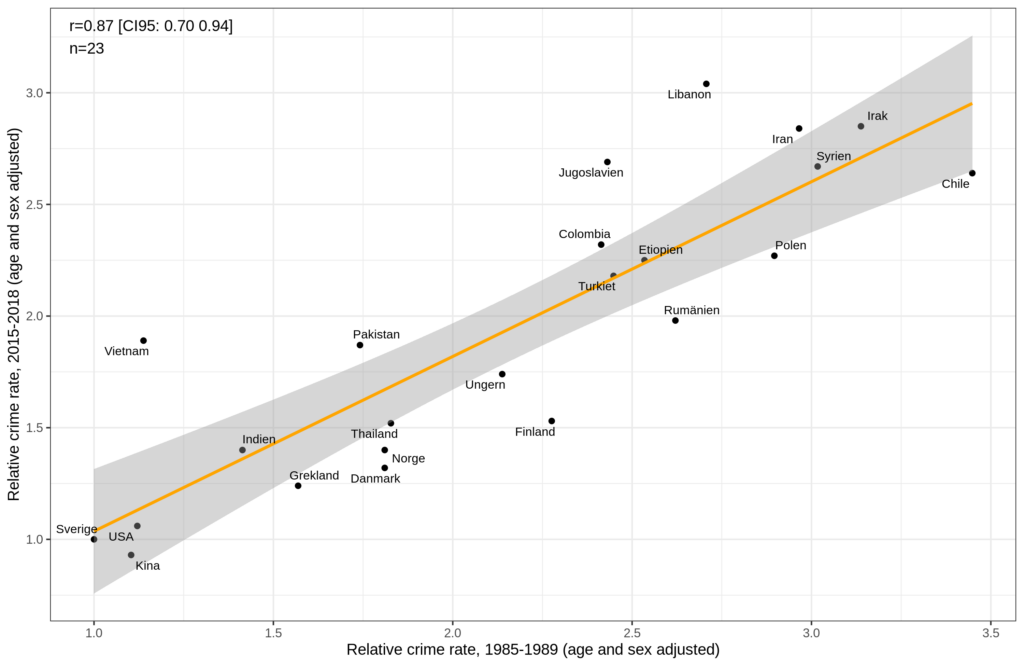
With an overlap of 23 countries between the periods, the correlation is very strong: r = .87. Not much has changed in those near 20 years. The new ones concern only 1st generation, and maybe the old ones include 2nd generation, but there can’t be many of those in the 1980s.
Here I did expand the combined lists of countries in the old dataset (e.g., a rate for the group of X, Y, Z, was split and assigned to each of the as separate cases). For the new data, I did not do this in general, though one could and maybe should. It would take some time as one has to look up the reference group listing in their appendix. E.g. “Övriga Sydamerika” (other south America) would expand to a long list of somewhat heterogeneous countries (Argentina, Bolivia, Brasilien, Ecuador, Guyana, Paraguay, Peru, Surinam, Uruguay, Venezuela).