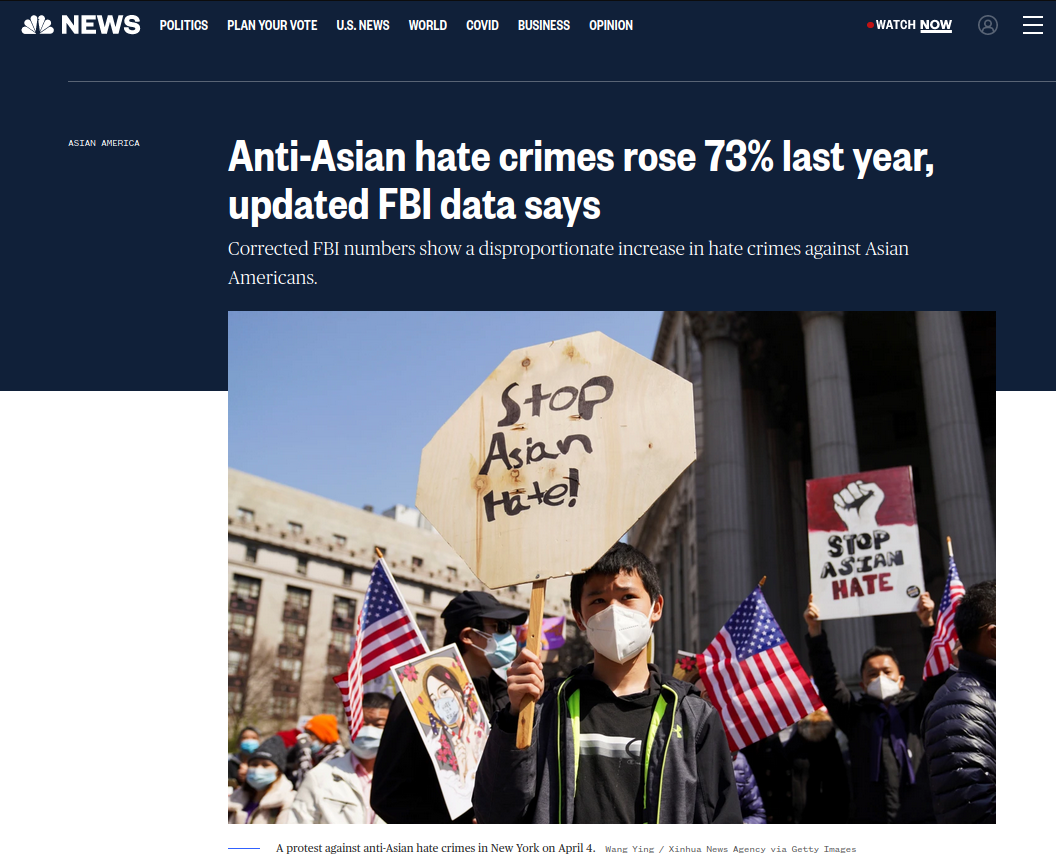
NBC:
PBS:

There’s an endless number of govt and semi-govt websites already:
- Main non-profit: https://stopaapihate.org/
- NYC government: https://www1.nyc.gov/site/cchr/community/stop-asian-hate.page
- United Nations: https://www.ohchr.org/en/stories/2022/03/if-we-stay-silent-violence-continues
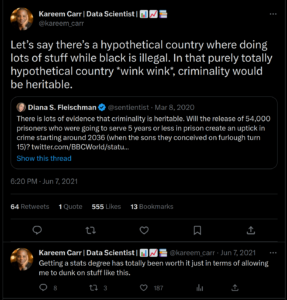
Of course, the conservatives are on the defensive in the dumbest possible way:
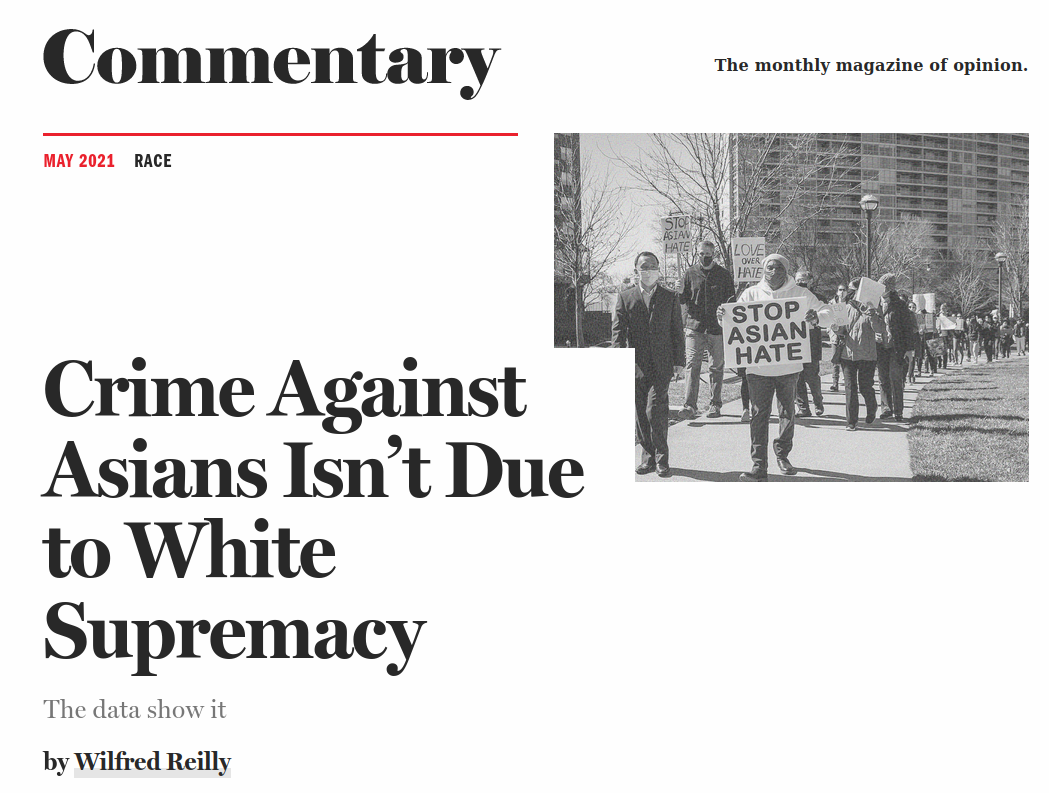
Pro tip for PR and warfare in general: do not be on the defensive on purpose. When you say it’s not due to ‘White Supremacism’ you accept the debate is about that topic.
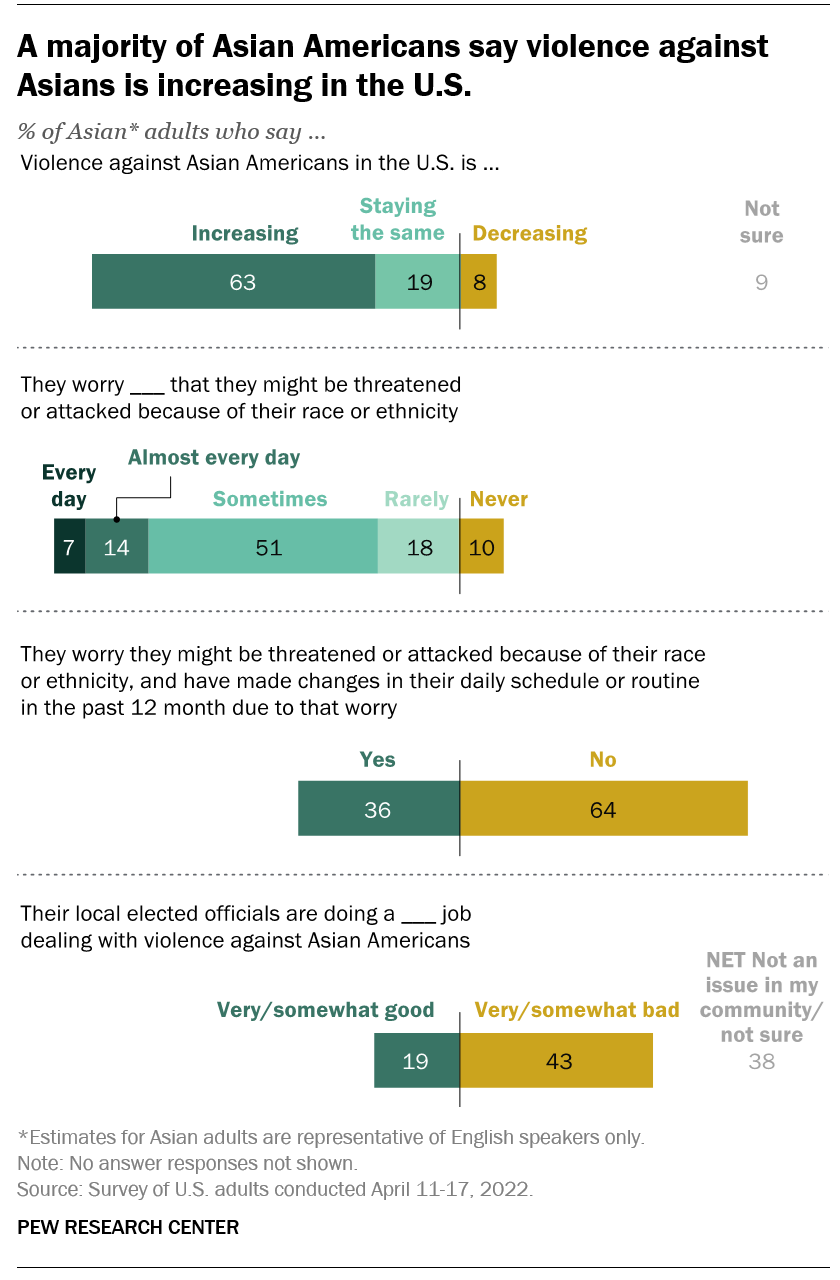
Asians say they are being attacked more:
And you might be wondering, so who is attacking Asians? First hit on Google is this one, but it’s off-narrative:
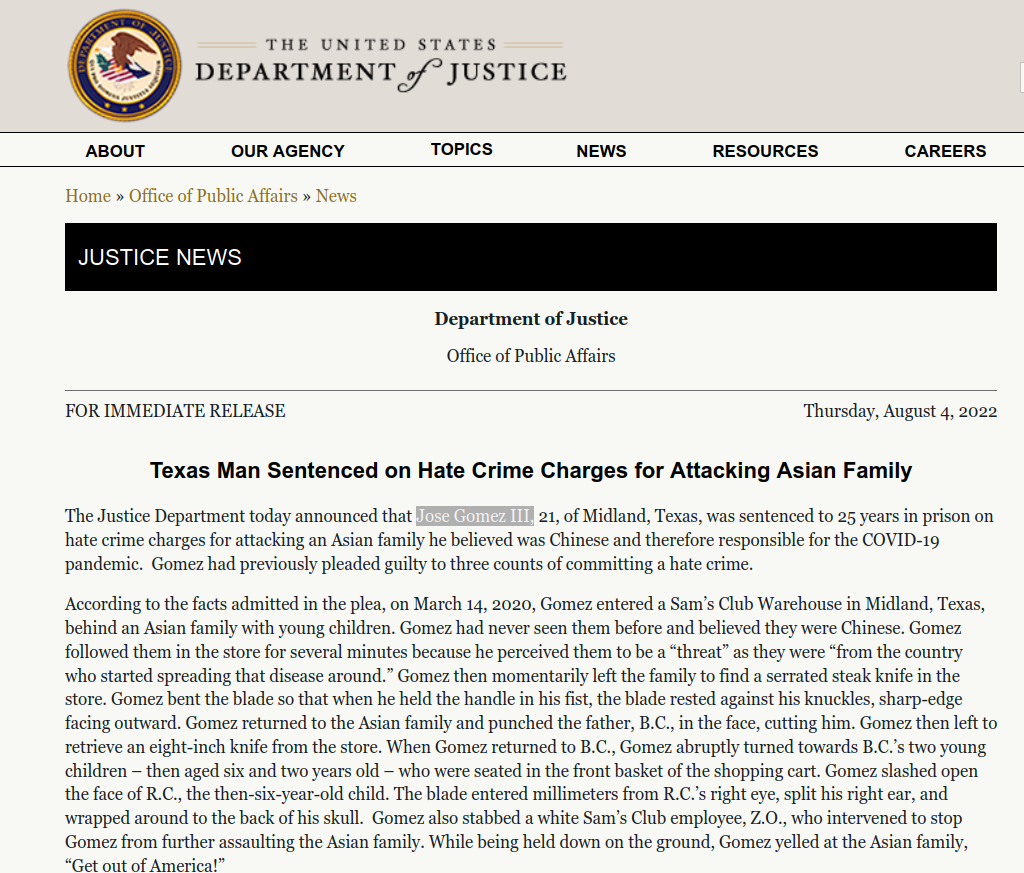
Gomez sure doesn’t sound very White Supremacist to me. But it sets the stage. What are the actual crime statistics? This tweet has been floating around on Twitter for a while:
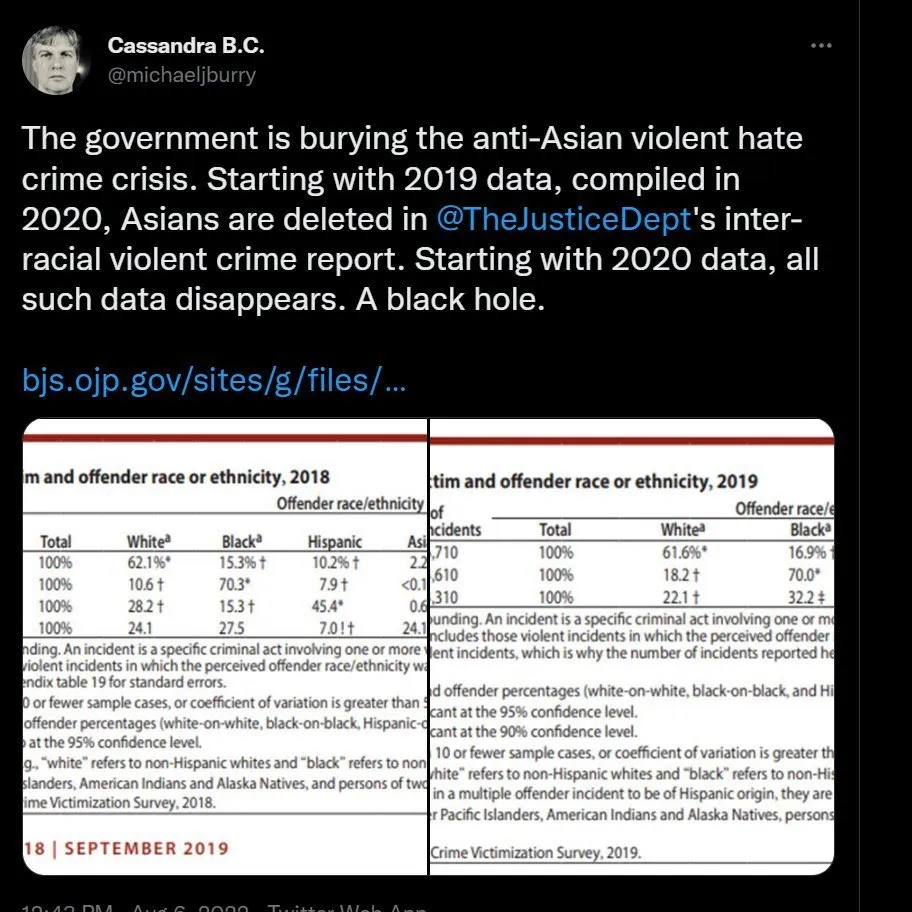
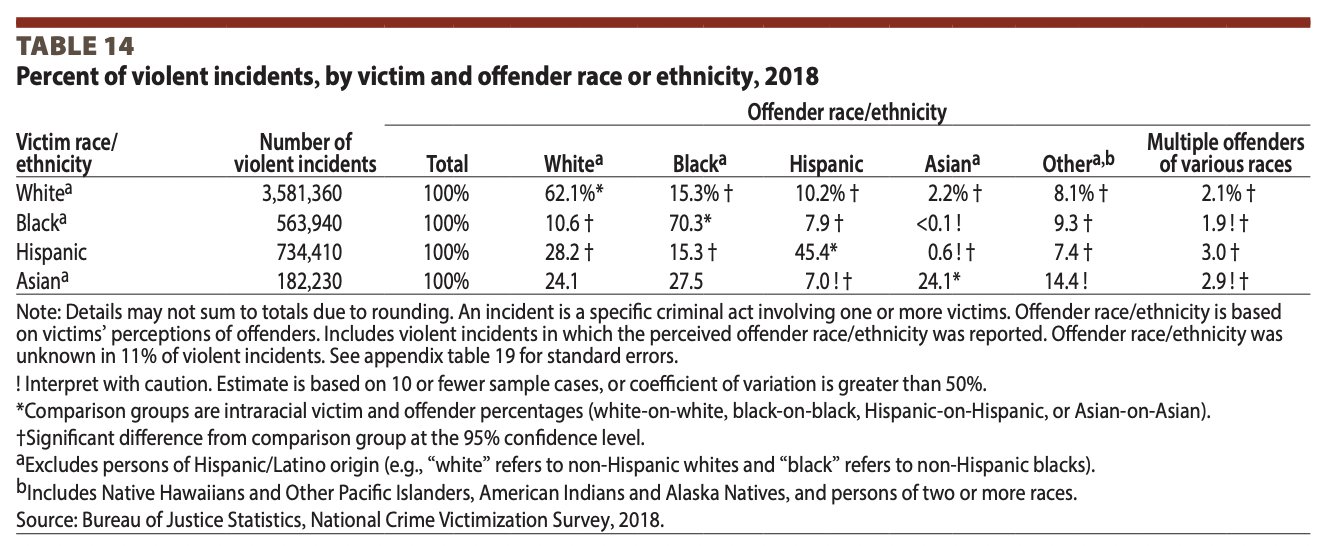
Here’s the tables and their direct links. They’ve also been archived in the not so unlikely case that the US govt decides to retroactively edit the reports. 2018 https://bjs.ojp.gov/content/pub/pdf/cv18.pdf:
2019 https://bjs.ojp.gov/content/pub/pdf/cv19.pdf:
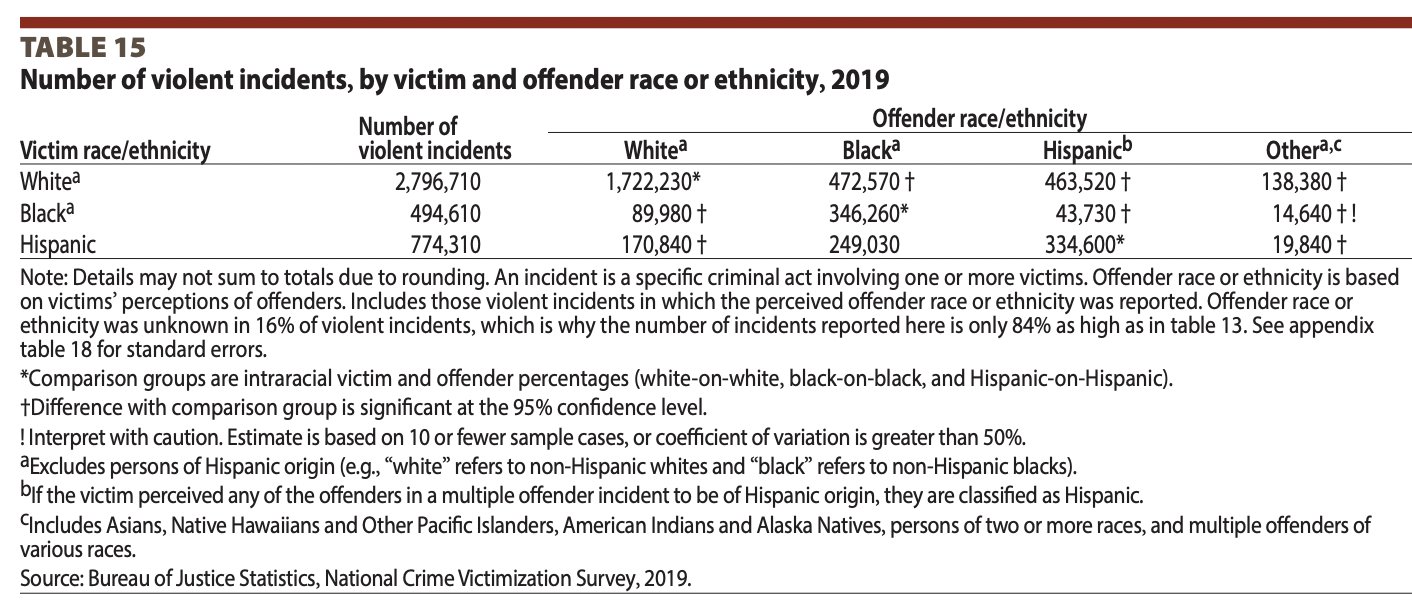
Notice the missing row? You can see why it went missing. It showed the distribution of people that Asians themselves reported to be attacking them. The largest attacker group are Blacks, at 27.5%. Next up are Asians at 24.1%, Whites at 24.0%, Others at 14.4% and Hispanics at 7.0%. However, as these groups are not the same size, we will want to compute the relative rates. The population proportions are: 57.8% white, 18.7% Hispanic, 12.4% Black and 6% Asian. This is for the entire adult population, which is somewhat wrong, but good enough for first approximation. So we divide, and we get: Blacks 27.5/12.4=2.22, Asians 24.1/6=4.01, Whites 24.0/57.8=0.42, Hispanics 7/18.7=0.37. The remainder group Others is a bit difficult to compute here, so we will leave it be. But we see clearly now. The main attackers of Asians are:

OK, it is a bit unfair because of racial segregation in where people live, Asians mostly live with other Asians, Blacks with Blacks, Whites with Whites etc., so most attackers of a given race are going to be someone who is close by, so likely a member of the same race. It’s easy to see this using the racial dot map, say, New York City:
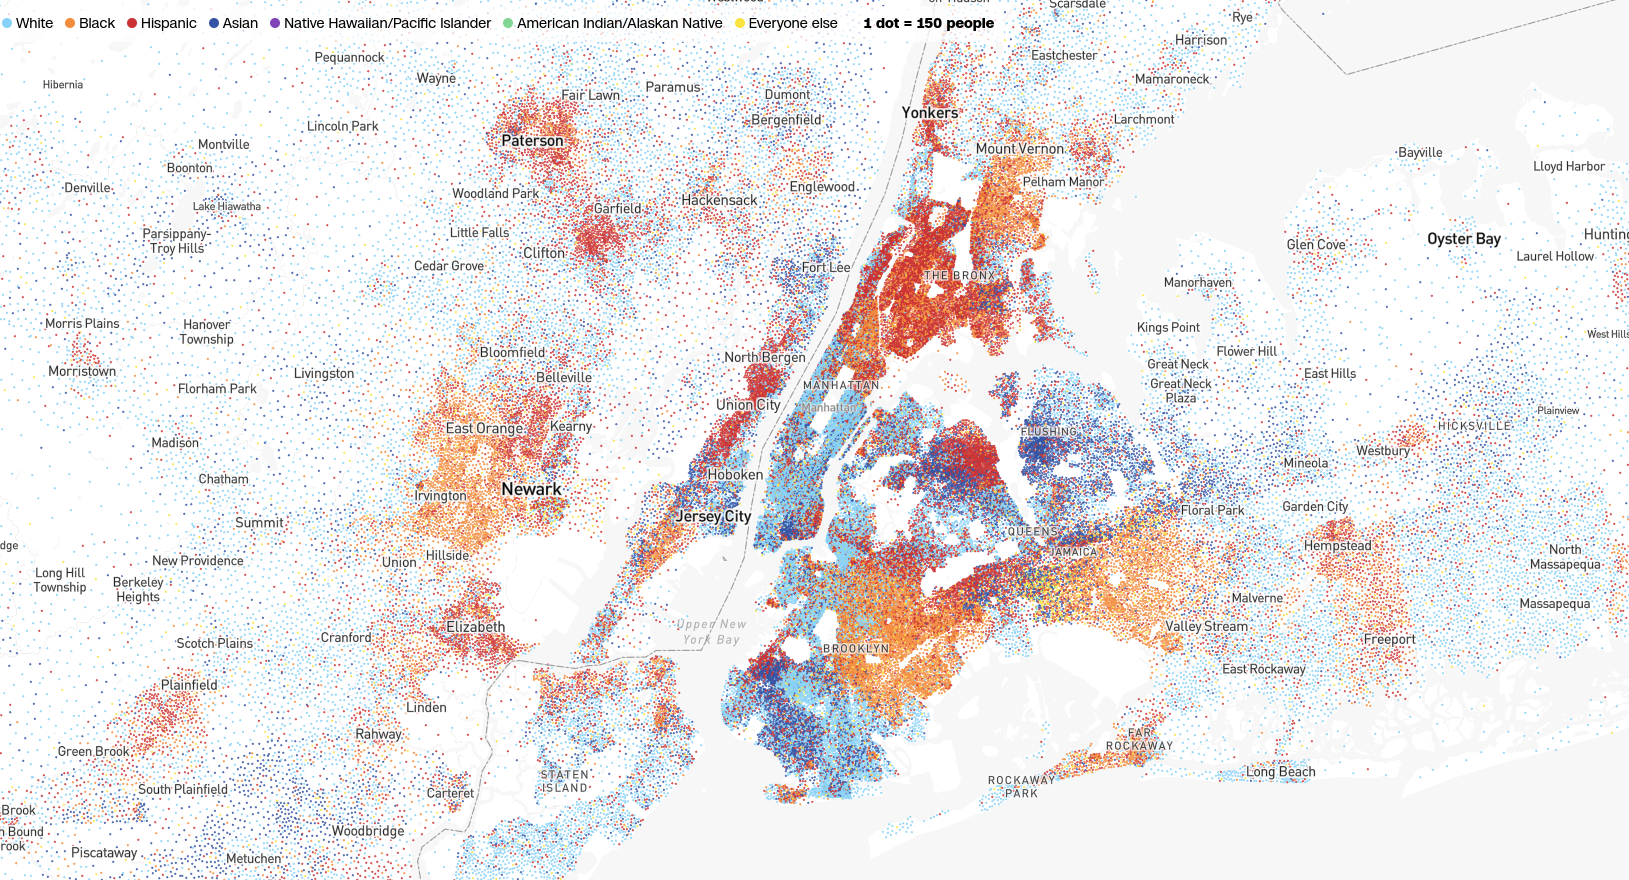
So really, you would want to adjust for this ‘proximity bias’. That may be tough though. Knowing something about social status, we know that Asians mostly live with Whites and other high tier immigrants (Indians etc.). The map mostly confirms this. The dark blue dots are close to the light blue dots (e.g. west Brooklyn), the Whites, and in some cases, the red dots, Hispanics (e.g. north Queens). The dark blue dots are rarely together with the orange dots, the Blacks. Yet, when we look at the crime rates, we see that Whites and Hispanics have the lowest rates of attacking Asians according to Asians. Blacks, despite not living close by, still manage to achieve an over-representation among the attackers. This is not unusual, this is the norm for all the interracial crimes, as discussed by The Color of Crime report published by American Renaissance:
Some observers argue that the overwhelming preponderance of black-on-white over white-on-black violence suggests that blacks deliberately target whites for violence. Others argue that since there are 4.7 times as many whites as blacks in the population, it is to be expected that black criminals are more likely to encounter white victims than vice versa.
Both positions must be evaluated in light of several considerations. First, blacks who commit assault, robbery, and rape are likely to be members of the underclass, who live in largely black neighborhoods. If they chose victims without regard to race they should be more likely to encounter other blacks rather than whites. Second, black/Hispanic interracial crime fits the same lopsided pattern: Of the 256,074 violent crimes involving those two groups, blacks were perpetrators 82.5 percent of the time. Unlike the nearly five-fold difference in numbers between blacks and whites, there are only about 30 percent more Hispanics than blacks. The high black-aggressor figure suggests that blacks may also deliberately target Hispanics — perhaps even more than they target whites.
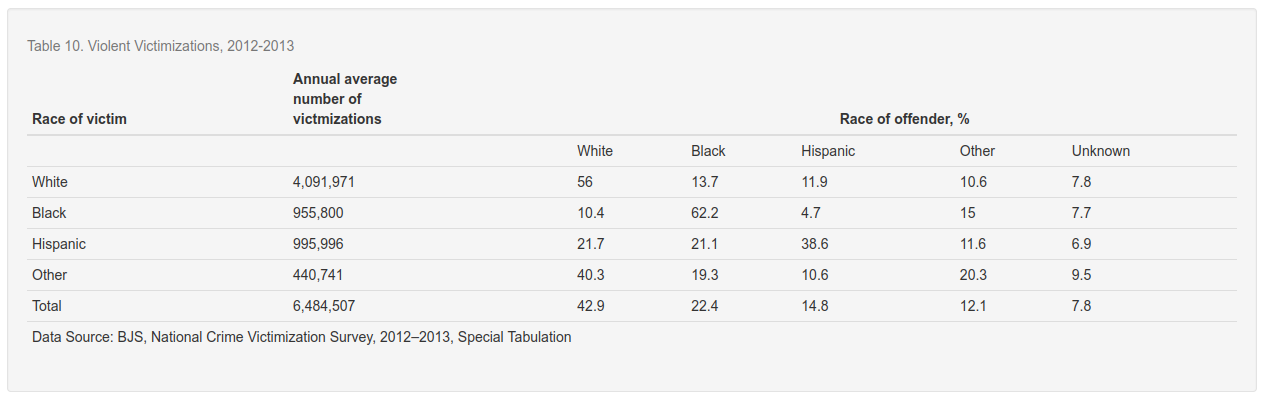
The imbalance can be expressed differently: When whites commit violence they target other whites 82.4 percent of the time, blacks 3.6 percent of the time, and Hispanics 7.8 percent of the time. In other words, white violence is directed overwhelmingly at other whites. When blacks commit violence only a minority — 40.9 percent — of their victims are black. Whites are 38.6 percent and Hispanics are 14.5 percent. Hispanic assailants also attack their own group less often than they attack others. Their victims are: Hispanics — 40.1 percent, whites — 50.7 percent, and blacks — 4.7 percent.
Finally, interracial crime can be expressed in terms of the greater or lesser likelihood of a person of one race to commit violence against a member of the other. In 2012/2013, the actual likelihood of attack was extremely low in all cases, but statistically, any given black person was 27 times more likely to attack a white and six times more likely to attack a Hispanic than vice versa. A Hispanic was eight times more likely to attack a white than the reverse.
There were no Asians in their study as they weren’t reported in 2013, but surely the numbers would work out similarly. In terms of attacking other races, Blacks are the main actors. If you want a lot more details on this kind of thing, check out Hunting Asians for Sport. This kind of behavior is not so surprising because Blacks also rate other races quite low in opinion surveys:
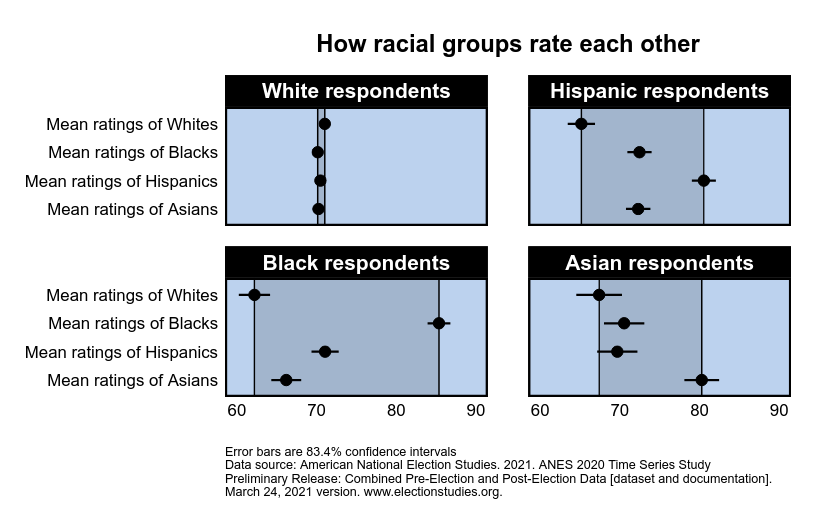
So you can compute the difference between own-group vs. out-groups. Based on this, we can see that Blacks are the most hateful, rating themselves 85, and Whites about 62, a whopping -23. They also disprefer Asians and Hispanics by large values, about 18 and 15. Asians too show this pattern, just favoring Asians instead of Blacks. But their gaps to the other races are only about 10-12 points. Whites, of course, are trying to be saintly, the only group not showing any own-group preference. 🤡 The most curious thing here is the amount of Asian dislike for Whites, despite these going actually getting along well in real life on jobs etc. I don’t know how to account for this.
Censoring crime statistics
The very inconvenient findings from actual crime statistics of course cannot be accepted by the socialists, so denial sets in. Since these are victimization data, it’s hard to blame the victims, and you can’t just blame the police, or the courts here either. What to do? Well, stop reporting them! This tactic is not new at all. It’s the norm. For instance, this paper from 1994:
- Gabor, T. (1994). The suppression of crime statistics on race and ethnicity: The price of political correctness. Canadian Journal of Criminology, 36(2), 153-163. PDF
Finally, opponents of the routine collection of crime statistics on race assert that it is unfair and impractical to collect information on the race of suspects. Race, they say, is an ascribed characteristic that cannot be changed and therefore has no relevance to social policy. While we can improve an individual’s vocational skills and economic opportunities if we find that crime is linked to economic conditions, there is little we can do if we learn that a person’s race is a risk factor in crime. In the worst-case scenario, therefore, collecting and publishing race-based crime data can:
(1) Lead to a crackdown on certain racial minorities by the criminal justice system and create conflict among racial or ethnic groups;
(2) Distort the true contribution to crime of different groups due to racial and ethnic biases in official crime data and the misclassification of suspects by criminal justice personnel; and,
(3) Waste justice system resources if race and ethnicity turn out to be largely insignificant correlates of crime, or because there appear to be no affirmative measures we can take if such factors are significantly related to crime.
At first glance, these arguments seem compelling. Upon closer scrutiny, however, they are alarmist and paternalistic. Benevolent political leaders, academics, and criminal justice personnel who oppose collecting statistics in sensitive areas feel they have the right to define the boundaries of the public’s knowledge of crime, even where public security is at stake. My concern in this paper is more with the principle of public access to information on security matters than with the need to publish race-based crime data in particular. At the end of this paper, I will briefly address the type of data that I feel should be collected. I will try to show that the justifications for suppressing such information are moral and political, rather than grounded in research. I also start with the premise that, in a free society, the burden rests with the censors to show that providing the public access to information has a high likelihood of producing significant social harms. I will now examine, in turn, the principal arguments of those opposing the collection and publication of race-based crime statistics.
All of these sorts of arguments assume that the elites know best what the right policy should be, and voters should be deliberately misinformed by hiding information, lest it convince them of the opinions the elite doesn’t want them to hold. I guess a fascist might agree with this principle, just disagree which information should be withheld, but if you are in favor the enlightenment idea, you cannot be in favor of such suppression.
On Twitter, I got my account locked for pointing out the point of hiding these numbers:

It’s the usual kangaroo court. There were no promotion of violence in my tweet. If anything, it’s about reducing violence by Africans, but this stuff is normal for Twitter.
In Sweden too, they had been hiding the crime statistics about immigrants for some years for the usual reasons. They recently published them, as I wrote about in another post. There weren’t any big surprises to those who had been paying any sort of attention.
France must be the king of suppression, as it doesn’t even collect statistics by ethnicity or origins in the census, and thus doesn’t have any such crime statistics to even hide. France goes so far as to hide the population data too, and then then suppress indirect methods to figure out what the population data are. The great blog Those who can see, has detailed this affair:
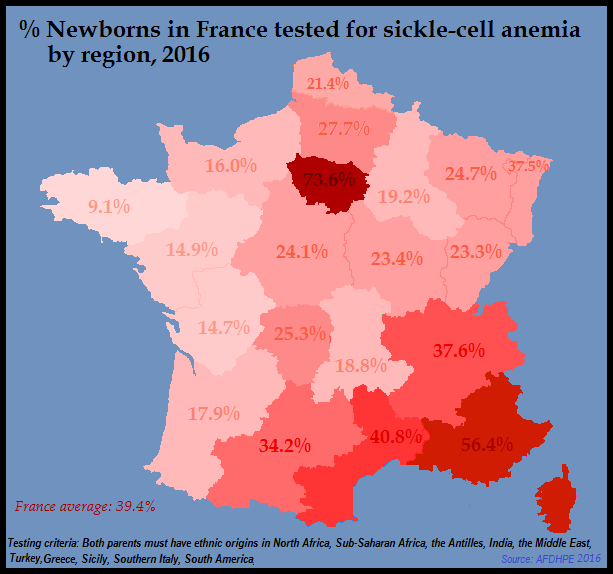
Why are we using the data from 2016? Once the national health agency caught on that anti-immigrationists were looking at these numbers, they conveniently stopped publishing them. At the same time, they’re now calling for systematic sickle-cell testing of all newborns in France. Such a program would be both costly and pointless, but no proposal is too far-fetched when it comes to covering up the demographic revolution in progress.
I think the only democratically proper thing to do is publish all statistics, always collect race/ethnicity, never censor anything. Let voters decide what they want to do with that information. Live not by lies.