Metaculus:
- Will Marine Le Pen win the 2022 French presidential election?
- Will Emmanuel Macron be re-elected as President of France in the 2022 Presidential Election?
So let’s try! Let’s time I did one of these was for Brexit, and eye-balling the results makes us think this might end up the same way. So let’s see what the stats say. We begin with the Wikipedia plots:
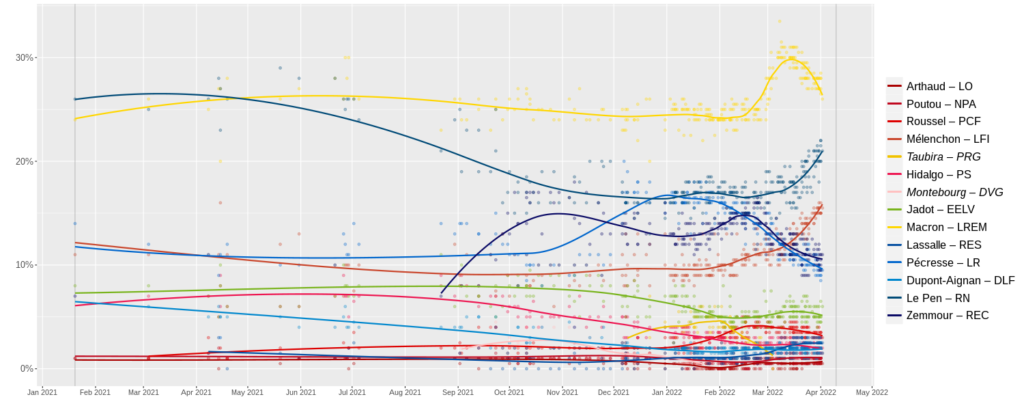
The French president election system is weird. It’s a 2 stage run. First stage finds the 2 most popular candidates. Second stage asks people to choose between just those two. It seems like an inferior system to the rank vote, but OK. Judging from this, it seems it will almost certainly be Macron vs. Le Pen. There’s polls for their 2-way battle too:

There’s a lot of activity towards the end in the campaign phase owing to the Russia-Ukraine war, multiple new candidates, especially Zemmour. Since Zemmour seems to have run out of steam, Le Pen is taking back what was hers. Maybe Zemmour is boosting her by being a further right candidate, thus normalizing her. Whatever the interpretation, we can apply simple models to make predictions. So let’s do that. First, we grab all the poll data from Wikipedia, which is more work than you expect since the formatting is a mess, and they split the data into groups with different column names and orders. Here’s my attempt, just going back to the start of 2021. I used this Firefox extension to easily get the tables, then manually deleted columns with candidates that don’t appear in the official race. These data surely contain some errors, I notice some rows have multiple values. I only only the top value. Missing data are left as is, since it seems to suggest subjects were not polled about that person, not that they received 0% support. Recreating the plots above, I get this:

Which looks about right. But notice the misfit for the line for Macron, which is not flexible enough, compared to his actual recent rise and fall. Here’s the Macron Le Pen runoff:
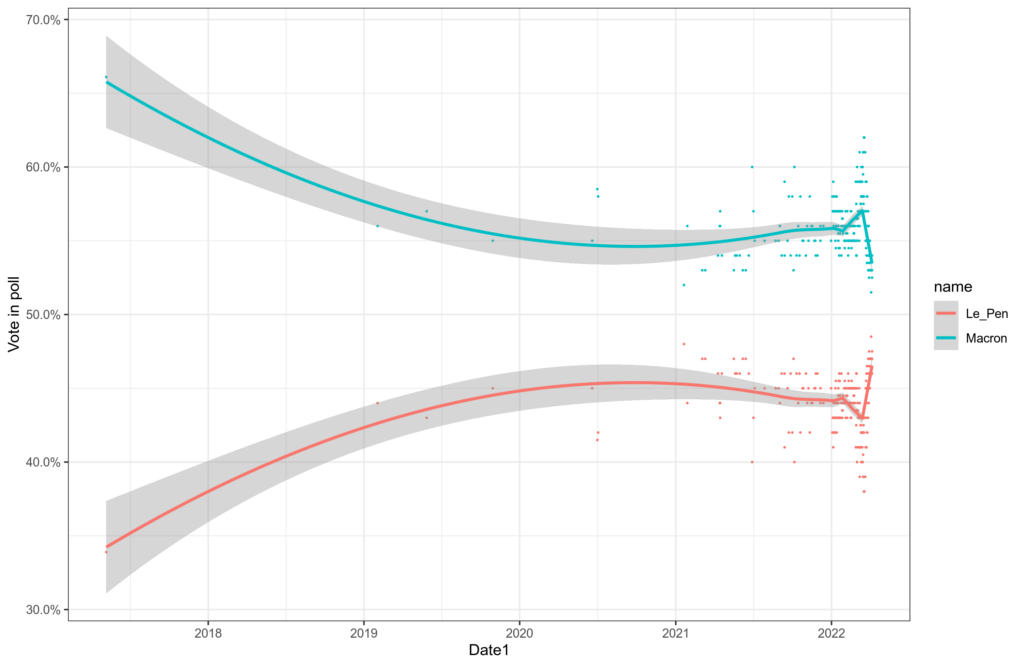
It has the same fit issue. The line fits end at the day of last day of data, so they are not truly forecasting anything, they are merely providing a data smooth. This is the LOESS model, a widely used smoother. One problem with using it as a forecasting model is that one must select a tuning parameter that controls how closely the datapoints are approximated. This can be chosen via cross-validation to get an optimized model. At least in theory. Meng Xu was kind enough to post a nice wrapping function for this on Rpubs (in 2016), so that’s what I am using. This is essentially the same approach I used to predict the Brexit vote, and that was pretty accurate.
Tuning the model this way for each candidate independently, I get a set of 12 models, one for each candidate in the main race. Then I forecast the values into towards election day, including the model’s estimated uncertainty (standard error). Doing that looks like this:
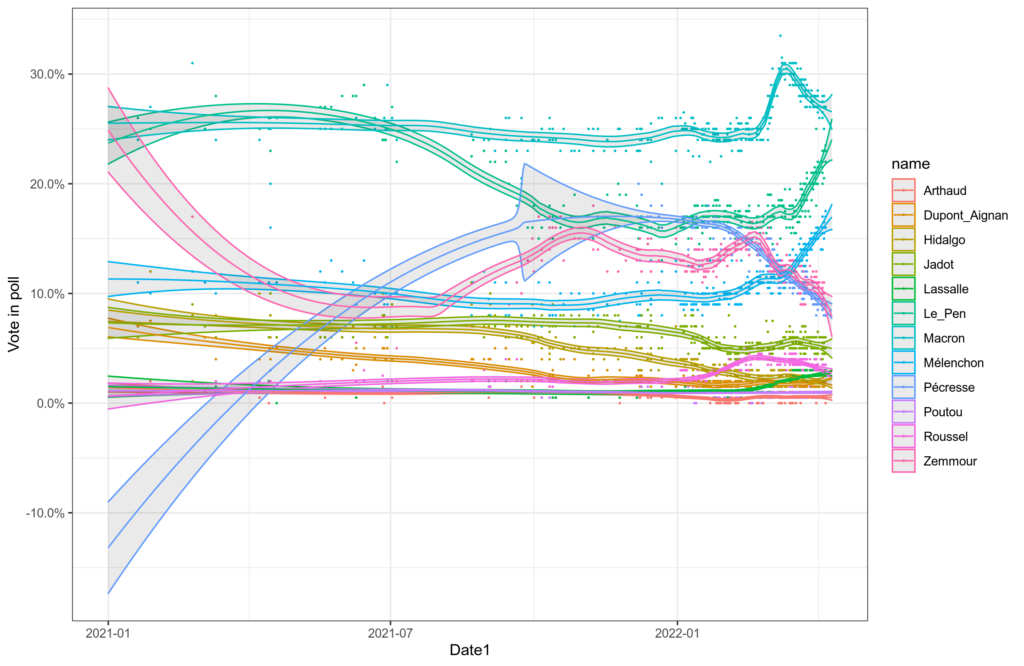
Each color (candidate) has 3 lines. The middle one is the best guess (the mean), and the other two are the 5% and 95% centiles. We see here that the 3rd candidate (Mélenchon) has essentially zero chance at getting into the runoff as he cannot reach the lower estimate of the 2nd candidate (Le Pen). The values on election day, 10th April, are these:
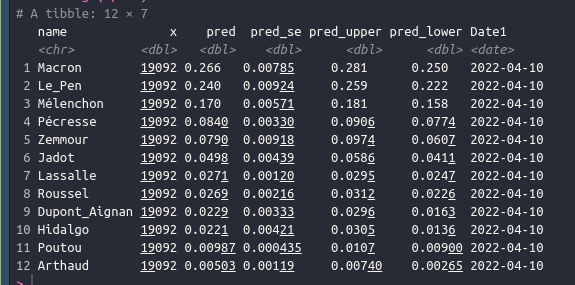
“pred” is the best guess, “pred_lower” and “pred_upper” are the 5% and 95% ends. (x is the numerical representation of the date if you are wondering.) We see that the upper 95% of Mélenchon (18.1%) does not reach the lower 5% of Le Pen (22.2%), so the model thinks there’s essentially zero chance of this happening. I guess we aren’t that certain since someone might screw up in the last debates, get assassinated, die in an accident, and then there’s of course the likely polling bias. I would guess polling bias is in favor of Macron and against the nationalist candidates. I give it about 95% chance the runoff will be Macron Le Pen.
The predictions for the run-off work the same way as before, but now we use the dataset that only asks about these two candidates. We do the same model fitting, and we get this result:
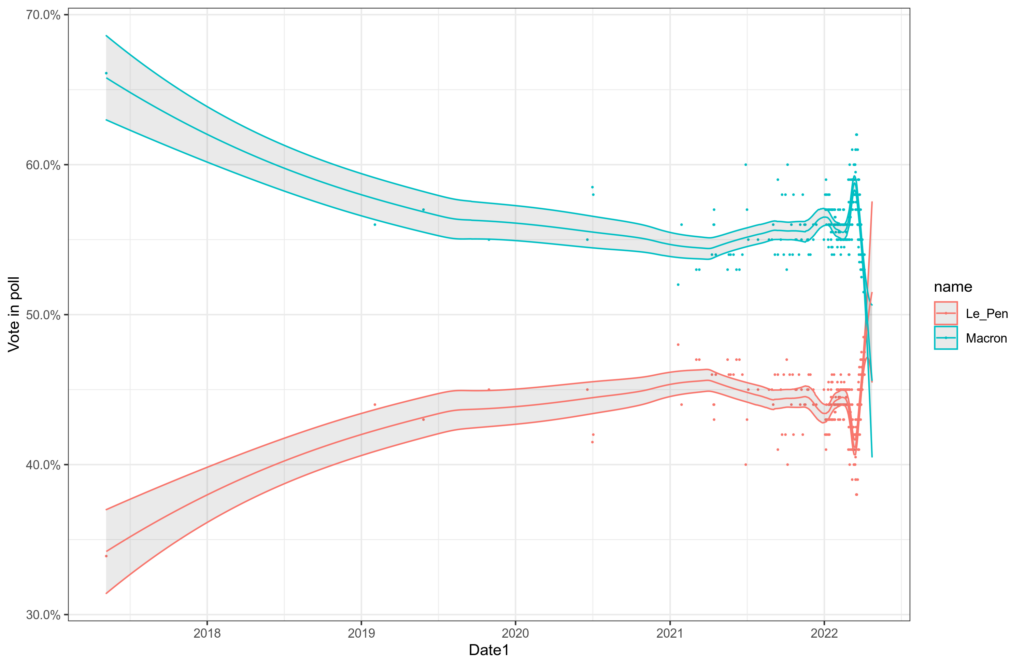
So uh… the model says that Le Pen will win! Let’s look at the numerical details:

So the model thinks Le Pen will get 51.5% of the vote, but the uncertainty interval is wide, from 45.5% to 57.5%. For Macron, the model is a bit more certain (“pred_se” is smaller) and forecasts 45.6%, with uncertainty from 40.5% to 50.6%. The attention reader will also notice a problem with this approach. The predictions do not sum to 100%! They sum to 97.1% fr the best guess values. This is because we ran 2 models that don’t know the data must sum to 100%, they just happen to not do so. We need something like Dirichlet regression, which is a class of models for compositional data (data that sum to 1, and bound by [0,1]). But we also need it to smoothen the data nonlinearly, like LOESS. I couldn’t find a Dirichlet LOESS model for R unfortunately (closest I found).
The confidence intervals overlap, so the model isn’t quite sure who is going to win. Another way to visualize this is to plot the posterior distributions. (chad treat frequentist confidence intervals as Bayesian credibility intervals) They look like this:
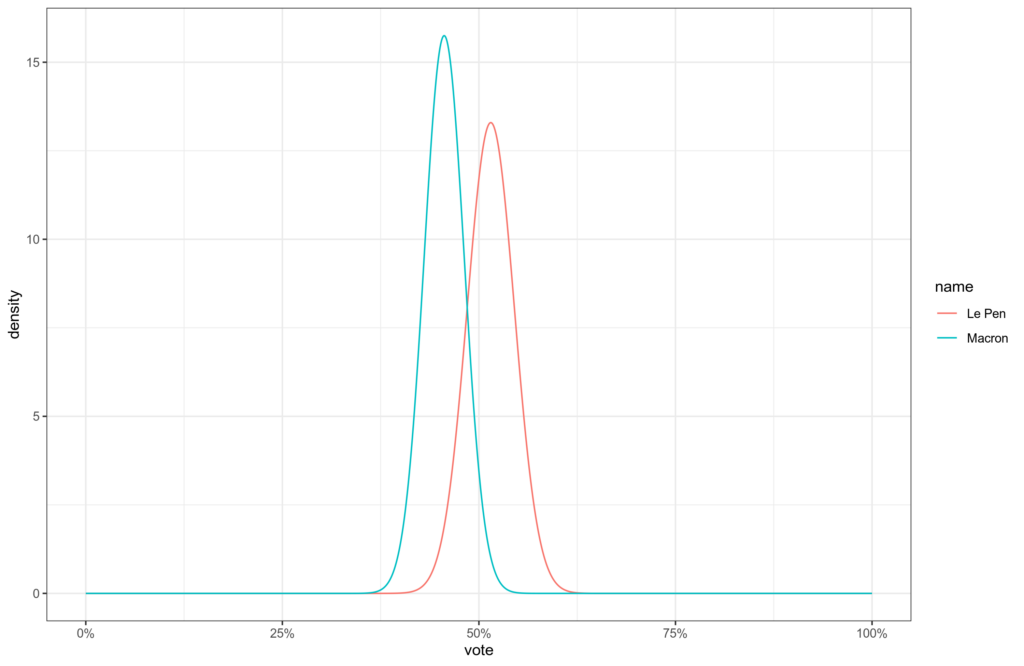
Here we see the big difference in the confidence of the model for the 2 candidates. If we sampled data at random from the two distributions, we would get the probability of a victory for both candidates. I did that 10,000 times, and the values are these:
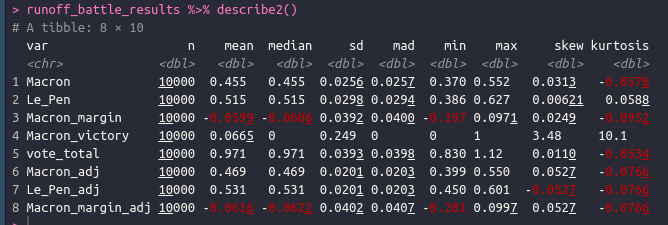
The average sampled Macron victory margin is about -6%, which also translates into winning about 7% of the time! I also computed a poor-man’s estimate of the vote share, adjusting for our model misspecification (not summing to 100%). This results in a predicted Le Pen % of 53.7% for the best guess. These we can plot again to get a final set of posteriors:
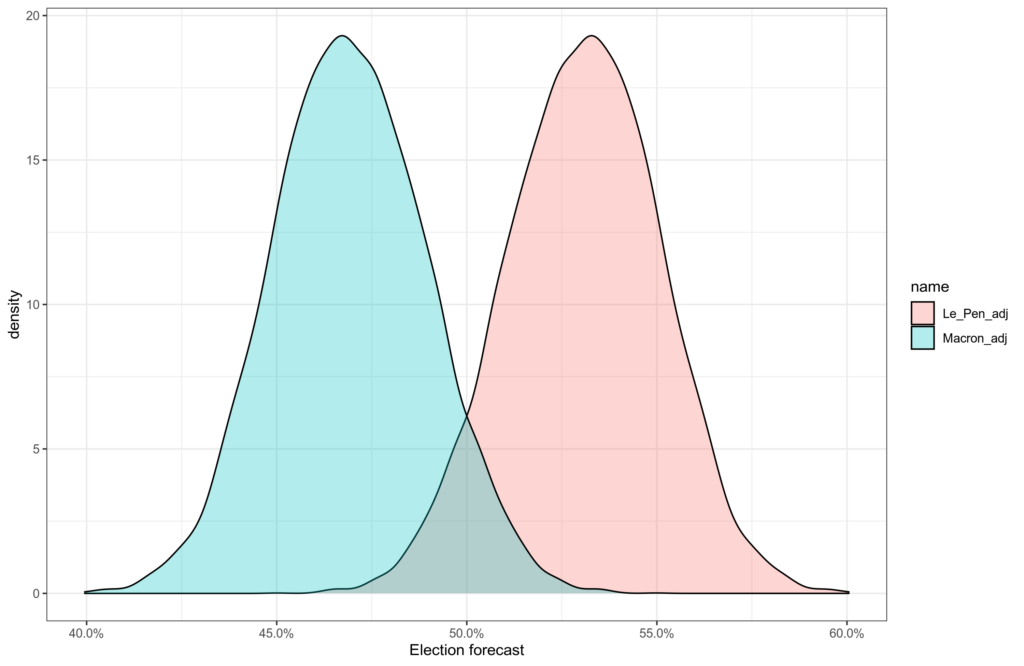
How serious should we take these results?
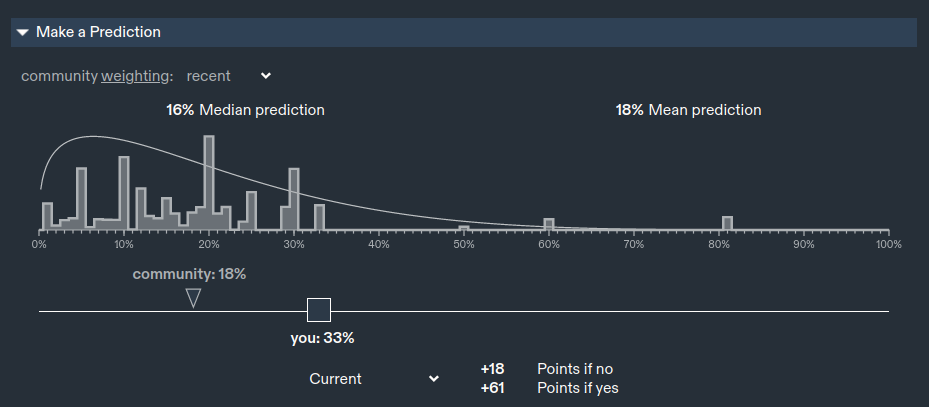
Alright, let’s take a step back. All the above is the inside-view and it looks strong. We used all the available data on Wikipedia, fit semi-proper models, made sure our tuning parameters were good, and examined the results thoroughly. But the conclusion is at odds with what everybody else is saying. Metaculus gives Le Pen 18% chance:
The Election Betting Odds aggregator gives Le Pen the same:

So I am pretty cautious about being too far from the consensus here. My Metaculus as seen above is about 33%, already about twice the median. Still, this feels a bit like a repeat of Brexit polling. Everybody had access to the same data, but somehow they are very confident what the data shows is likely will not happen. What extra knowledge do the others have? There doesn’t seem to be much of any they could have. For this reason, I am going to go halfway between the prior from the betting odds/Metaculus of 18%, and my model forecast of 93%, and give Le Pen 55.5% chance.
You can look at the nerd details on Rpubs, download all the files at OSF, and view the basic data on Google Drive.