I regret to inform you that they are at it again. That is, blocking me on Twitter for the wrong ideas. It started benignly, as it usually does, with a tweet by a popular account run by Robert Wiblin (archived). His Twitter bio lets us know that he is:
Host of The @80000Hours Podcast: 80000hours.org/podcast/ Make the most of your life: help others in high-impact ways!
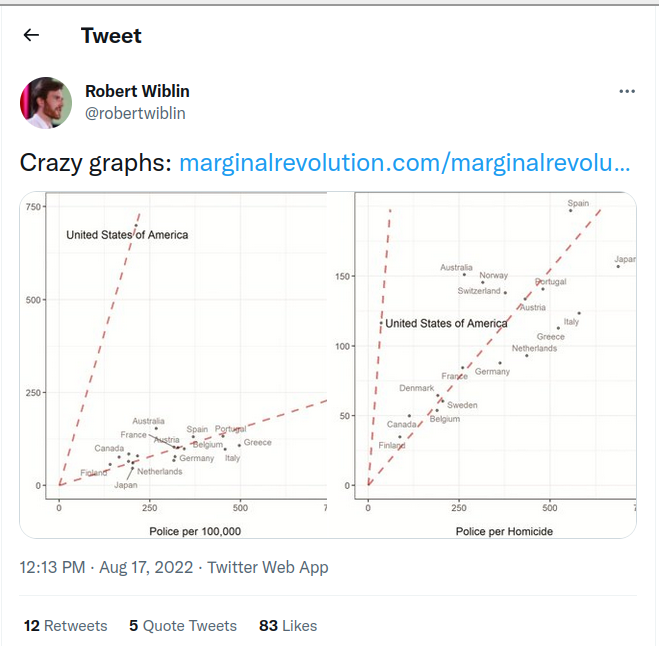
At 29.3k, he was one of my largest mutual followers. I’ve been following and promoting the 80000 hours project for some years. On top of that, the figure was posted from Marginal Revolution, another open-minded blog that has linked to my work a few times. The figures he posted illustrated how large an outlier America was in terms of prison population per 100k, whether compared to police per 100k:
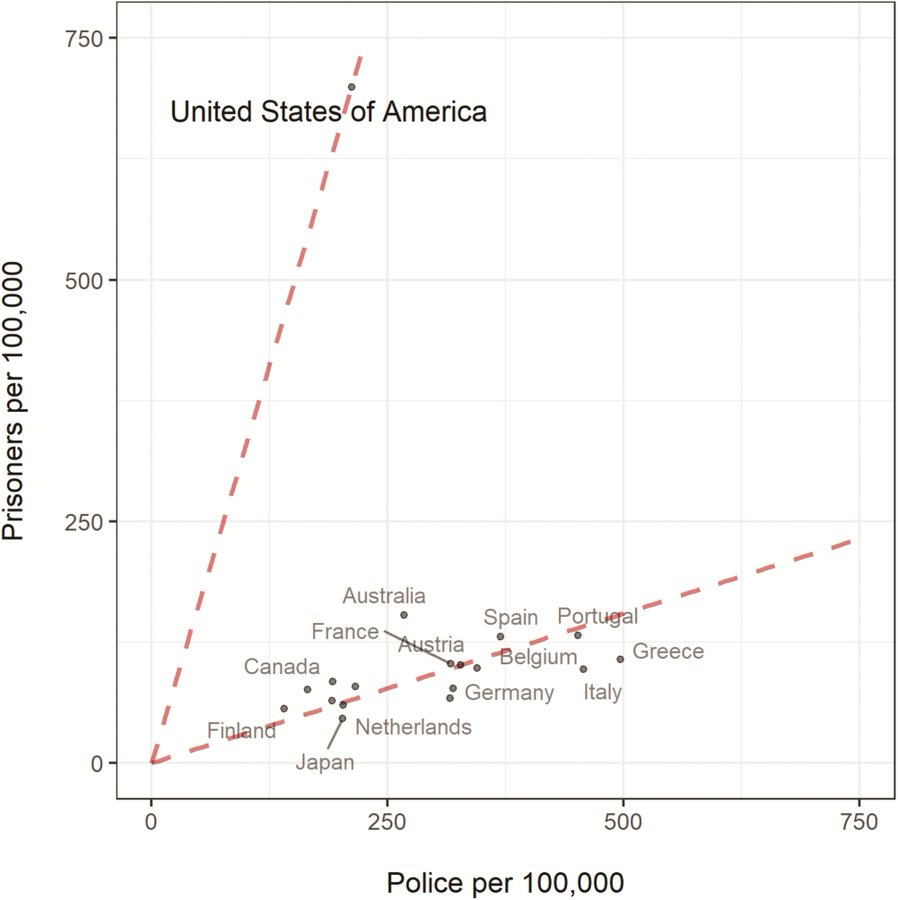
Or to Police per homicide:
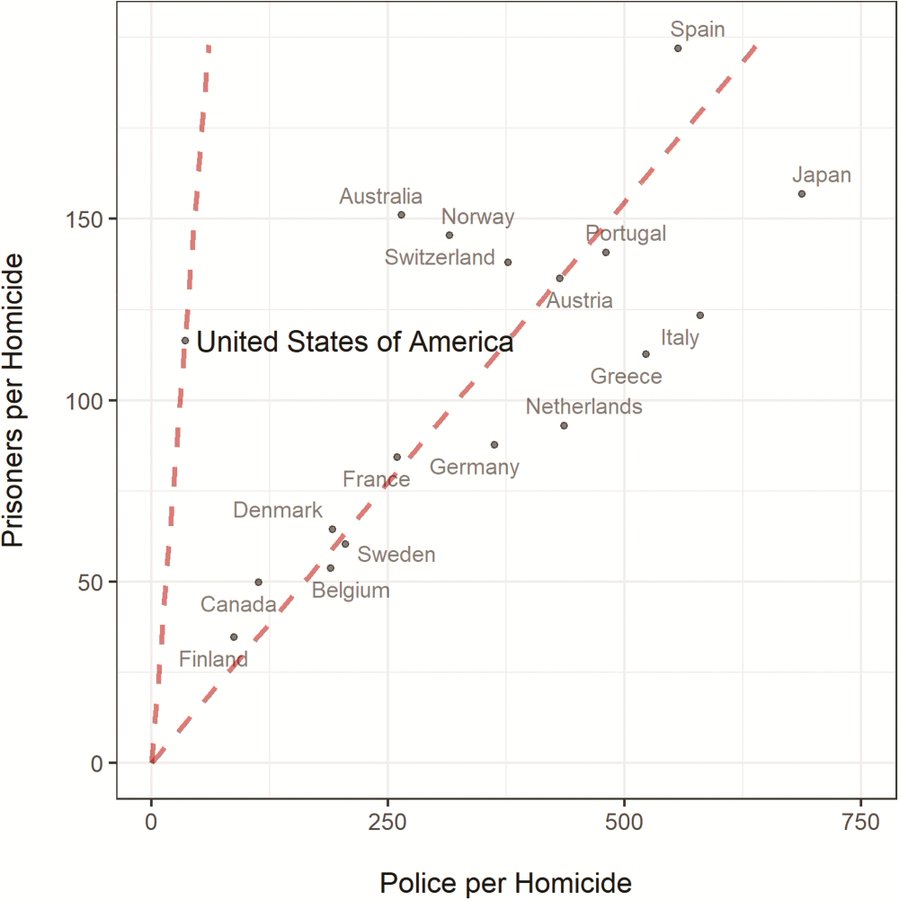
As such, I thought a pointy science wouldn’t be a big deal:
A familiar screen soon greeted me:

Sigh
Well, now that we are at this, let’s try the science idea then. Worldwide prison rates are somewhat of a puzzle. I blogged about this back in 2015. But now that my analysis skills are far superior, I should take a new look. First step was to acquire some prisoners per capita data, which was easy, as these were available at Wikipedia for most world nations and some semi-independent units (various overseas dependencies). The source is The World Prison Brief. Their motivation seems to be the usual globalist leftist human rights approach (read Hanania if you don’t understand why this is bad). Whatever the case, their data appear to be accurate. Here’s how the world looks like by prison rates:
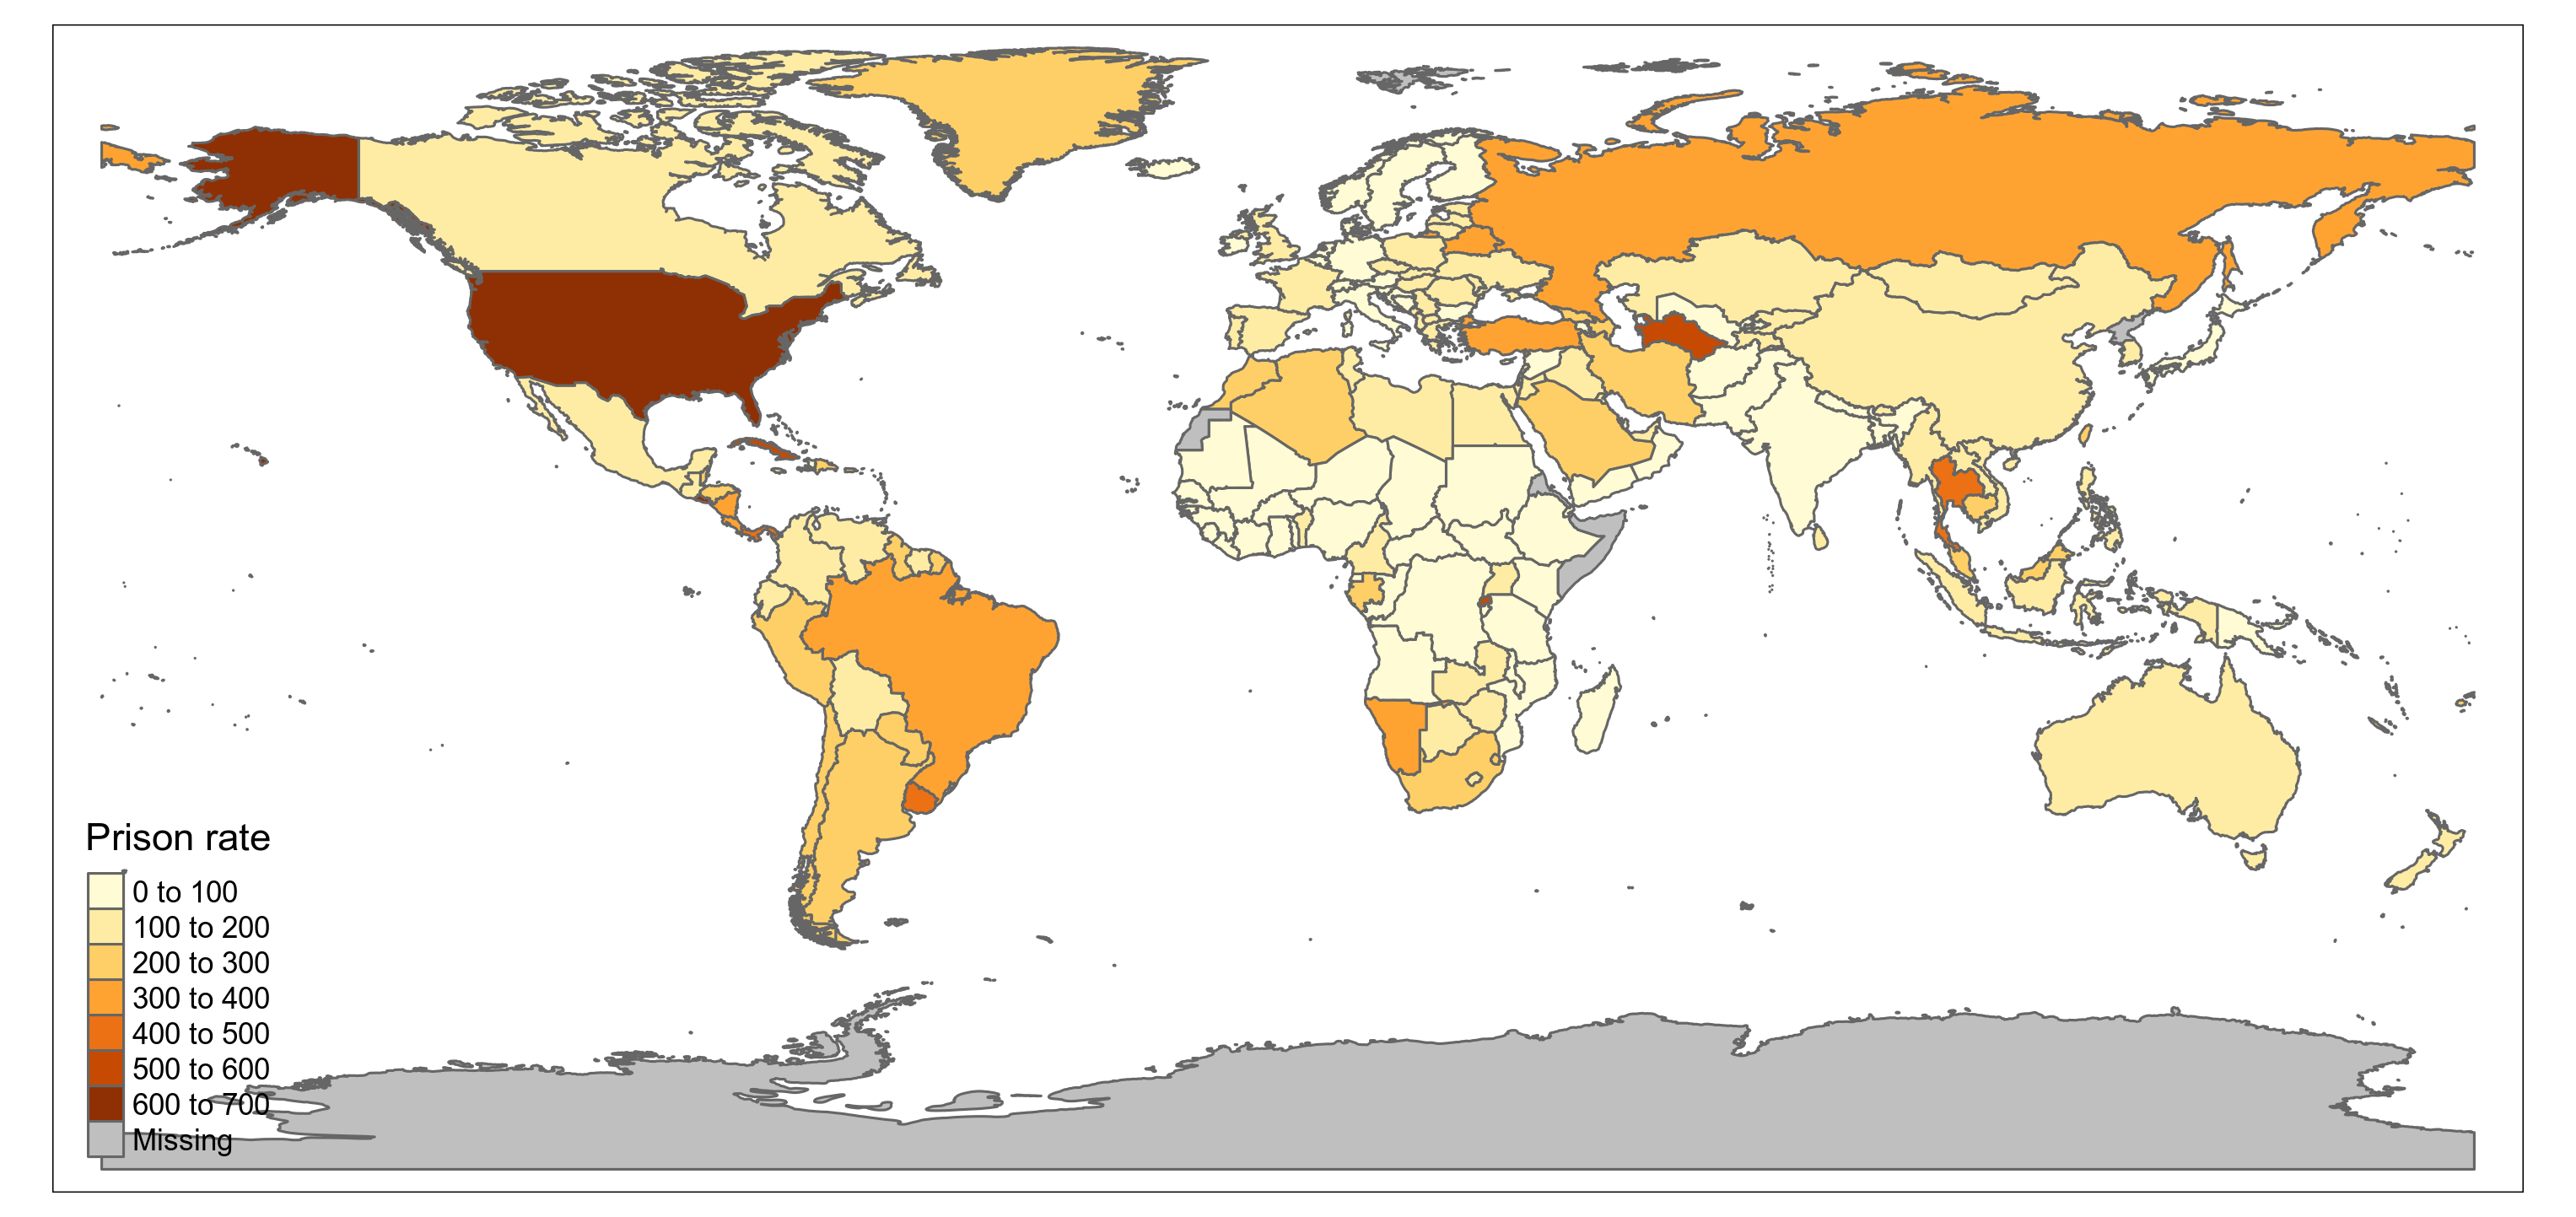
There’s a few areas without data, most conspicuously Somalia and Eritrea. These are high crime areas but not necessarily with large prison populations. In fact, looking at Africa, we don’t see so high prison rates in general. This is despite the known high homicide rates there. In fact, homicide rates do not seem to relate to prison rates much. They look like this, data from Our world in data:
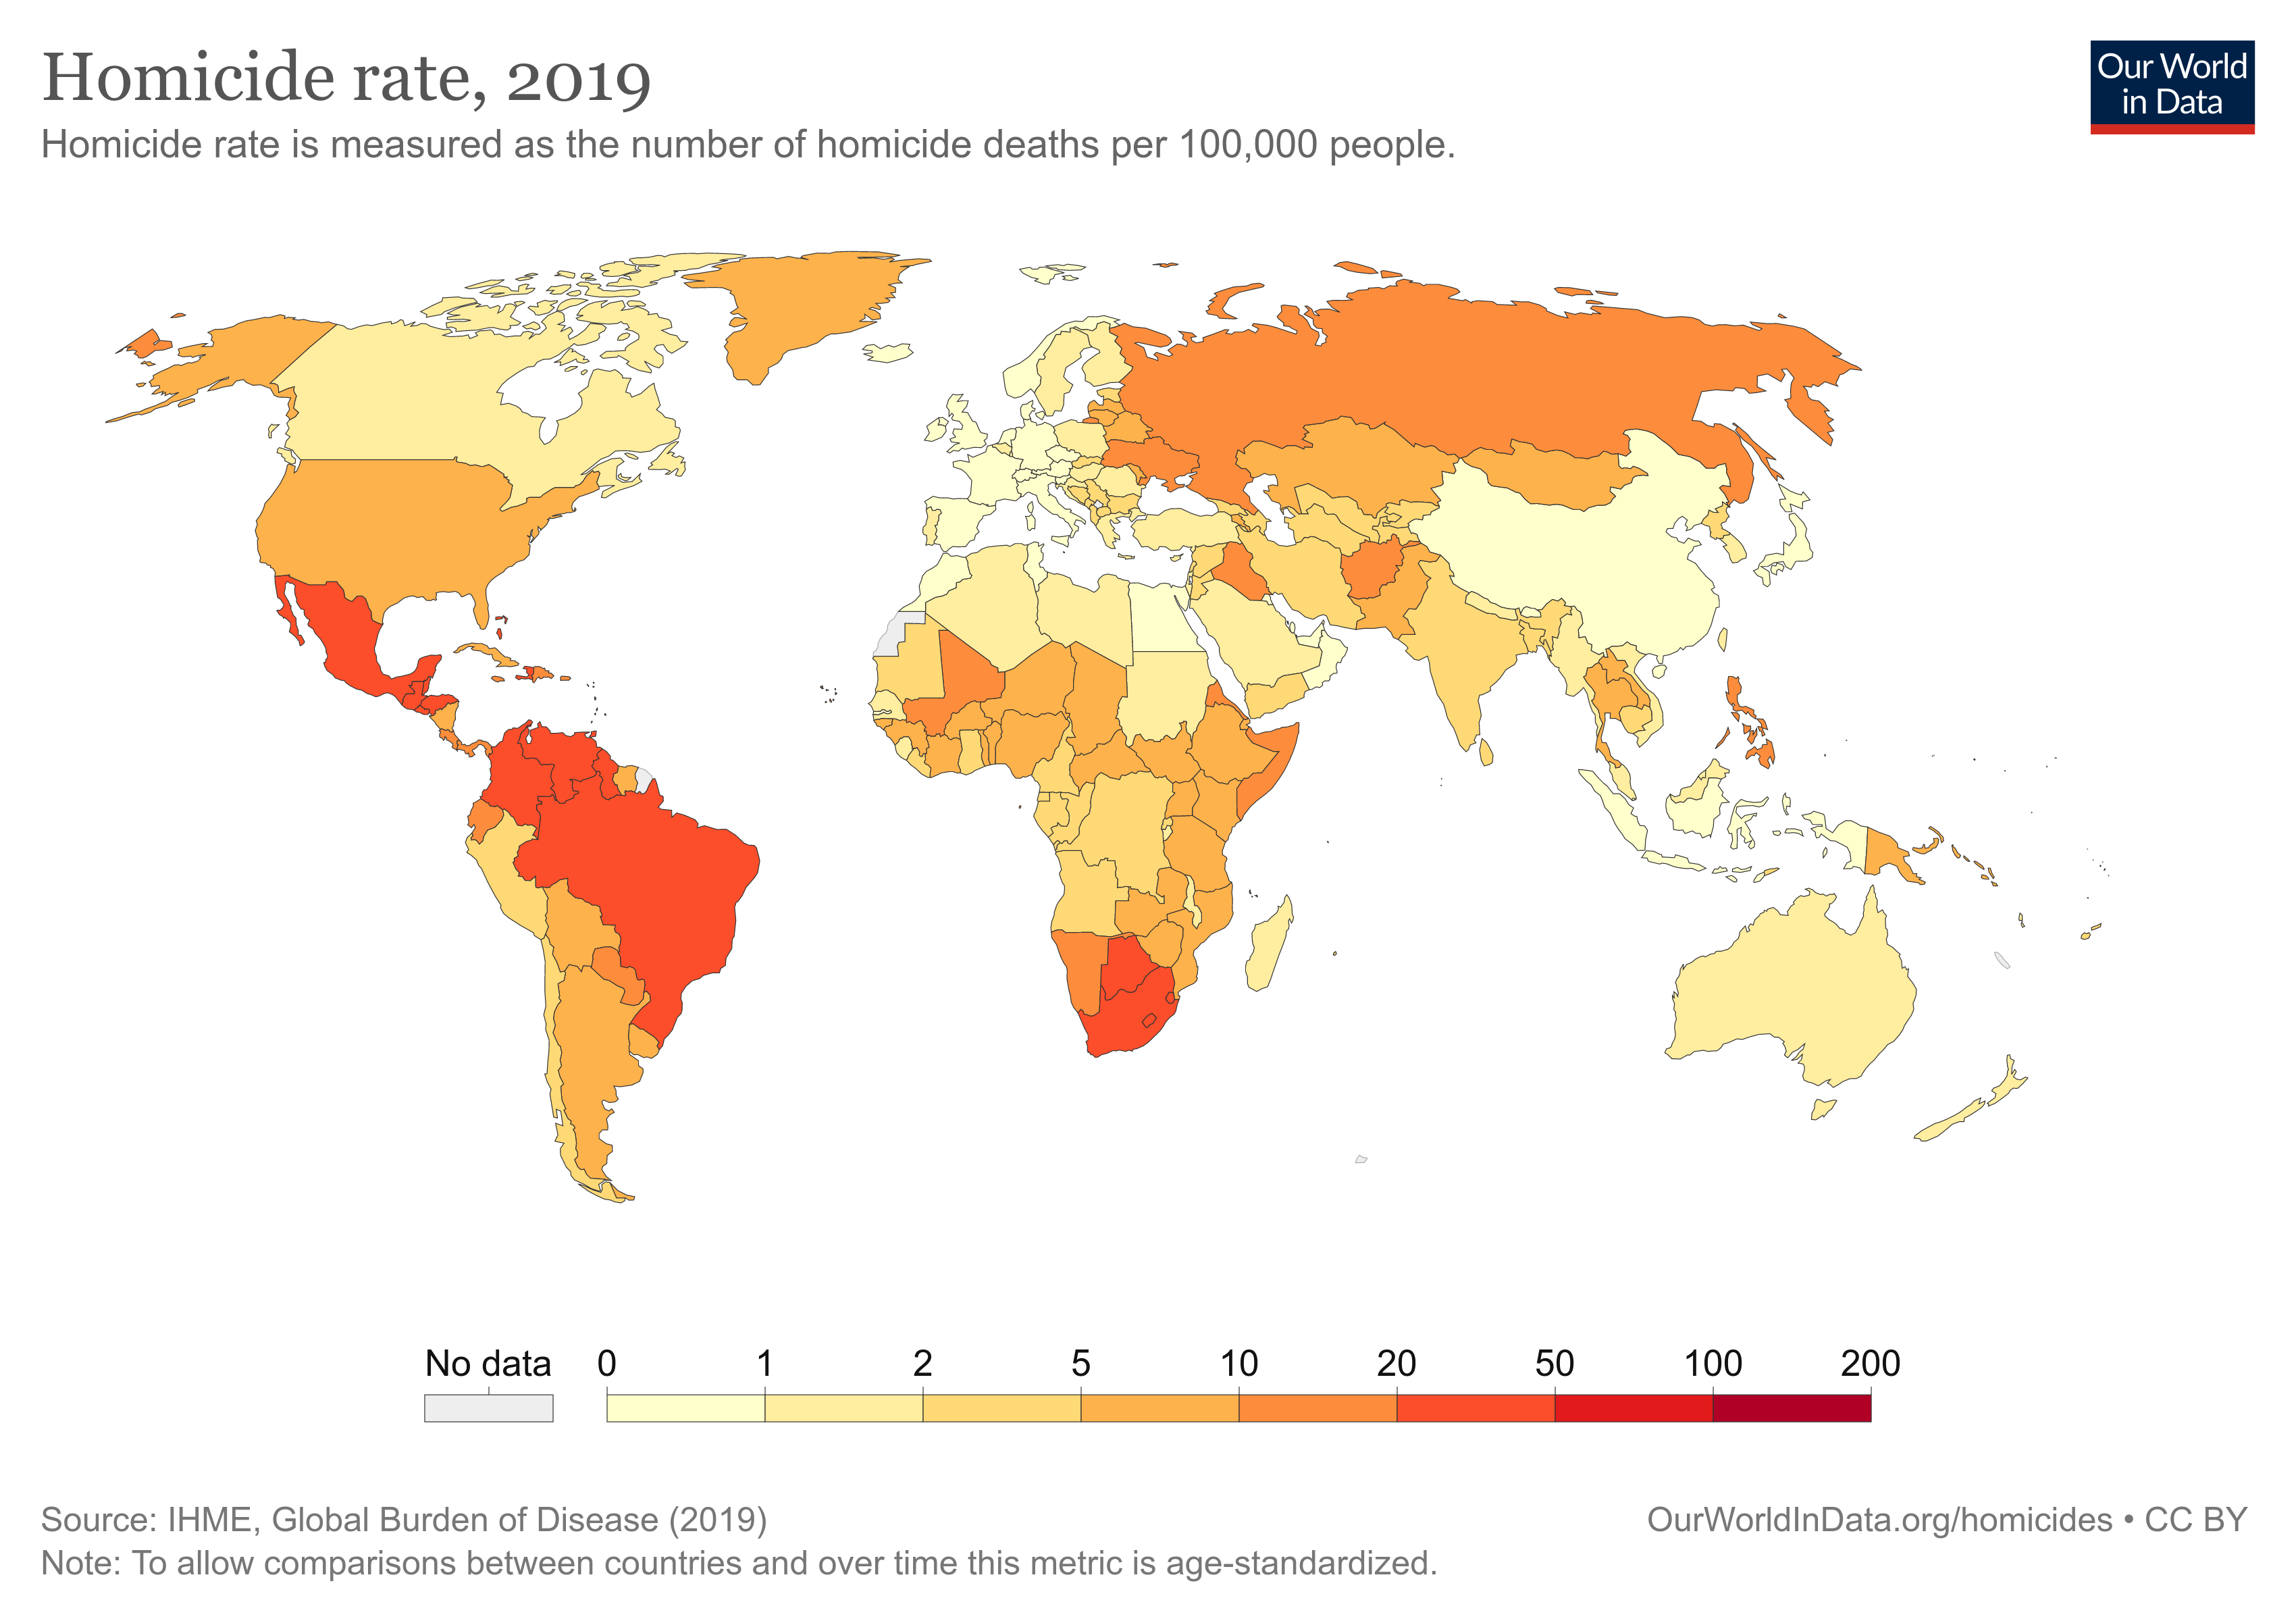
In fact, they correlate rather unimpressively:
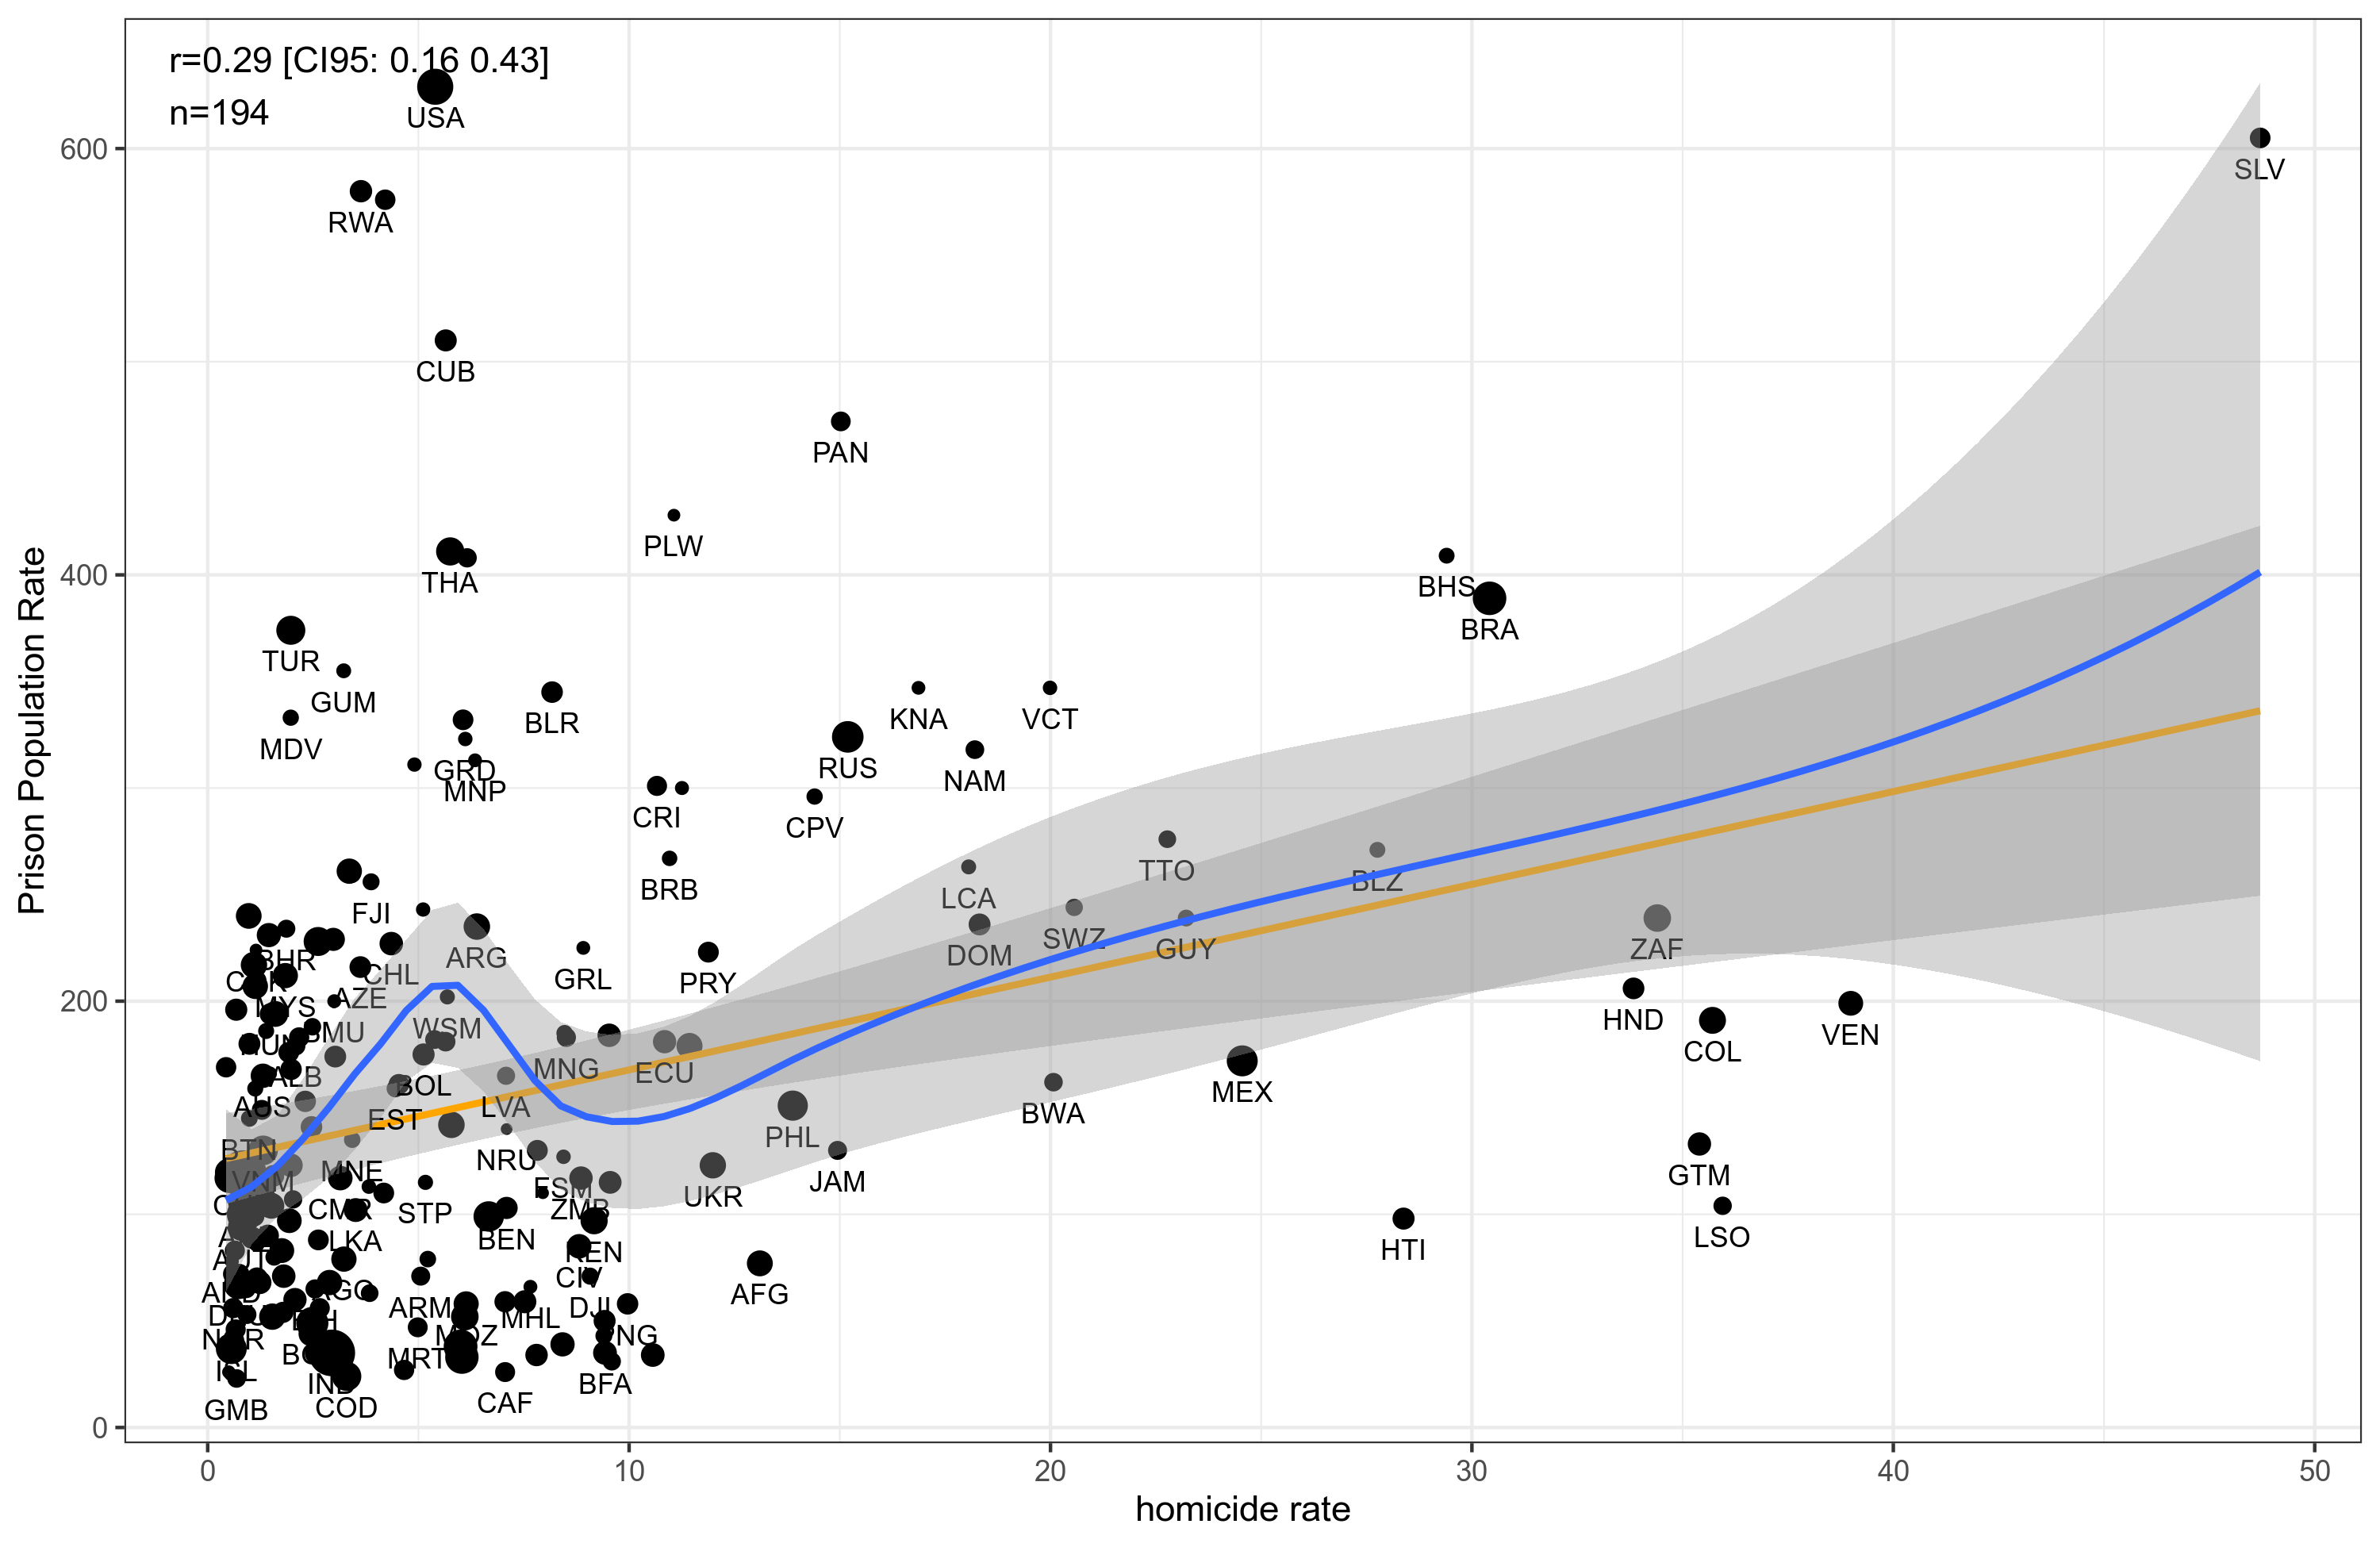
(If you don’t know the abbreviations, look here.)
The blue line shows the smoothing fit, which shows the non-monotonic relationship. There’s a hump in the middle.
To return to the tweet then, we need to obtain Africa% by country. This turned out to be difficult. I began with Putterman’s world migration dataset, which is a matrix that tries to trace the proportion of population in most countries to their origin countries, defined as those movement that happened after Columbus (1492). But it has many missing countries and other units, mainly small overseas islands, many of which are of interest because they are largely African populated Caribbean islands. I filled in these missing units by estimates based on Wikipedia, or the CIA Factbook, or guessing in a few cases (e.g., all Polynesian islands have 0% Africans). All in all, there are now data for most of the units. African% and prison population looks like this:
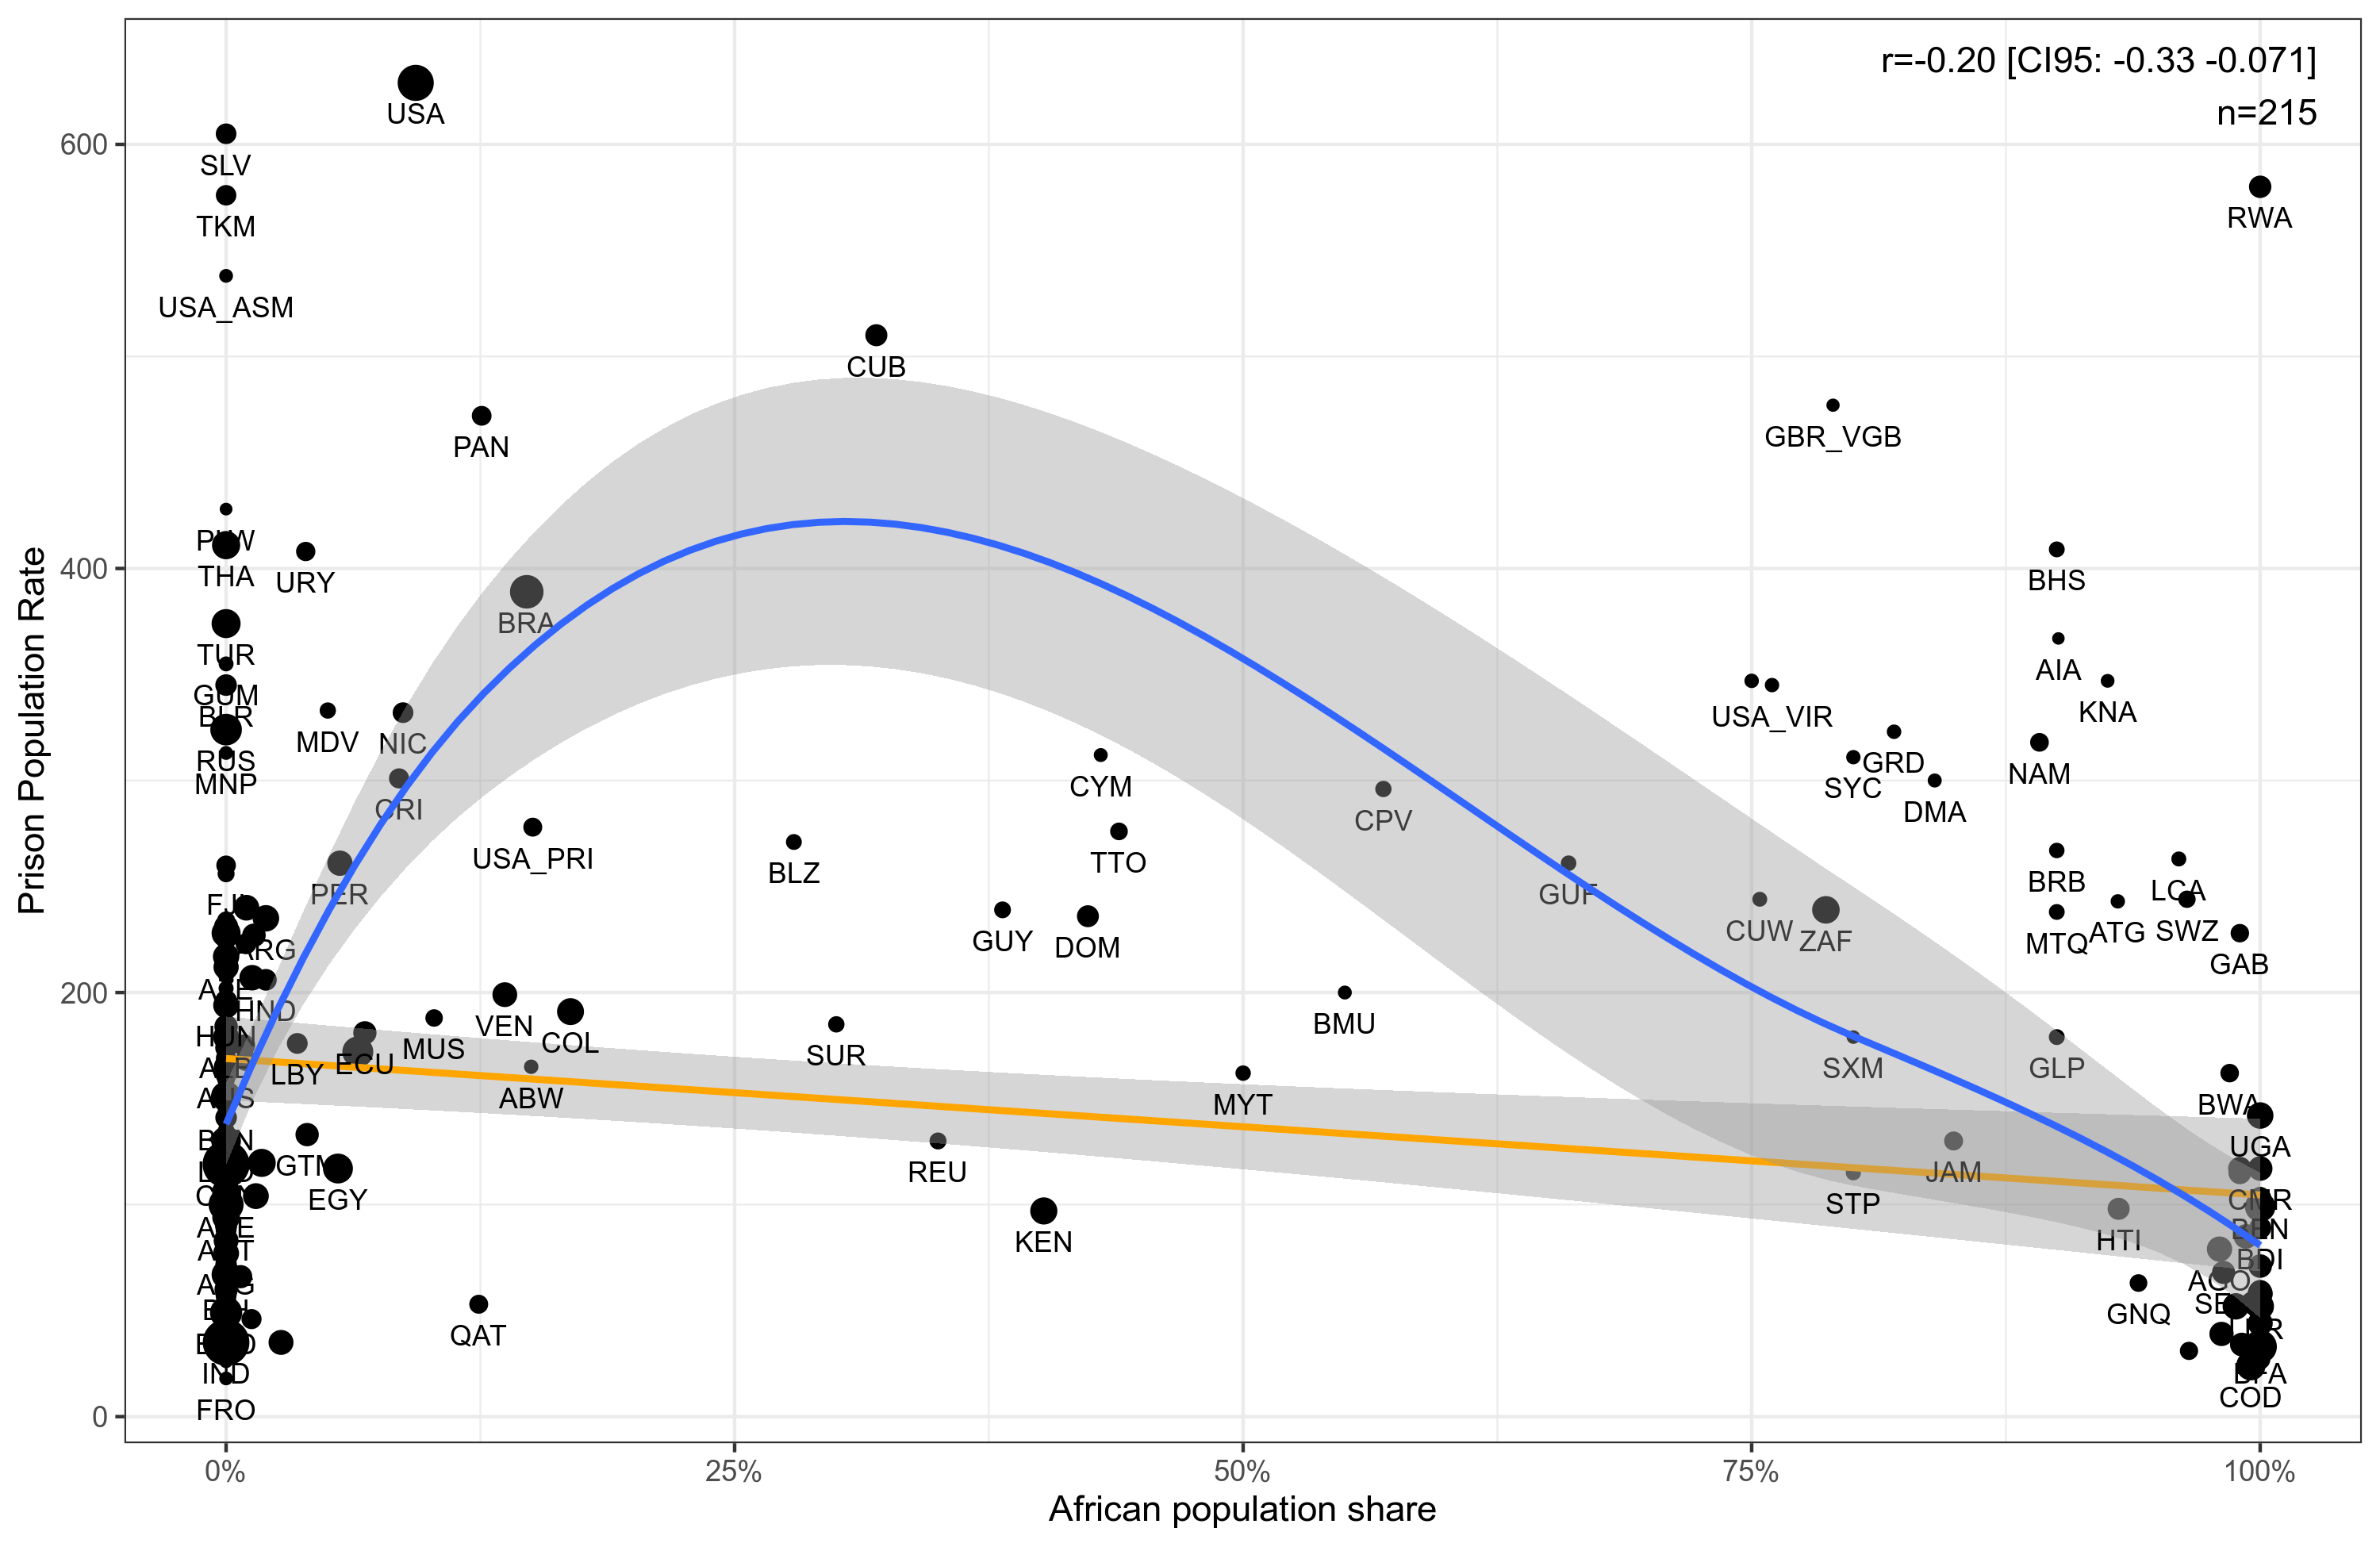
If we were to make a simple guess based on this, we might say that most (not all!) countries with few Africans don’t have enough crime to end up with a lot of prisoners, but countries with too many Africans are unable or unwilling to run a criminal justice system that involves prison. This latter could be due to totally lacking enforcement, or heavy use of the death penalty (leaving no prisoners). Here’s how it looks like with national intelligence:
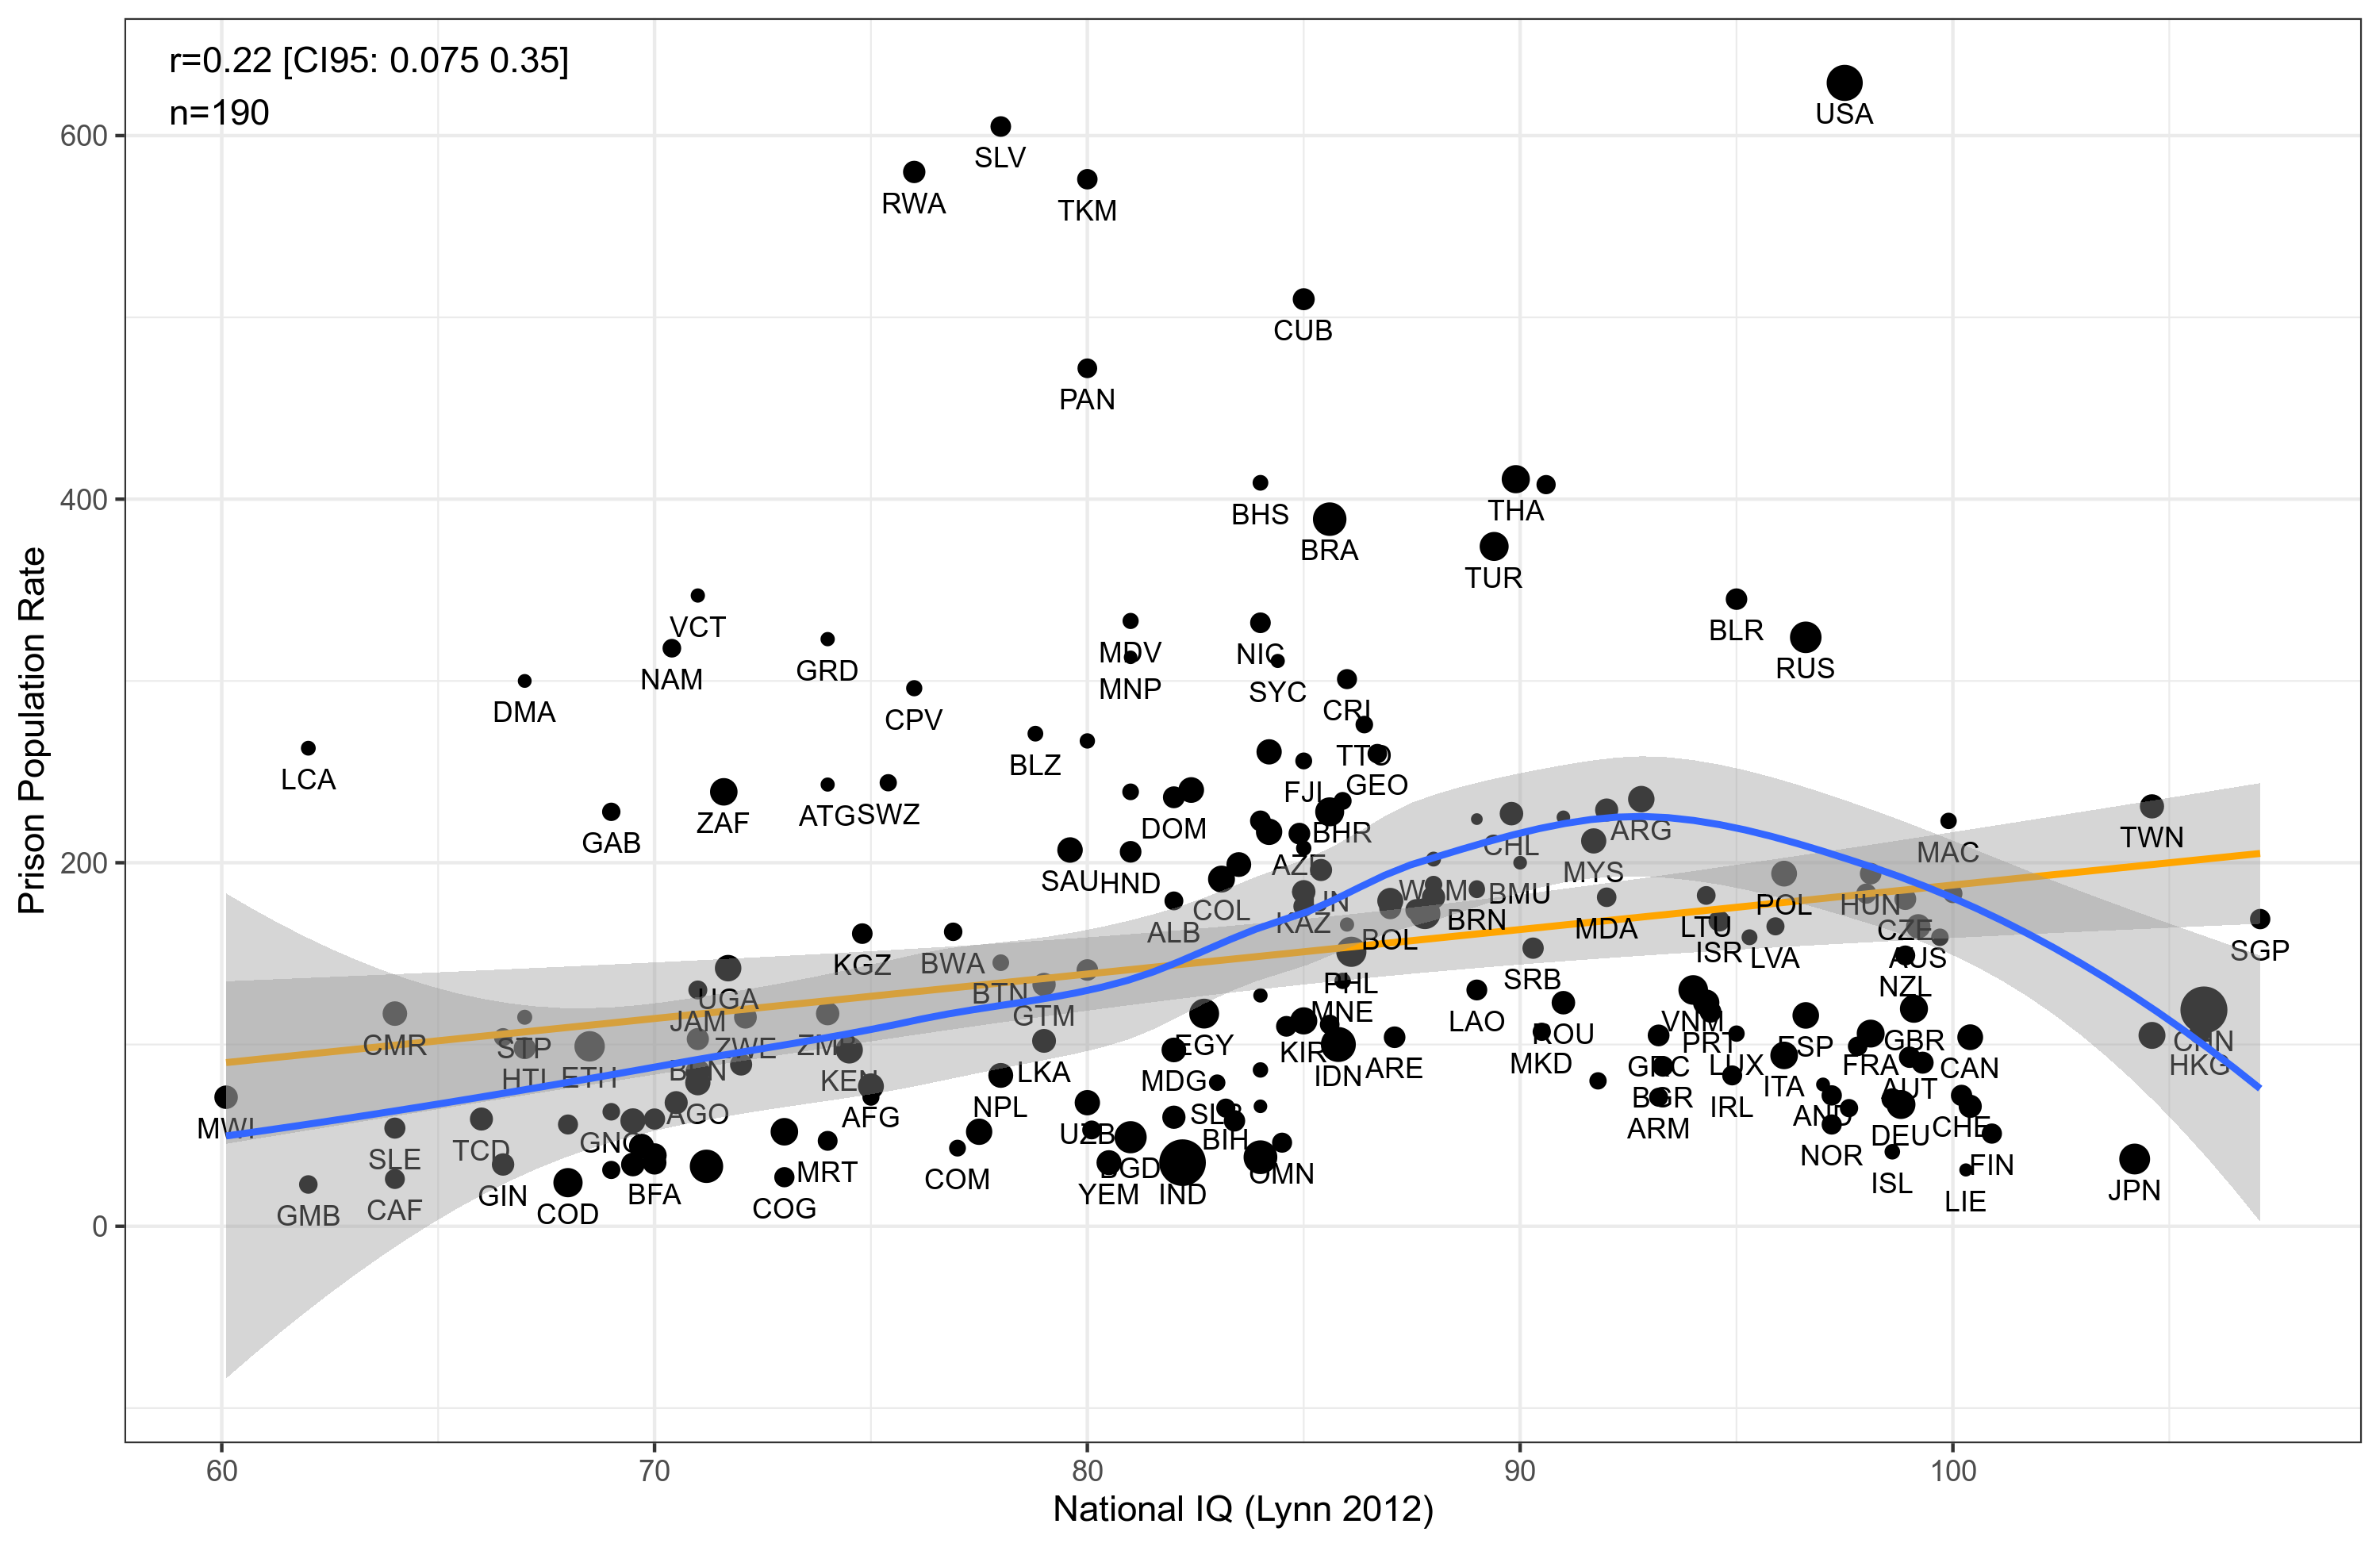
This one is perhaps even more mysterious. We know that crime is negatively related to intelligence at the individual level, as well as between most subnational units provided we take into account population density (crime happens more in cities which are also higher intelligence). Yet the country level association is plainly positive though not impressively so. We also see a lump as before, though much weaker than the African one. What’s happening?
It seems no matter what plot we look at, USA is a conspicuous outlier in terms of the prison population. We also know that the main reason for this is that their prison system is substantially populated by African Americans who ‘happen to’ live in a punitive state. This was really the basis of my idea in the tweet. The way to get a high prison rate is to have high crime Africans combined with an effective justice system. If we run the model I proposed, along with a few others, find:
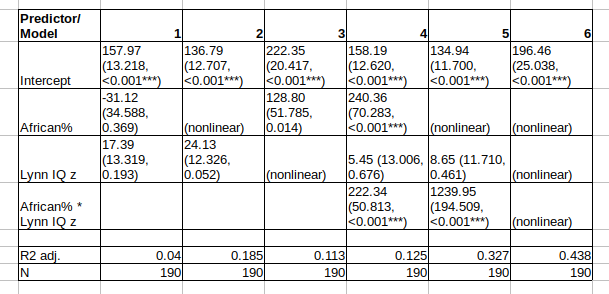
(Standardized coefficients for IQ.)
The results are not exactly satisfying. Model 1 just has the two linear effects, and they don’t explain much (4%). As we saw in the plots, there’s non-monotonicity. Adding non-linear (natural spline) effects of African% helps more than adding for IQ, but both add something. Compare R2’s for model 1 vs. 2 or 3. A linear model with interactions yielded a surprisingly small p value (< .001), but the R2 was not impressive (12.5%). Trying out non-linear interactions makes the model coefficients uninterpretable, but greatly adds to the variance explained. As before, the African% nonlinear effect was the most important, as the plot suggested. In terms of the model fit, this final model beat the others in formal tests by a lot (all p’s < .000001 in likelihood ratio tests). To understand it, we have to look at the predictions it makes. They look like this:
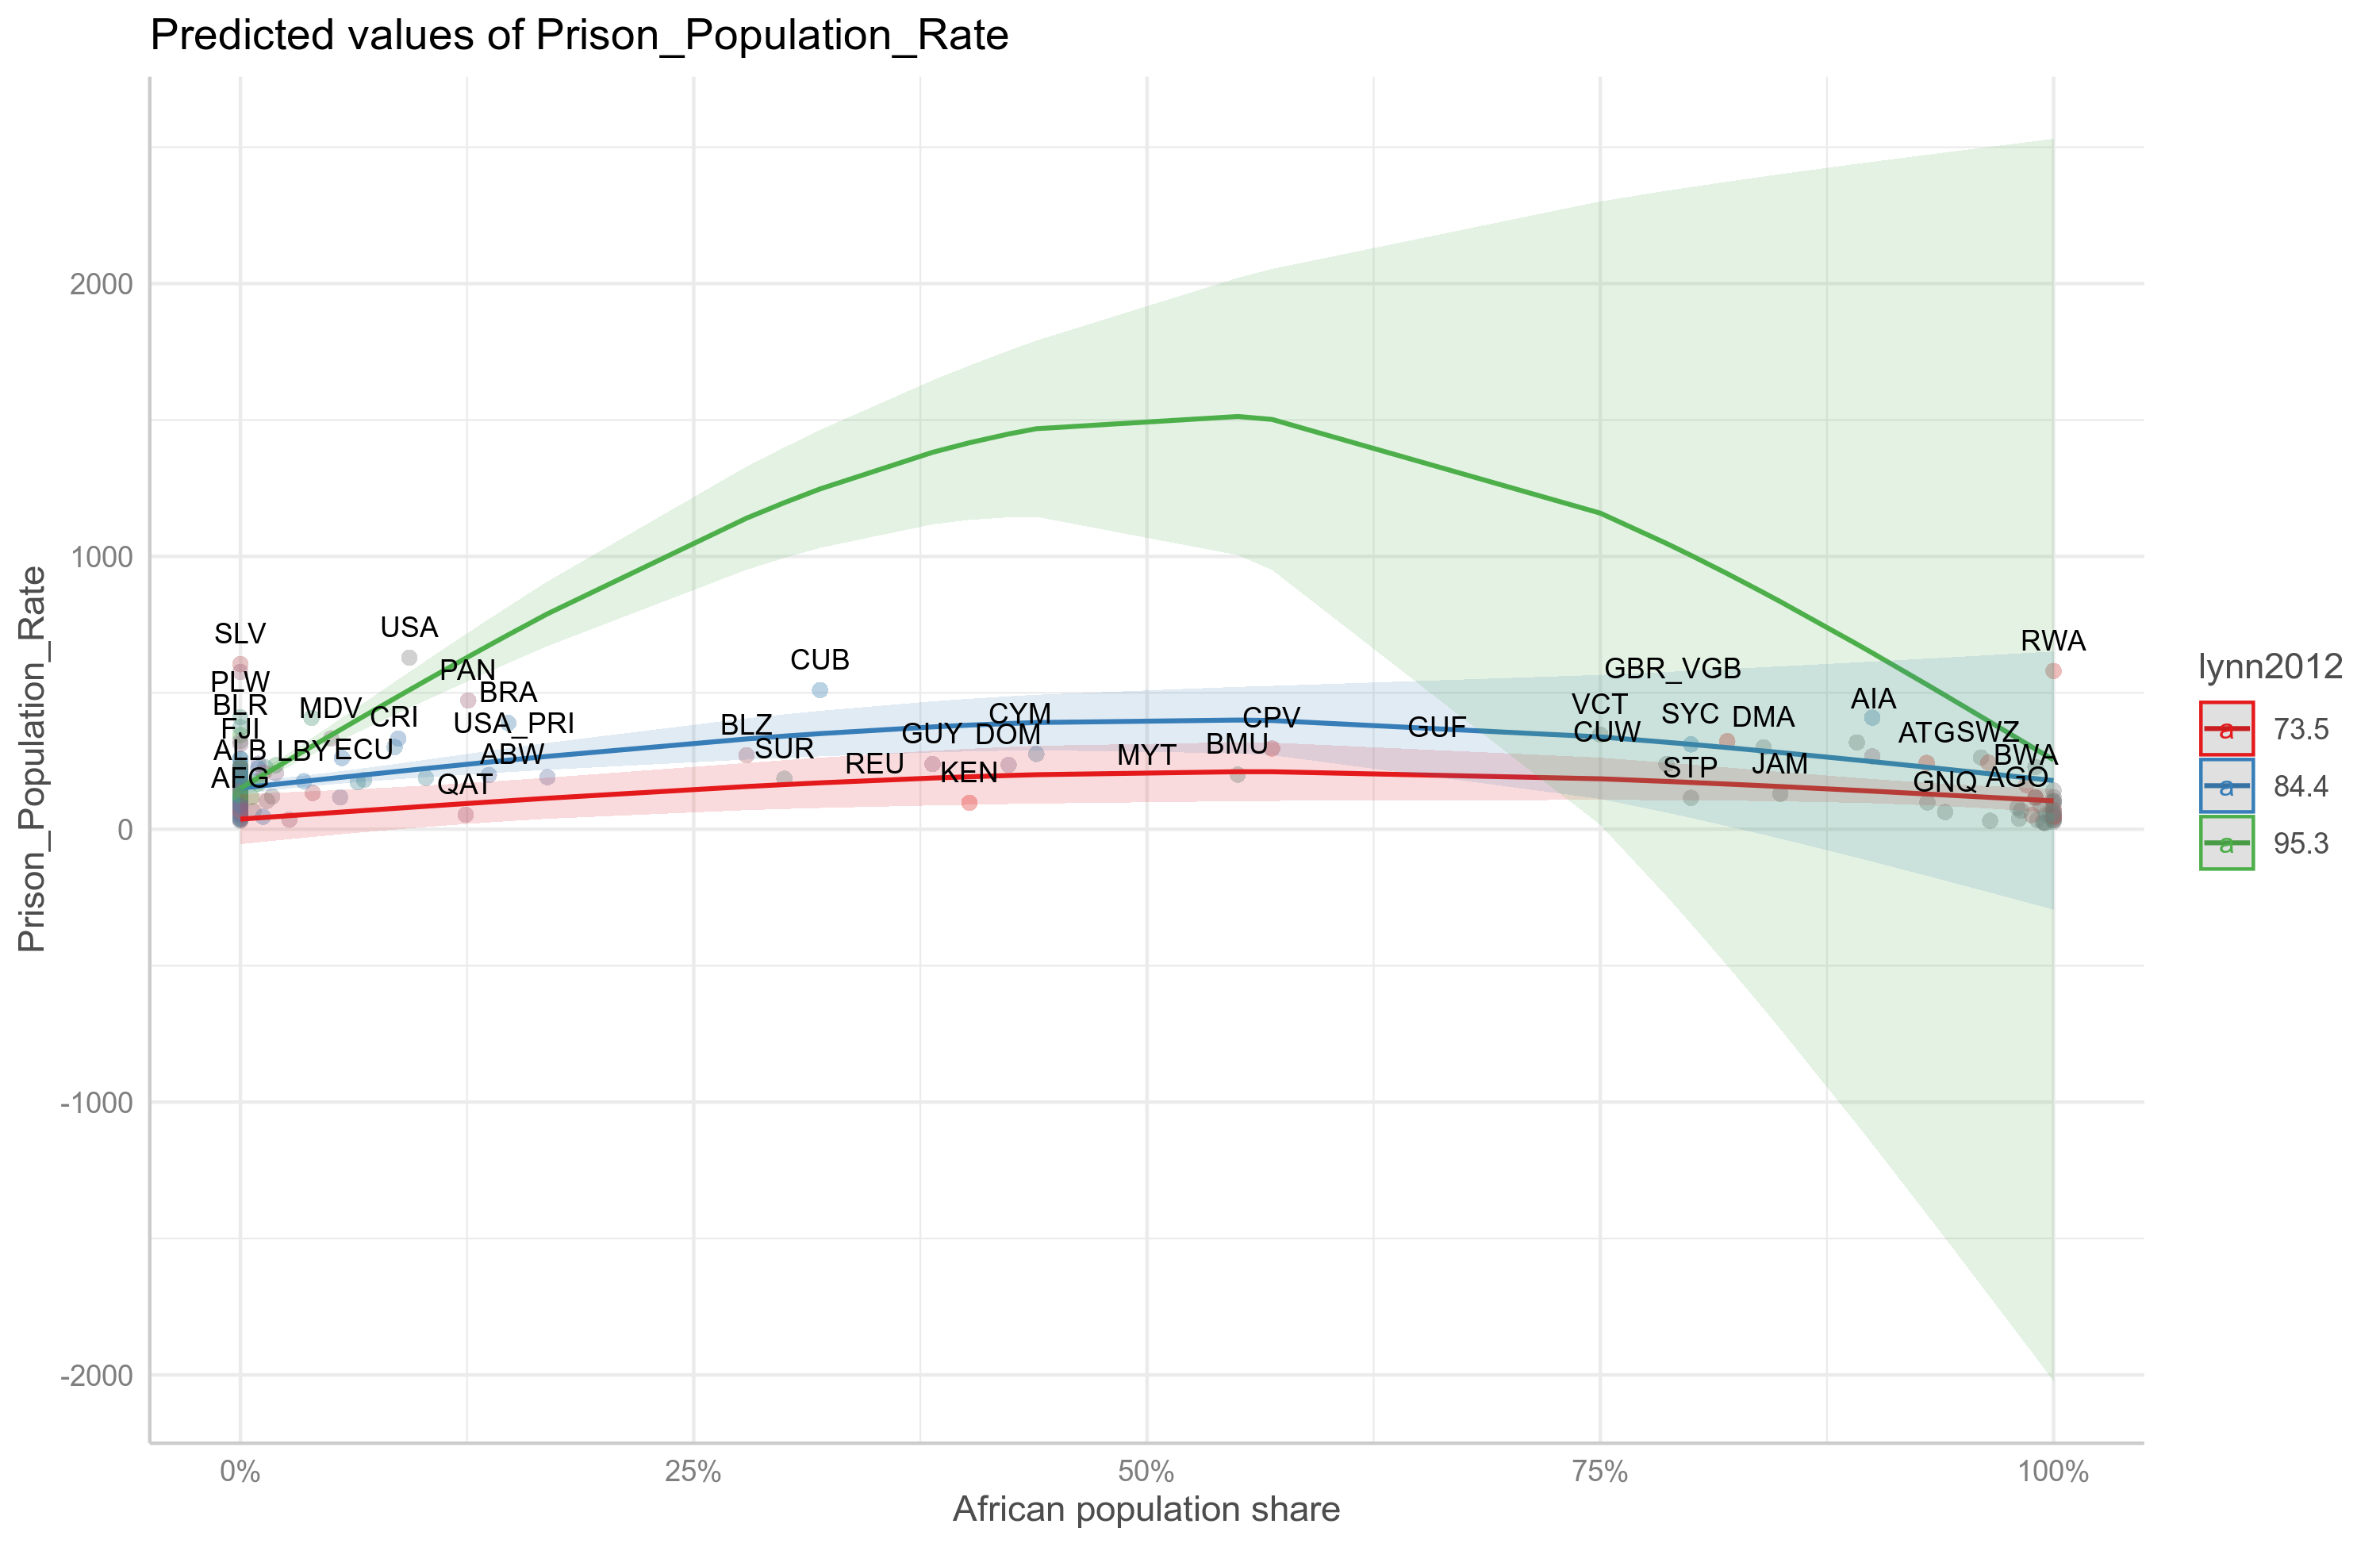
I have overlaid the original data. The model thinks that African population share doesn’t have much to do with crime rates when national IQs are not high. When national IQ is high though (green line), then African population share is thought to result in a big increase in the prison population. The model also suspects there would be a decline as one reaches 100% African, but the confidence interval is enormous. Why is that? Because there are no countries with high IQs and that have large African %. So the model is really just guessing the shape of the function based on the lower IQ countries. A linear effect would also be compatible with the uncertainty region.
One way to verify this kind of model prediction is to look within a country that has high IQ, but varies in subnational African population share. Of course, USA itself is good for this purpose. Wikipedia has the prison rates by state, and also the African population share. Somehow I don’t see a ready-made plot of this relationship on Google, but here it is:
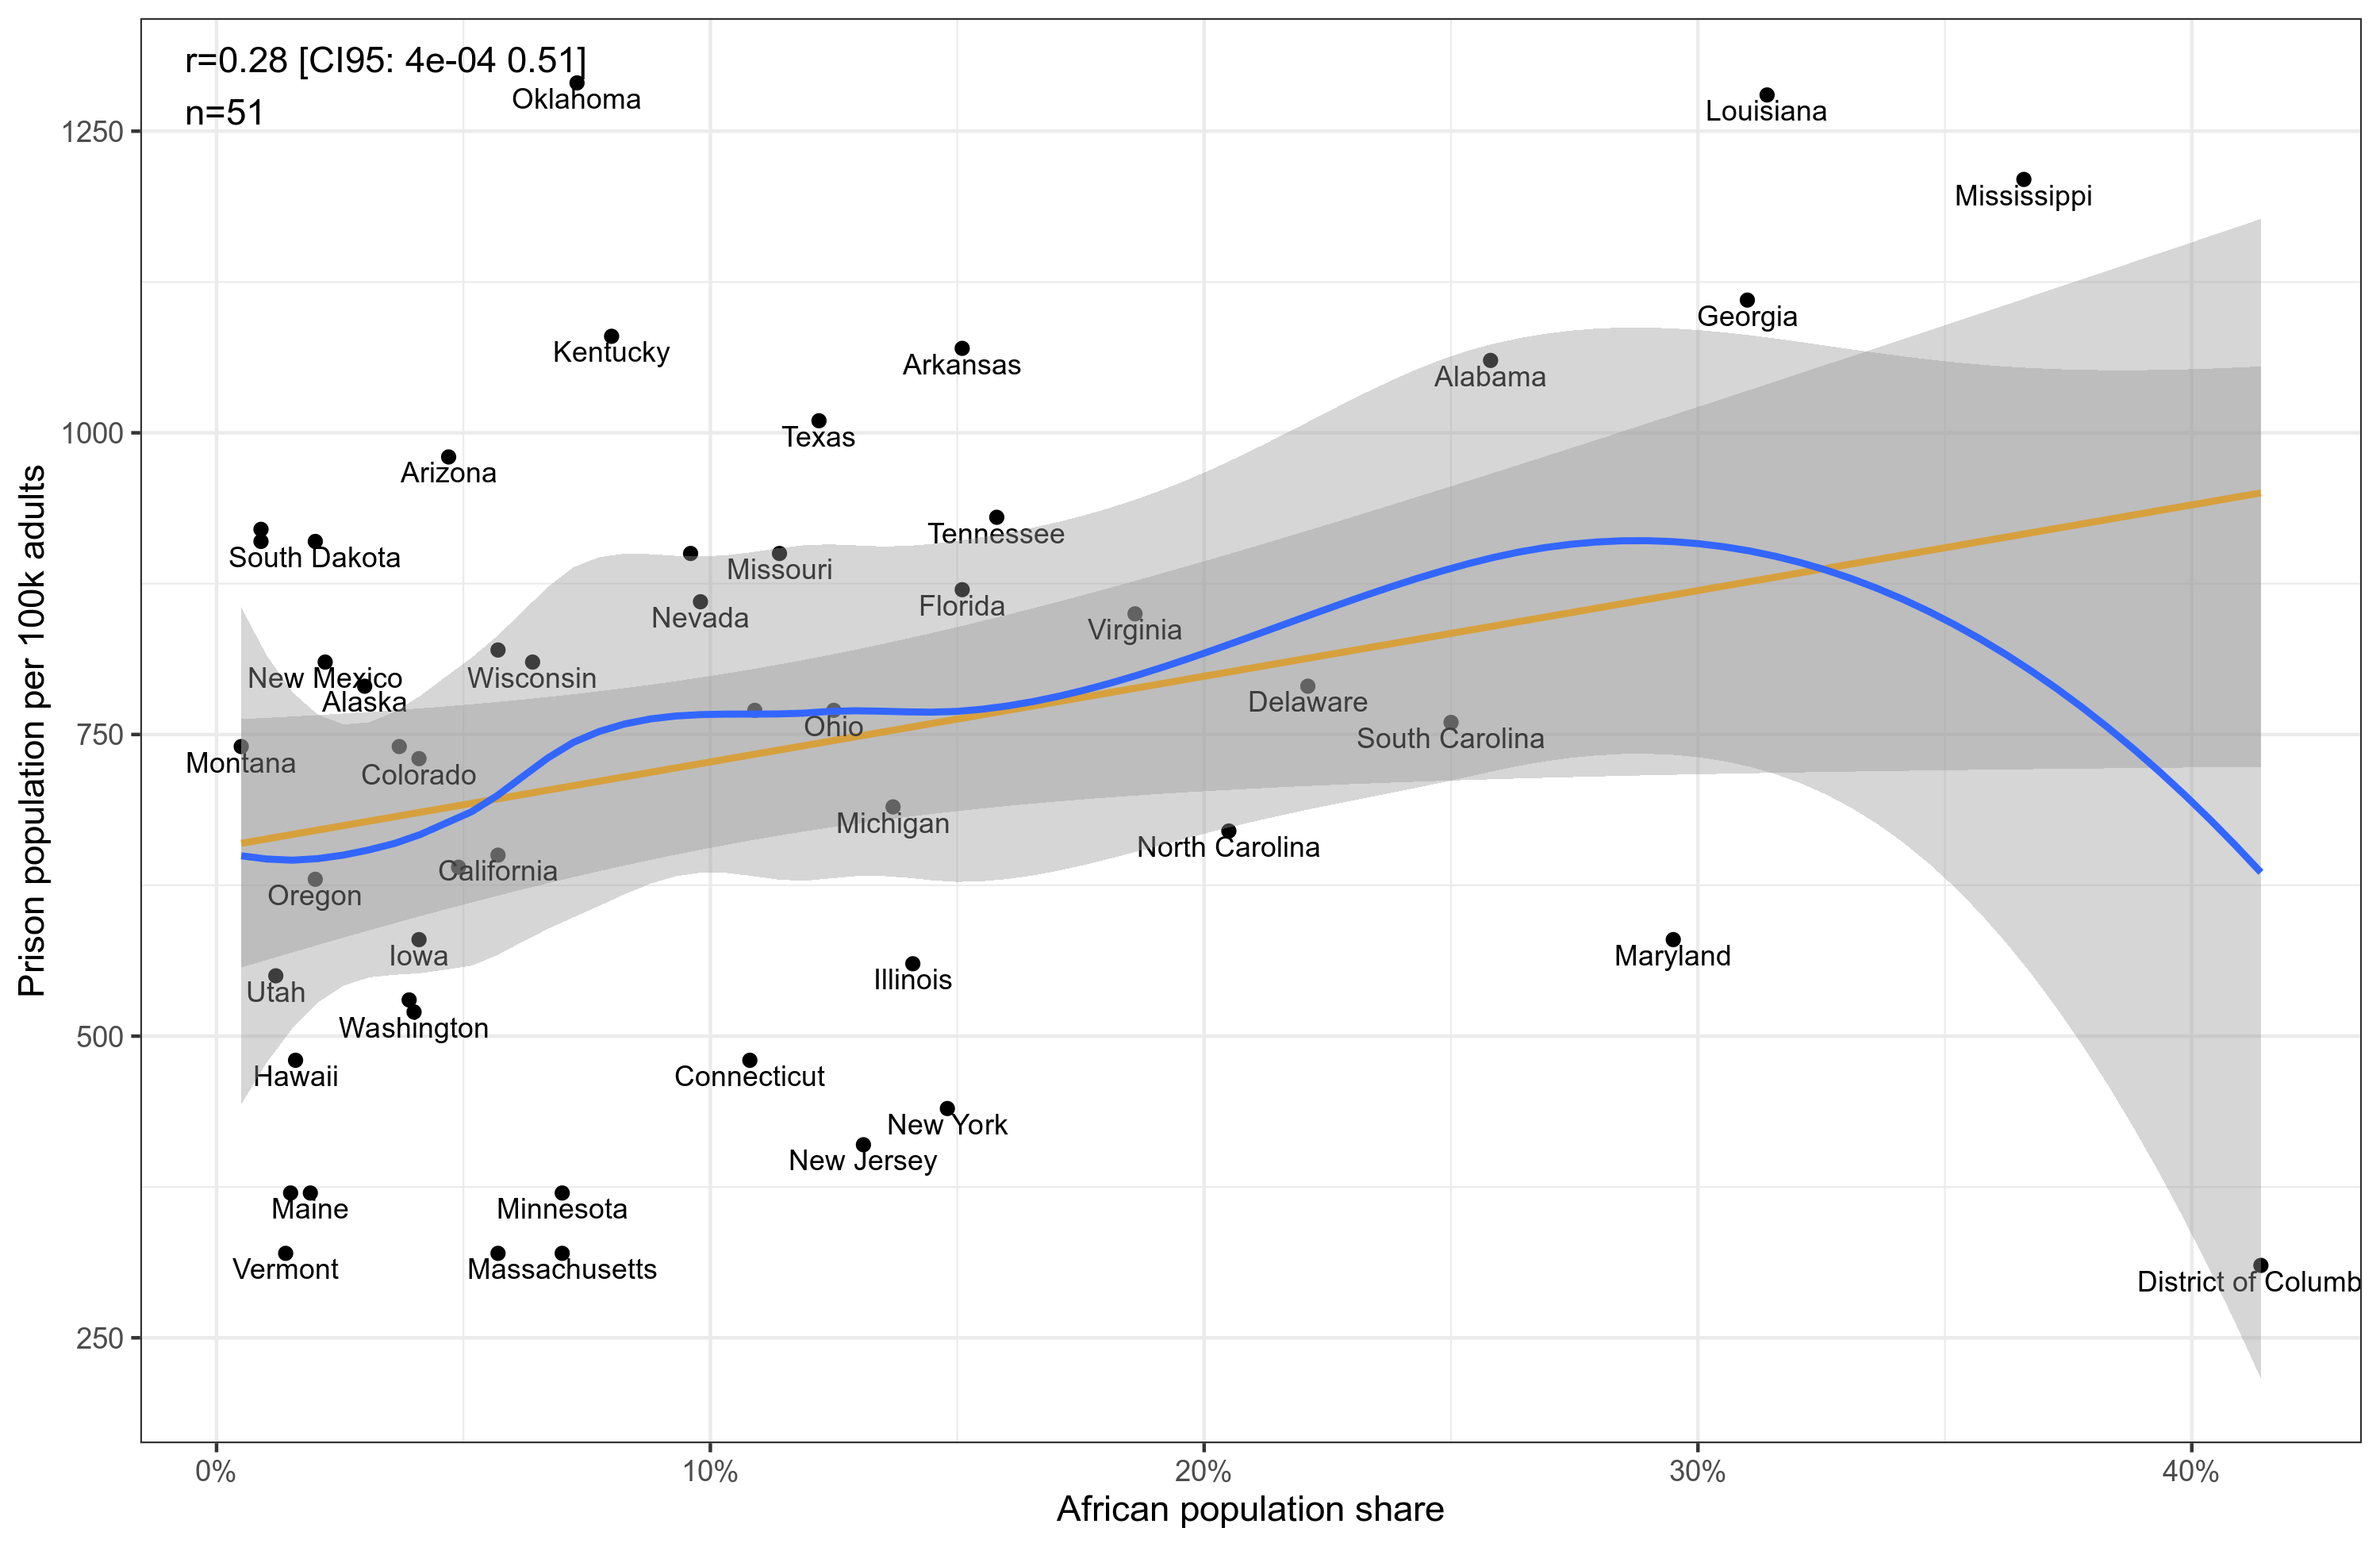
Reality however proves complicated again! The relationship is mediocre. A cursory look at the data, though, suggests that this is due to prison policy differences across states. The more left-wing, the more lenient. Maryland has about the same African population share as has Georgia and Louisiana, but the latter two are run by Republicans and Maryland by Democrats. Their prison rates differ by about a factor of 2. Here’s the US state models:
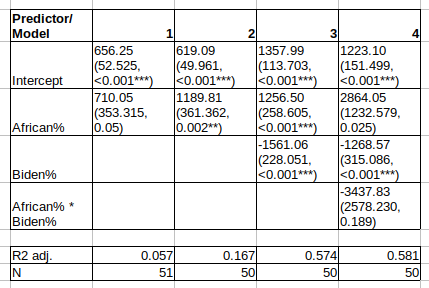
Model 1 vs. 2 is just the inclusion or exclusion of Washington DC. As can be seen in the plot, it’s a big outlier. The p value changes from .05 to .002. Wash DC is excluded in the later models as it doesn’t vote for presidents (yet anyway). The slopes are easy to interpret. Going from 0% to 100% Africans adds some 1250 prisoners per 100k. Voting 100% for team Biden removes about 1560 per 100k. And you start with 1360. So a 100% White 100% Team Trump would be at a 1357 rate, which is really very high! A 100% White 100% Biden would have a negative rate of -200ish. Of course, this is impossible, and really just shows us that the model doesn’t know the value must be positive. Still, the value would be very low, as in Vermont but lower. And in reality, a 100% White 100% Trump country probably would be a lot more lenient on crime, as Americans are largely harsh on crime because they have to deal with highly criminal subpopulations I think.
Conclusions
- Overall, prison rates seem mysterious at first. They don’t even relate much to the murder rate.
- This mystery must have something to do with state capacity to deal with criminals, and their desire to do so. Undeveloped countries can’t or won’t imprison a bunch of criminals. The government are the criminals.
- If we look for nonlinear interactions between African population share and national intelligence (as measure of state competence), we find that the relationship mostly makes sense.
- Verifying the idea within US states confirms the picture but here we needed to adjust for political leanings wrt. criminal justice.
Of course, this is not really a thorough of the international gaps. The most obvious things I left out are the areas with extreme totalitarianism (Turkmenistan, Cuba), recent civil wars (Rwanda), and those that are harmed by the US fueled drug war (northern Latin American). Some of them I have no theory of, e.g. Uruguay.