Naturally, you’ve heard that eugenics is something that evil people, in fact, Nazis support. So, which country has more Nazis? PEW research was kind enough to ask a bunch of countries:
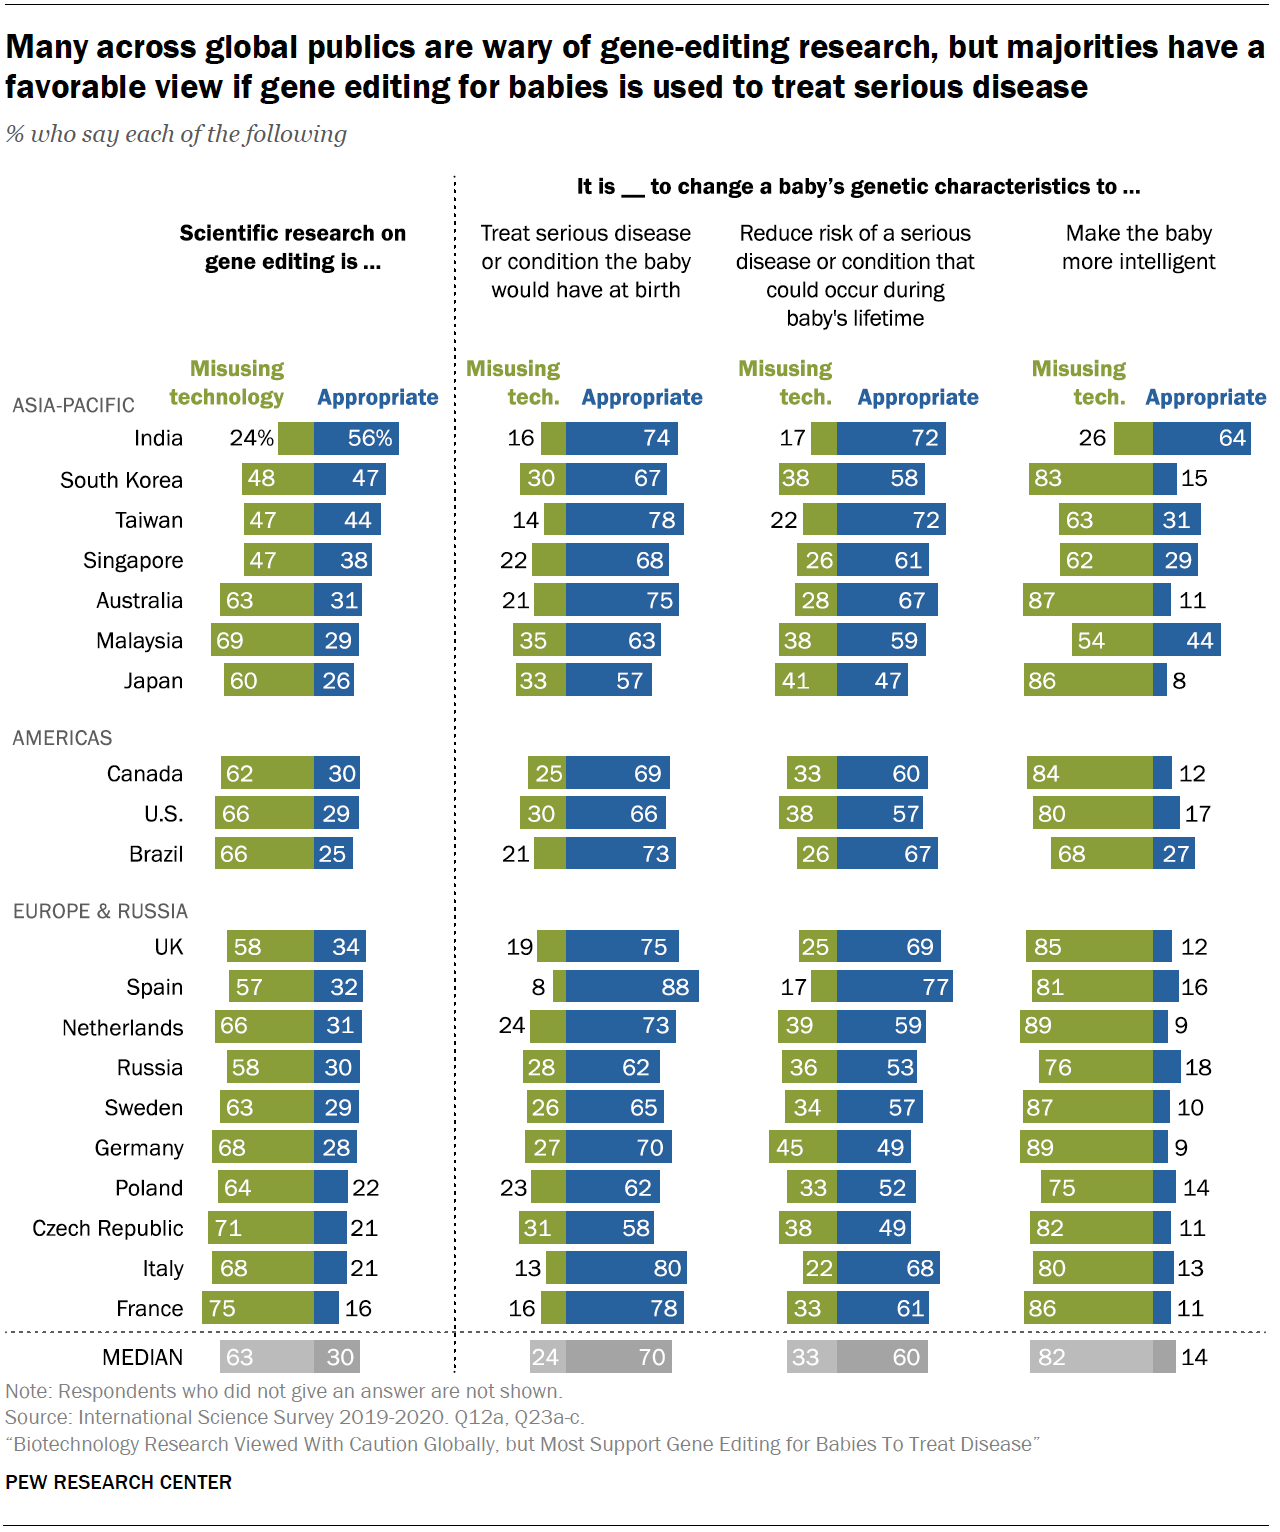
Uh, based India? Malaysia is also doing alright. The big problem here is that they didn’t include China or Thailand, which are likely to be also on the more positive side. Note Taiwan is also at 31%.
The West, however, are disappointing with only about 10% of people being in favor of editing embryos (‘babies’) for improved intelligence. Still, we might wonder what kind of people inside the West are in favor of things. This could tell us something about where future trends are going. Fortunately, in 2018, PEW also did a study of this kind for the USA. They presented various plots like this one:
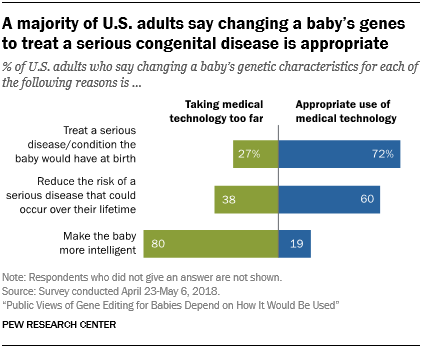
They didn’t do any regression modeling, so it’s hard to be sure what are the independent effects of each variable. However, since the dataset is public, I have taken a look. I followed the usual approach: Start with simple regression models to predict who is more in favor of editing embryos to increase intelligence, then we gradually add more predictors. Results look like this:
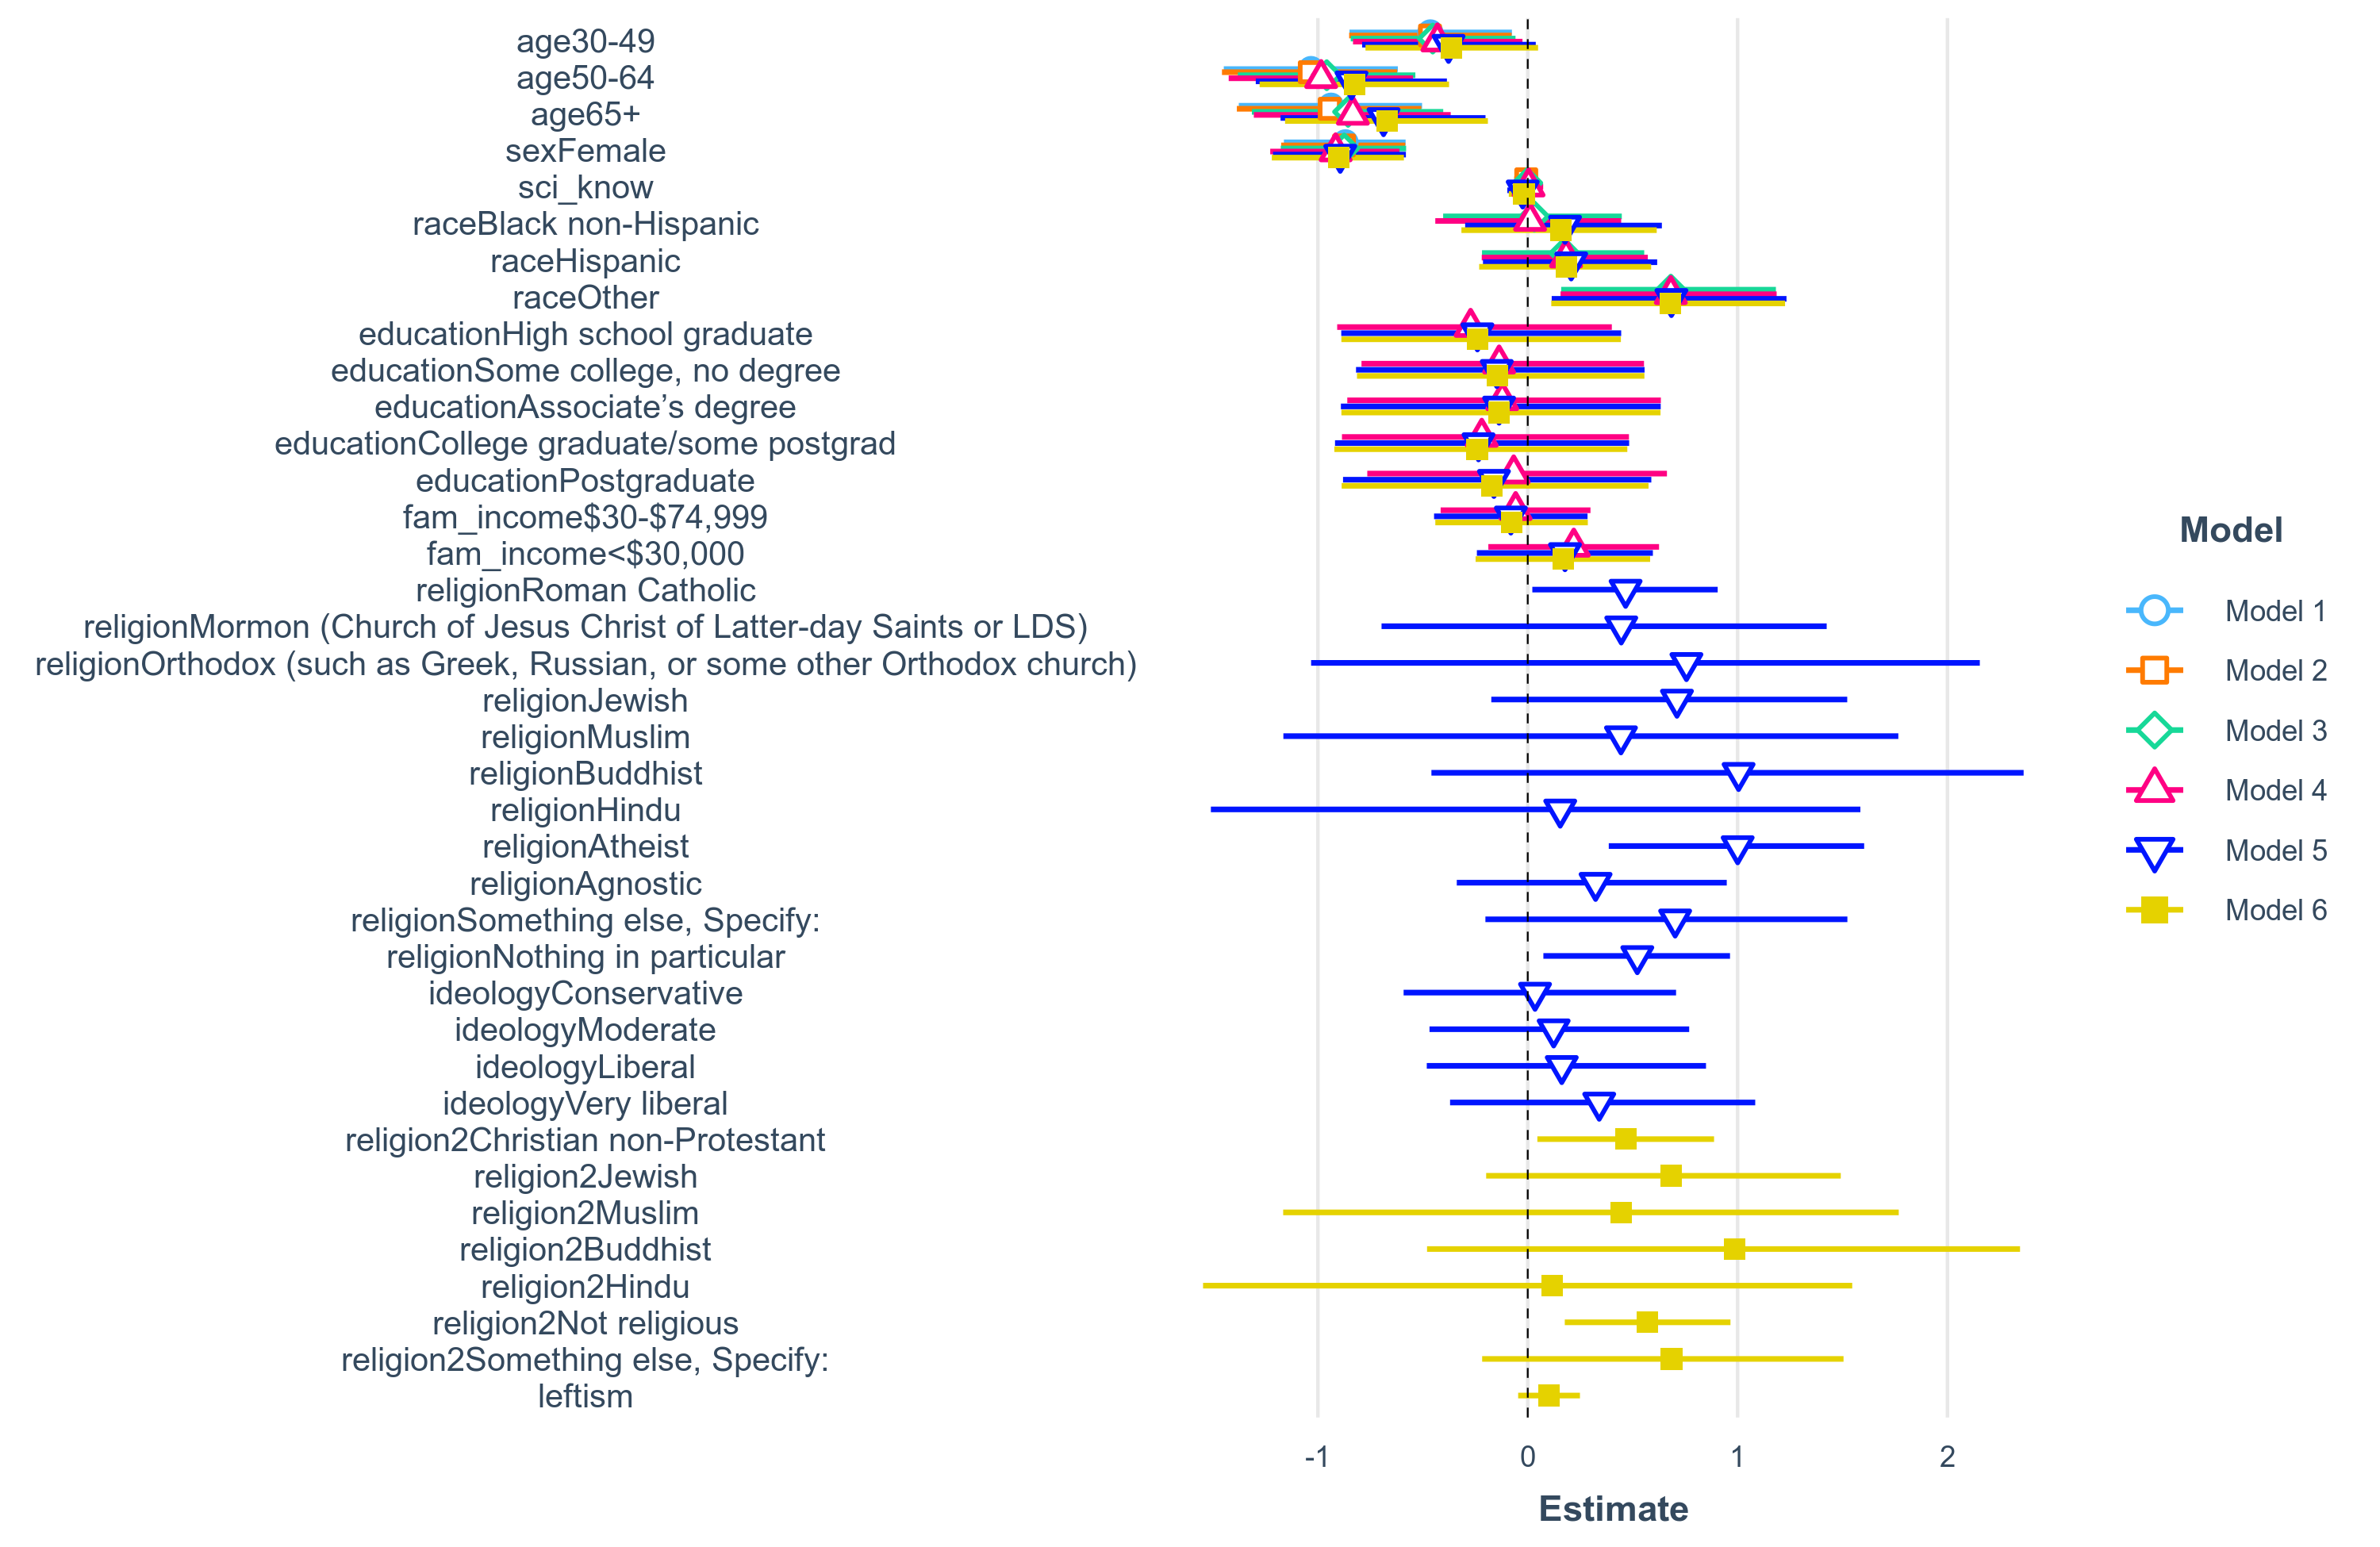
It is still somewhat difficult to interpret because this plotting function (jtools::plot_summs) does not include the reference level for factor/nominal variables. The error bars are 99% Frequentist confidence intervals. But what we see in the first 5 models:
- Age: The data uses age groups as opposed to giving each person’s age. The reference group is the youngest, 18-29. These are the most positive about eugenics, no matter which other variables predictors are included in the model. The effect size is pretty large, about 0.70 logits.
- Sex: Women are less in favor of eugenics no matter which other predictors are included. The effect size is pretty large, close to 1 logit.
- Scientific knowledge (10 items). There is no effect of this.
- Race: White is the reference group, so the values shown here are those in contrast to Whites. People with “other” race, which means people who are not Hispanics, Whites, or Blacks are more in favor of eugenics. This is probably mostly Asians and Indians. As these people are also more in favor in their home countries, this is not so surprising.
- Education: There is no effect of education! (Less than high school is the reference group)
- Income: There is no effect of income! (Income >75k is the reference group)
- Religion: There are a lot of religions, so we don’t have that much precision for each of them. However, given what we have, it seems that atheists and “none in particular” areligious people are more in favor of, well, playing God. Roman Catholics are also more in favor, which is weird, and possibly a fluke, as the confidence interval is close to 0. For those who are interested in Jews, Judaism has a positive effect, with a p value of .03, but since I used 99% confidence intervals here, it doesn’t sow up with a ‘hit’. Still, this is some evidence against Jews being particularly anti-eugenics in the USA.
- Ideology: Ideology is not associated with support. If anything, there is a slight tendency for more leftist people to be more in favor.
Since some of the variables had too many levels for proper statistical precision given the sample size of 2537 people, so I fit a 6th model, also shown above, which simplified the results a bit. Still, we see about the same as before, namely that non-Protestants are somewhat more in favor of eugenics than are Protestants (the reference group), with a beta of 0.47. The combined nonreligious group is slightly more in favor, with a beta of 0.57 The effect of leftism is eh, p = .076, towards greater support.
In terms of probabilities, logits are somewhat uninterpretable, so concretely, this is what the model says for some specific people:
- Young (18-29), White man, no religion, average politics, average family income and education, average scientific knowledge: 34% chance of supporting eugenics
- Old (65+), White woman, Protestant, average politics, average family income and education, average scientific knowledge: 6% chance of supporting eugenics
Since education, family income, scientific knowledge etc., doesn’t matter much, we can also construct a plot like this one:
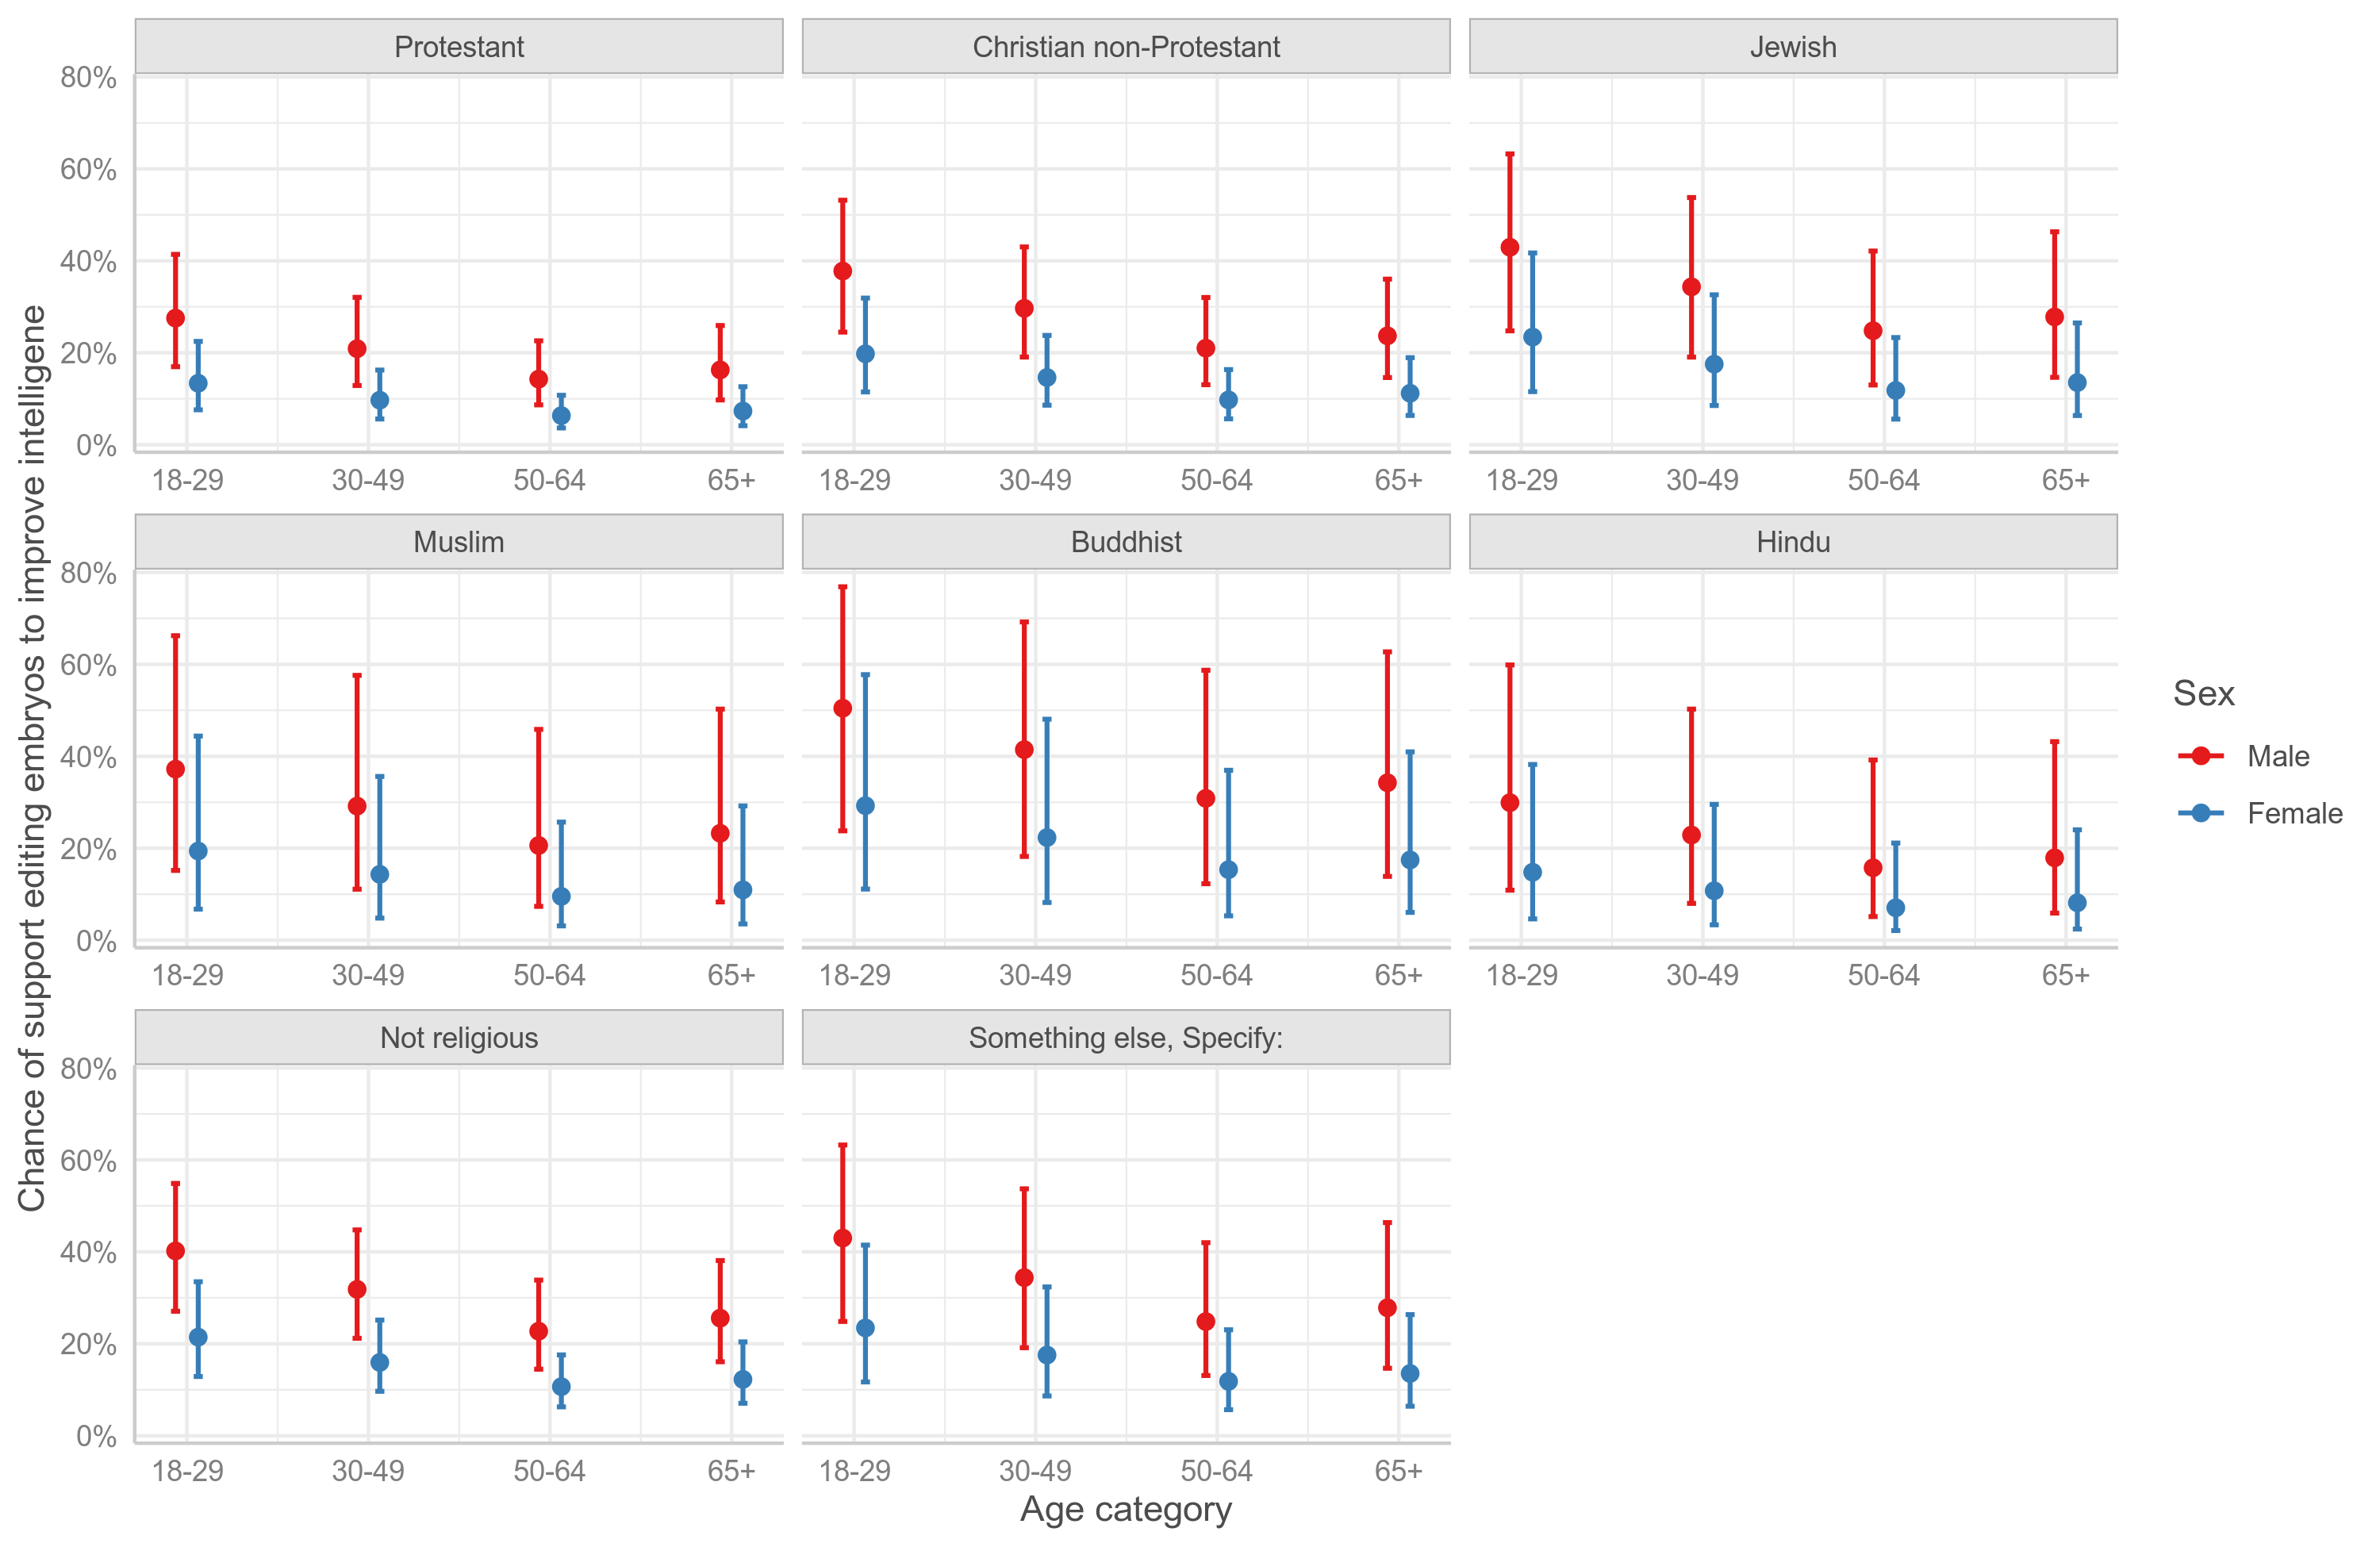
It shows the same information as one can infer from the model logits, just in human friendlier format. E.g., you can look up that a 35 year old White woman who isn’t religious will have about 18% chance of support (bottom left plot, second column). The predictors that are not included in the plot are set to their median/modes (race = White etc.). While no group clearly has a majority in favor, young Buddhist men are at about 50% according to the very imprecise estimates.
Overall, though, the results contradict the media narrative that supporting editing embryos/babies for improving intelligence is something that especially right-wingers are interested in. In fact, it seems about the opposite. If we look at ideology alone, it is clearly a left-wing position:

For those familiar with the history of eugenics, this shouldn’t be too surprising. Eugenics was first and foremost implemented in the Nordic countries by the Social Democratic parties. The book Eugenics and the Welfare State: Sterilization Policy in Denmark, Sweden, Norway, and Finland: Sterilization Policy in Demark, Sweden, Norway, and Findland (2005) gives a good summary.

In Denmark, it went something like this:
During the last years o f the nineteenth century, the utopian hopes of educating and essentially curing the mentally retarded had largely been abandoned. More and m ore, the institutions became places where the inmates were kept isolated from the rest o f society, where they could be trained in certain skills according to the way they had been classified, and where a reasonable amount of work could be extracted from them, under humane conditions and for the benefit o f society. The teacher and the amateur philanthropist became subordinate to the physician, the expert who could classify the mentally retarded and determine the extent of mental retardation, and subsequently the amount of instruction required. The social niches where the mentally disabled could maintain an existence were slowly disappearing, and m ore and m ore people were being flushed out into a strange world where accelerating industrialization and urbanization made them helpless. The mentally retarded were no longer figures o f fun; the old crude ways were disappearing, succeeded by the modern, “humanitarian” attitude— that they should be kept out o f the way. The result was that pressure on the institutions increased; and to most observers, it appeared that the number o f the mentally retarded was increasing.25 Craniectomy meant that the last hope o f curing the mentally retarded had to be abandoned; b u t other, less dangerous types of surgical intervention still held out the hope that the feared increase in their number could be checked.