You might know the following scenario: you or your ancestors migrated from a given country, or you yourself is a member of the major ethnic group of some country. At some point you got interested in human intelligence, so you decided to search online for your country performs. Google gave you some random website with a list of national IQs. You wonder if this list is accurate. How can you tell?
In fact there are a number of researchers or teams of researchers who have tried to estimate the average intelligence level of most countries in the world. So if you are interested in a particular country, simply check one or more of these compilations. I’ve compiled the data for 6 of them here in this spreadsheet. For more on these, see my recent post on the latest compilation by Altinok & Diebolt 2023.
Case in point. A reader emailed me about the Iranian national IQ. He finds that the value given by Becker’s 2019 meta-analysis is too low, an IQ of 80. Iran does well in the various science and math Olympiads, so is the value really accurate? First, we can check what studies Becker 2019 actually relied upon. Download the database yourself from his website and check. It’s these 3 rows:
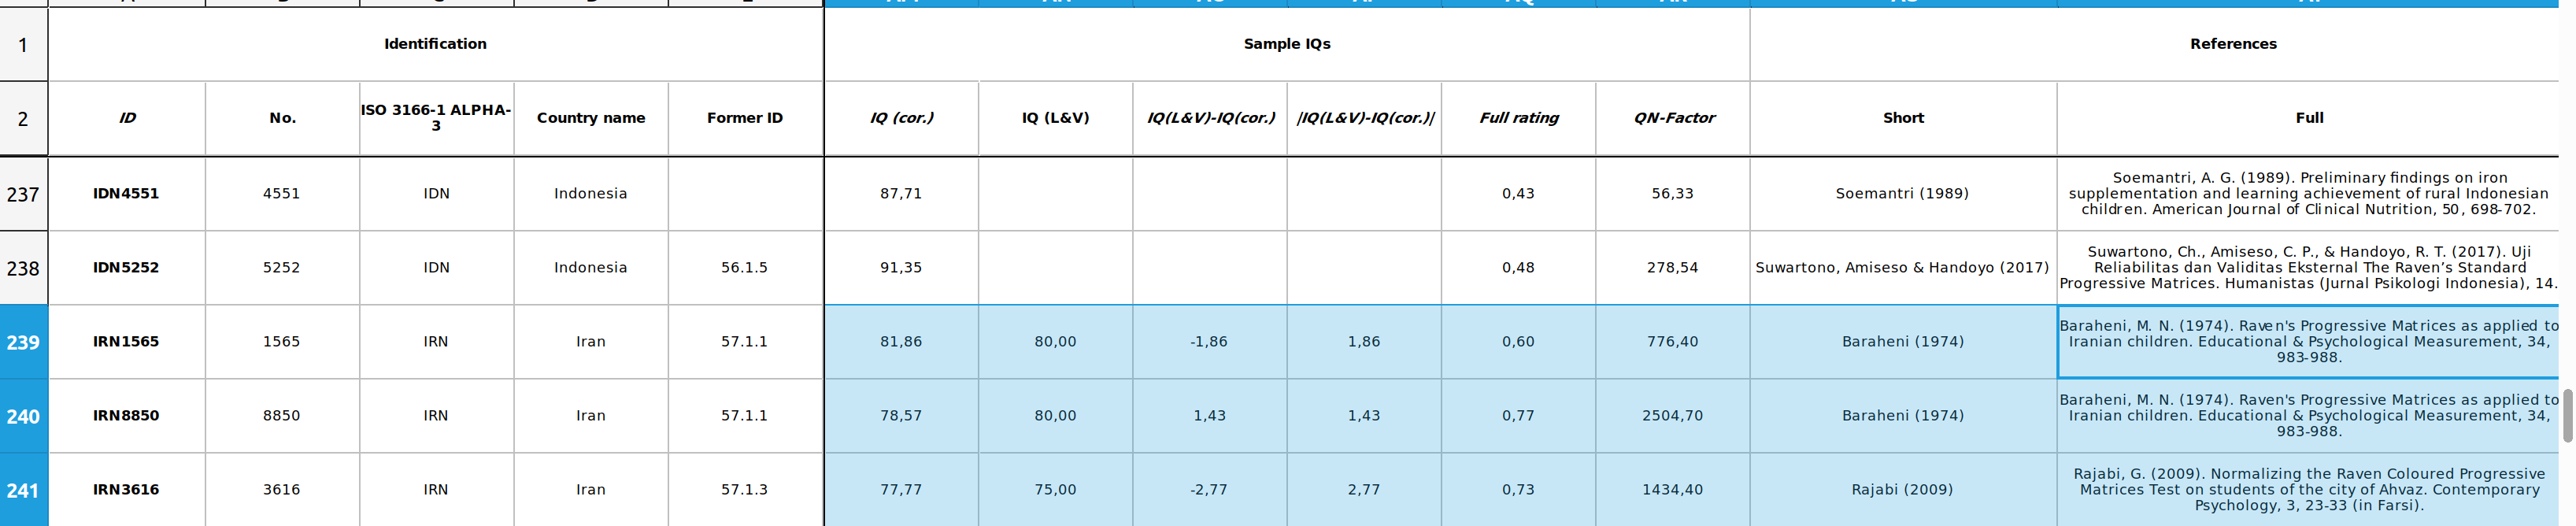
So there are 2 studies, reporting data from 3 samples:
- Baraheni, M. N. (1974). Raven’s Progressive Matrices as applied to Iranian children. Educational & Psychological Measurement, 34, 983-988.
This study reports the results of the application of Raven’s Progressive Matrices (PM) to a representative sample of Iranian children attending schools in Teheran, the capital city of Iran. The study showed that boys did score slightly higher on the PM than did the girls, the differences being significant up to age 13. There was a consistent increase in PM scores at successive age levels, but the increments were not significant beyond age 15. Iranian children scored considerably below the British norms, although this decrement might have been due to the timed ad- ministration of PM in Iranian samples and to a variety of cultural factors. The reliability and validity of the PM were found to be satisfactory. Although the findings indicated the general suitability of the PM for use with Iranian children, there is a need for further normative and validity studies.
- Rajabi, G. (2009). Normalizing the Raven Coloured Progressive Matrices Test on students of the city of Ahvaz. Contemporary Psychology, 3, 23-33 (in Farsi).
The purpose of the present research was normalizing the Raven Coloured Progressive Matricies Test (RCPM) as a general intelligence test on 7-11 year old students in the city of Ahvaz, who were randomly selected, in age groups 7,8,9,10, and 11 (1956). Test-retest reliability coefficients (2 weeks interval) in the whole sample and in each age group. Was significant Also, there was a significant correlation between RCPM scores with Goodenough-Harris Draw Scale in the whole sample and in the 8 to 11 year old (convergent validity). Factor analysis of variance showed that there is significant differences between 7-11 years old of students in RCPM Test (P< 0/0001), and there is not significance but the difference between girls and boys in RCPM is not significant. Analysis of normative data suggests that the Raven Colour Progressive Matrices Test are developmentally sensitive measures. In addition, normative findings (percentile ranks and standard scores) indicated that general intelligence and intellectual abilites Iranian children is similar to children in the United Kingdom Britanian children.
Both appear to be done by Iranians themselves, and both used a non-verbal matrix reasoning test. Beware that the studies themselves usually don’t give you IQ estimates, or often wrong ones. That’s because they usually don’t adjust for the Flynn effect, i.e., they use outdated norms. You could go about doing the raw score to IQ score conversion yourself, but this requires that you obtain the various test manuals.
But suppose you don’t trust these two studies or Becker’s calculations, you can look at the other compilations of data. Some of them disregard the matrix reasoning data, and rely only upon student achievement tests instead. These are tests like the PISA. Here’s the results for Iran across the 6 meta-analyses:

So on the IQ scale (British Europeans = 100), the estimated average for Iran is 86, 85, 80, 83, 87, and 83, with an overall mean of 84. Clearly, it doesn’t matter much who is doing the analyses or which exact tests were used as all results were very similar. What this is really telling us is that the various national IQ estimates are very highly correlated. Here’s some examples:
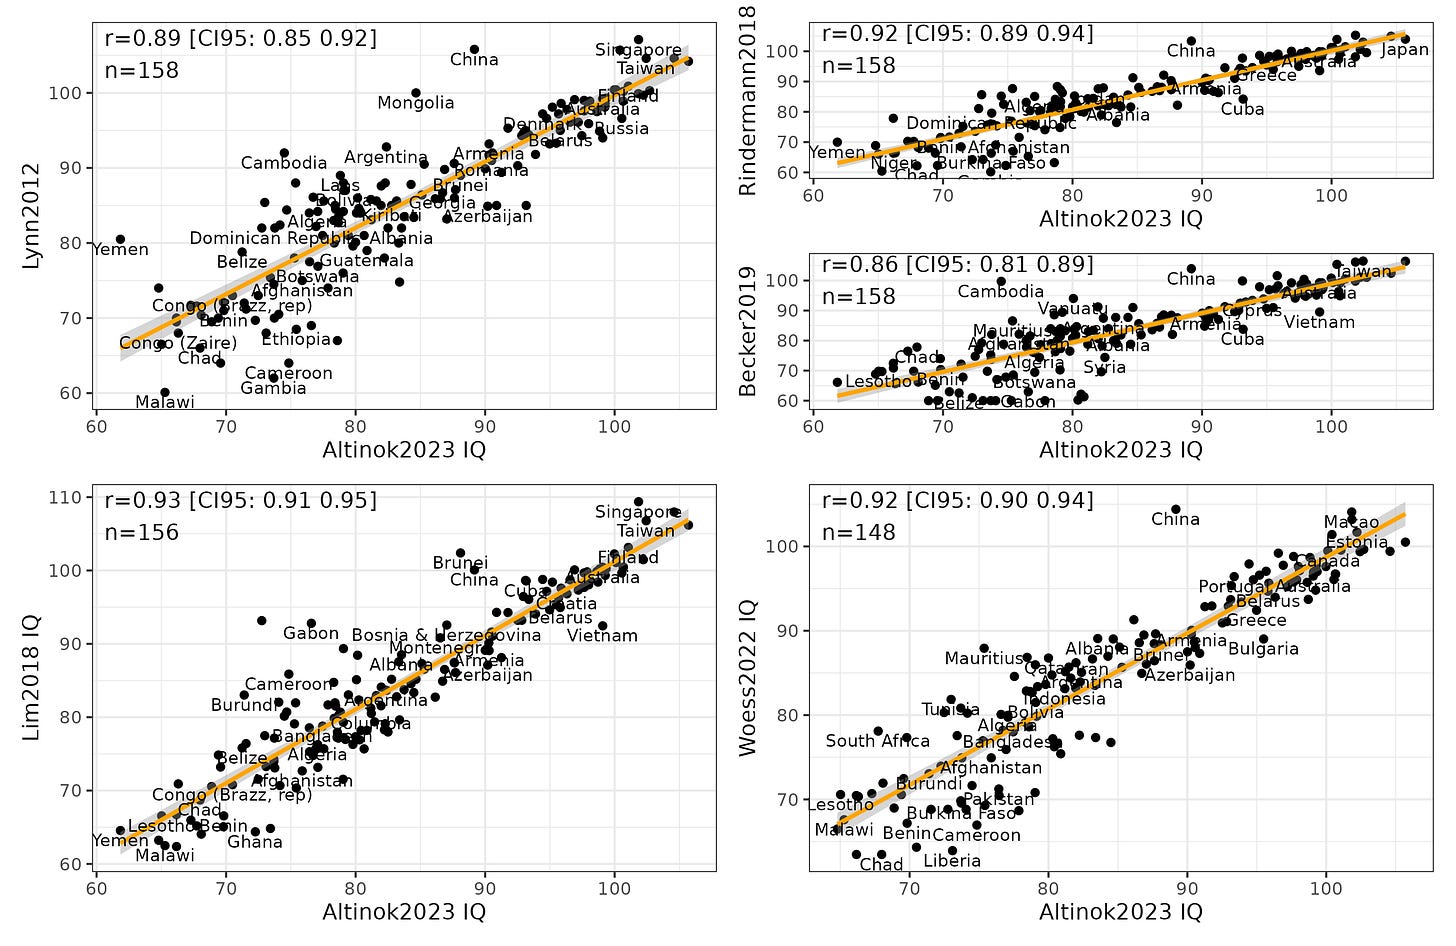
Now there are some outliers (especially China), but overall, they agree very well.
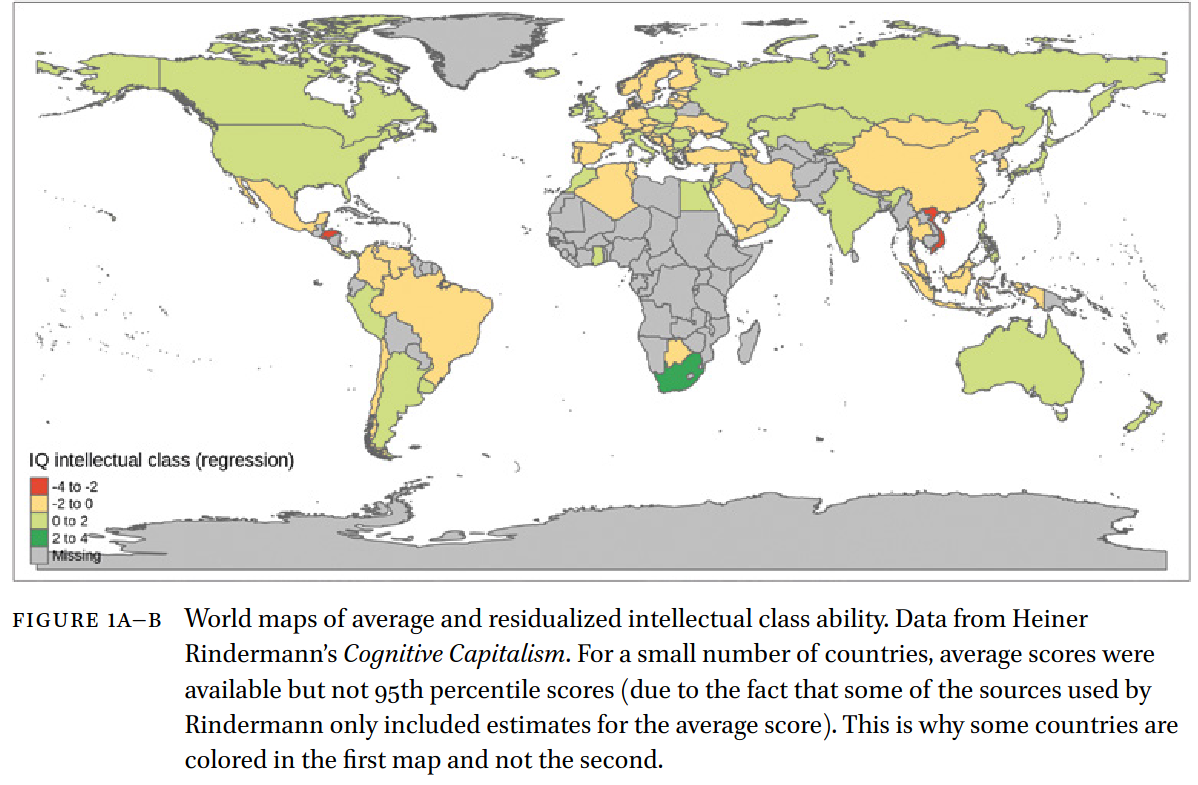
Another approach is to check whether the level of development of the country corresponds to the IQ average. We know that these are highly correlated, so if a country is a big outlier, it may suggest that the IQ estimate is faulty, but it could also mean that the country is suffering from communist rule or some other problem. Here’s a plot between an overall index of the well-being of a country and national IQ:

If you look closely, you see that Iran is about in the middle for both variables. It does only slightly better as a country, overall, than one would expect from the estimated average intelligence of the people. Iran doesn’t have a communist economy, but is suffering from an Islamic dictatorship, and is under various USA-related sanctions. Despite these problems, Iran appears to be doing about as well as one would expect based on the intelligence of its people. The level of development of the country, therefore, doesn’t provide any reason to doubt the estimates of average intelligence.
Another possible explanation of Iran’s math Olympiad performance is that Iran contains multiple ethnic groups, or subgroups, and that some of these are quite bright in comparison to the rest of the population. This gives the country a large smart fraction score (i.e., a relatively large number of smart people relative to the expectation based on the average intelligence). In our 2022 study, we computed smart fraction scores for most countries based on the student achievement test data (data from Rindermann’s meta-analysis):
Iran doesn’t have a notable smart fraction, so this hypothesis seems unable to explain the stellar performance of Iran in the math/science Olympiads.
Summary
- It’s easy to check what data lies behind a given estimate of national IQ using Becker’s 2019 database.
- Iran’s national IQ of about 84 seems low given their performance in the math Olympiad. However, since all the national IQ estimate for Iran are very similar, and the overall level of development of the country is about what one would expect based on an IQ of about 84, the value is likely accurate.
- Iran doesn’t appear to have a large smart fraction that can explain their good performance on the math Olympiad. Instead, the explanation is probably that that the Iranian government thinks it’s important to win this prize, so they use talent searches to find the best students, and use government money to sponsor teams.