There is a movement on Wikipedia, and elsewhere, to use a simplified version of English. This is mainly achieved through the limitation of which words can appear. The chief goal is to help non-native speakers, but there may be other benefits to this idea. It has been known in psychology for many years that many subjects will agree with literally anything you put in a survey. This has been given the unhelpfully difficult to spell name of acquiescence bias, really, agreement bias. Relatedly, Scott Alexander pointed out that there is a certain level of noise because of this, and that small groups of people with unusual beliefs may in fact be dramatically overestimated. He termed this the lizardman’s constant:
Public Policy Polling’s recent poll on conspiracy theories mostly showed up on my Facebook feed as “Four percent of Americans believe lizardmen are running the Earth”.
(of note, an additional 7% of Americans are “not sure” whether lizardmen are running the Earth or not.)
(Some people are also just filling out responses at random, and deliberately to annoy the researchers, and these contribute to the same problem he is talking about.)
Another way this bias manifests is when you are doing personality surveys. Suppose your extroversion scale has 5 questions, all of which are keyed in the positive direction, that is, more agreement means more extroverted. Anyone who tends to agree with anything you ask them will be classified as more extroverted. If you also have a conspiracy belief scale that works the same way, you might mistakenly conclude that extroverts are more likely to believe conspiracies. The bias is usually slight, but can be large in some contexts. To avoid this bias, some psychologists cleverly write their surveys so that half the items are keyed in one direction and the other half in the direction direction. This then spreads out the bias about evenly so that it doesn’t affect the results. It also comes at a cost of making the survey less reliable because negatively phrased questions are harder to understand, so subjects may respond the wrong way by mistake. In some cases, it might not be worth the trade-off.
Sometimes, though, you don’t have time and space to do two versions of every question, so what to do? A new study looked at the obvious intervention of writing things in simpler language (Rammstedt et al 2023, Do simpler item wording and response scales reduce acquiescence in personality inventories? A survey experiment):
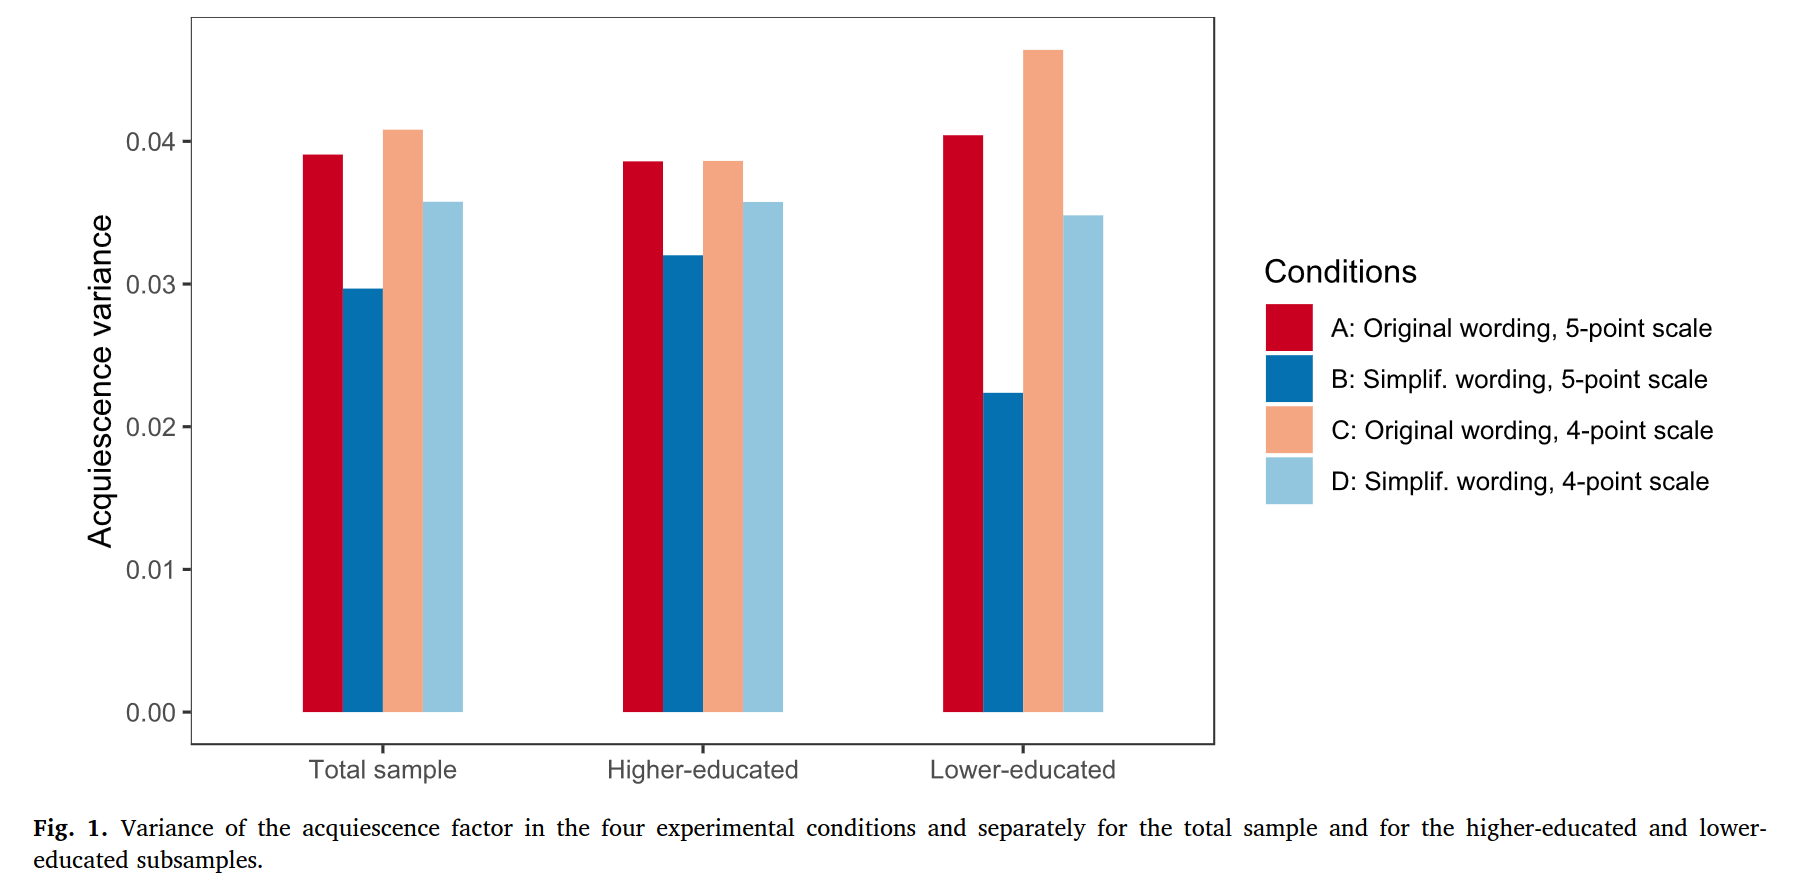
They gave subjects a standard personality questionnaire, but half of them received one that had been rewritten to use simpler language. They also tried reducing the 5-point scale to a 4-point scale, that is, they removed the middle, neutral option. They then fit a model to this to see the size of the agreement bias factor. It explained a relatively small proportion of the variance, about 4%. Removing the neutral option didn’t do anything, but rewriting the questions helped. The effect was larger for less educated people (the interaction seems legit). As the authors reason (ironically not in simple language):
Previous—mostly correlational—studies have established several correlates and determinants of acquiescent responding (for an overview and theoretical framework, see Lechner, Partsch, Danner, & Rammstedt, 2019). Most have focused on respondent characteristics and identified inter alia lower education (e.g., Rammstedt, Goldberg, & Borg, 2010) and/or cognitive ability (Gudjonsson, 1986; Lechner & Rammstedt, 2015) as the most potent and robust determinants of acquiescent responding. Others have examined how questionnaire characteristics might influence acquiescent responding and have identified, in particular, the cognitive load of the items as a factor that increases acquiescent responding (Knowles & Condon, 1999). The fact that understanding ambiguously and complexly formulated items requires greater cognitive effort (Lenzner, Kaczmirek, & Galesic, 2011) gives reason to assume that the cognitive-processing capacity available for answering items is a major determinant of acquiescence (Lechner, Partsch, Danner, & Rammstedt, 2019). If items are lengthy and/or complex (Condon, Ferrando, & Demestre, 2006) and ambiguous (Angleitner, John, & Löhr, 1986), they require greater cognitive processing, which might induce stronger acquiescence, especially in respondents whose cognitive processing capacity is generally lower (as indexed, e.g., by lower education and/or cognitive ability; Lechner & Rammstedt, 2015). Previous research (Condon, Ferrando, & Demestre, 2006) has indicated that lengthier and more complex items were more susceptible to acquiescence. Therefore, one can assume that reducing the complexity and ambiguity of personality items will reduce the tendency for acquiescent responding for these items —especially among respondents whose cognitive processing capacity is generally lower.
In other words, if the questions are complicated, and you don’t want to think too hard, well, you might as well agree with the nice interviewer or researcher (why not? it’s just a survey, who really cares?). Whether a question is hard depends on how well you read and think, so the effect depends on education and intelligence.
Above I said the bias is usually small, but when you are trying to examine between-country differences, these survey biases may be large enough to seriously distort your results. Gerhard Meisenberg and Amanda Williams looked at this in a 2008 study that the authors seem to have missed (Are acquiescent and extreme response styles related to low intelligence and education?):
Several lines of evidence suggest that acquiescent and extreme response styles are related to low education or low cognitive ability. Using measures constructed from the World Values Survey, this hypothesis is examined both in comparisons among individuals and comparisons among countries. At the individual level, both acquiescent and extreme responding are positively related to age and negatively to education and income in most world regions. Both response styles are most prevalent in the less developed countries. At the country-level, extremity is best predicted by a low average IQ in the country, and acquiescence by a high level of corruption.
Thus, if you think you are finding something interesting in your survey data, you might just be deluding yourself, and what you are really seeing is whether the participants of that country are smart, or not used to corruption. They helpfully provide an average bias score by region:

So relative to doing surveys of northern Europeans — that is, most social science subjects — you will have a lot of this kind of bias in the Middle East, South Asia, and Africa. Subjects from these regions also tend to not use the middle points of a scale much, that is, they are relatively more prone to a black-and-white thinking style.
The bias can get extreme. Take for instance these not very widely known findings from the ROSE project, an international survey of 15 year olds:

It appears that 15 year olds in poor countries really like science, but those in rich countries are somewhat more hesitant. One could interpret this in a Unabomber-style “tech is actually bad for society, and you will only learn the lesson too late”, but when you look at other results you get a different idea:

OK, same idea, but much stronger difference. Are Ugandan kids really inspired by school science?

Are we to believe that African and Bangladeshi teenagers really think that famous scientists are super interesting?

And also soap?
Rather, what the results really show is that 15 year olds in those countries rate everything as interesting and important:

If you didn’t think hard about this bias, you might be fooled into thinking that sex differences in interests are not global. For instance, computers:

Or health:
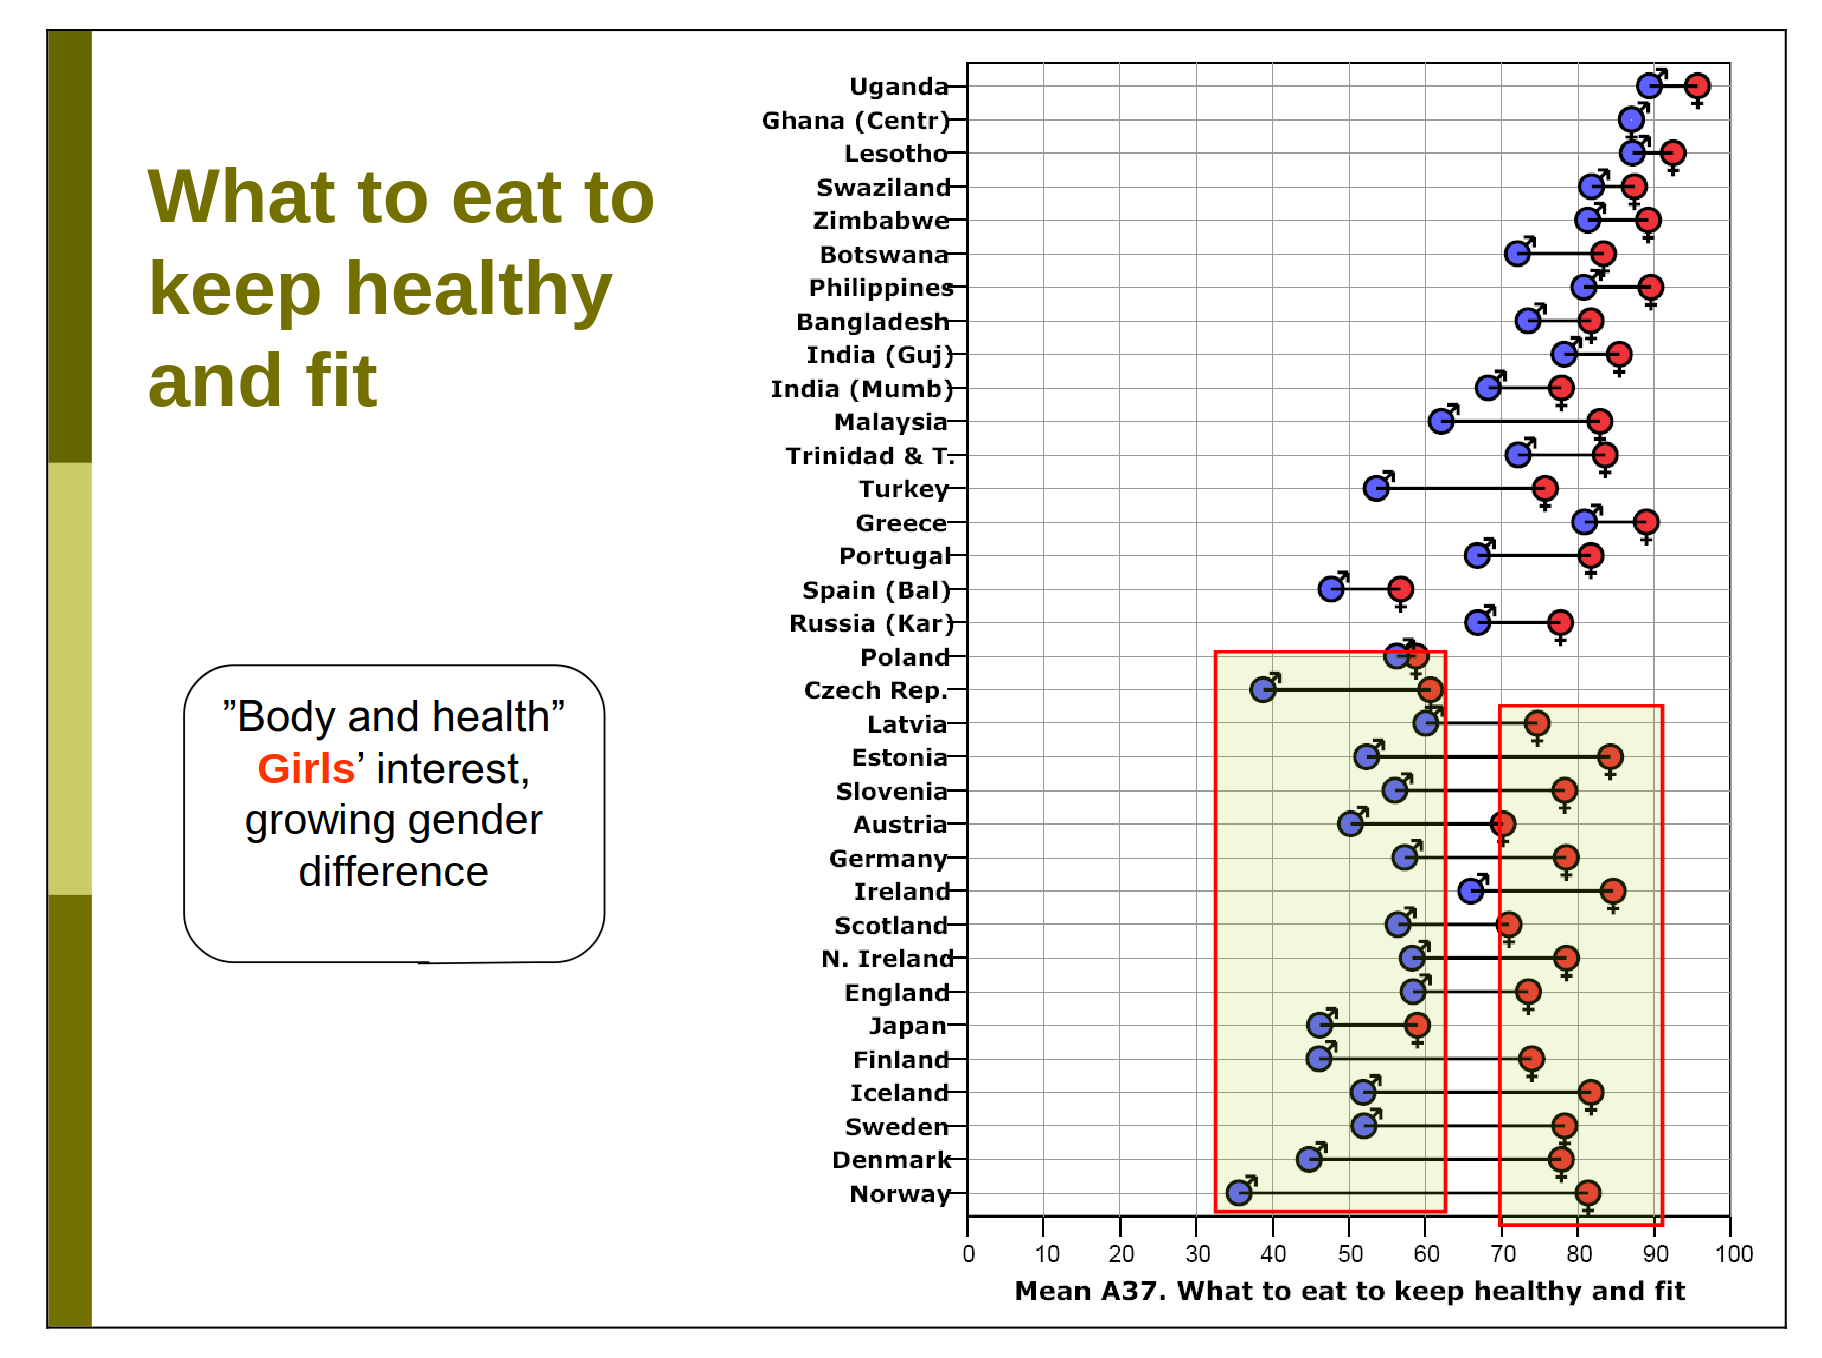
Which is not to say that sex differences aren’t necessarily larger in Nordic countries, but just that these data can’t be used to support this idea (see the gender equality paradox debate). If researchers had been mindful of the survey biases — agreement and extremity — they would have probably designed their survey in a different way. For instance, one could have asked students to rank order topics by order of interest. This reduces the data to rank-order format (not interval scale), but removes the biases.