During much of human history, it wasn’t known that diseases or traits ‘ran in families’. In fact, early mentions appear for instance in the 1700s:
The recurrence of specific signs in successive generations in a given family had been observed by naturalists and physicians long before Mendel’s time. Pierre Louis Moreau de Maupertuis; who under Frederick the Great was president of the Berlin Academy, published in 1752 the pedigree of a family in which isolated hexadactyly occurred in four generations. He also showed that this minor malformation could be transmitted to their children by either parent. But the mechanism of inheritance remained a mystery for doctors until 1900.
Such things were just vaguely ascribed to deus vult. Only much later with the recognition of Gregor Mendel’s work on peas did science really get started hunting down causes of disorders:
In 1902 Archibald E Garrod published an epidemiological study in The Lancet in which he proposed that alcaptonuria had a recessive mode of transmission that followed Gregor Mendel’s principles. With this milestone, the connection had been made between a human disease and the laws of inheritance published by Mendel in 1865. Since then our knowledge of genetically determined diseases has increased explosively. Victor McKusick’s catalogue Mendelian Inheritance in Man contains over 10 000 entries about monogenic signs and diseases. Mendel’s statistical discoveries, developed with green peas, which had such fundamental importance for biology, were made at a time when a lone researcher could discover laws of universal significance.
Figuring out the causation of rare genetic disorders with little or no environmental impact is a lot easier than figuring out the genetic causes of more common diseases that aren’t entirely due to genetic variation. Because of this, there is a sort of artificial split in how we think about genetic causation with regards to the former, the serious but rare disorders, and how we think of genetic causation of latter, the less serious but more common diseases without obvious genetic causation. I want to put these together in context in this post.
If you have been reading any genetics or social science in the last 10 years, you have probably heard of polygenic scores or PGS (or PGI if you are woke). Though in principle one could include all sorts of genetic variations in PGS, in fact in practice they only include SNPs (single letter variant/polymorphism) and a few shorter variants (insertion-deletions, indels). Why is that? It’s because of the data limitations. When scientists tried to find genetic causes of common (or normal) variation in many phenotypes (anything you can measure), they weren’t able to measure the entire human genome. So they began with what they could measure. At first, they came up with semi-plausible guesses, candidates, for variants that might matter for some phenotype, and then they measured those, and published 1000s of studies with bad statistics that didn’t really produce anything of value, and in the process wasting tons and tons of money and misled the public. If you aren’t familiar with this candidate genes failure, read Scott Alexander’s masterful review.
After scientists collectively stopped this malpractice, they began with a new approach. Technology had progressed to the point where one could measure the whole genome, sort of. One couldn’t really measure the whole genome, but one could measure a lot of variants spread out across the whole genome using micro-arrays. For technical reasons that we don’t need to discuss here, these arrays cannot measure all kinds of variants, but are good at measuring common (e.g., variants that occur at least 1% of the time) variants that are short (single letters or just a few letters). Now armed with growing datasets of 1000s or 10000s of people, they learned the statistical lesson from before and applied a proper false positive control control. Thus was born the ‘genome-wide association study’ method or GWAS. It’s a strange name because while one might think they fill a statistical (regression) model with all the genetic data at the same time, this isn’t generally feasible (without penalization), so what they did instead is fit a statistical model for each variant alone. So if you have 10,000 people in which you had measured 500k genetic variants, you would end up with 500k regression models. Based on these, you can plot the distribution of the p values and see if this deviates from chance (uniform distribution). If it does, you declare victory in the sense that you have proven that one can in theory predict this phenotype from genetics to more than 0 extent.
Making a prediction model out of these 500k regression models is a little more tricky. Since the genome has a structure, and due to how recombination works — random shuffling of genetic material between two chromosomes with the same number in the production of sex cells — variants that are close on the genome to each other will tend to be inherited together. Statistically speaking, then, they are very highly correlated. If I know you have a T at location 123, I can predict with 95% accuracy that you also have a G at location 124. Geneticists call this linkage disequilibrium or LD; you can think of it as genomic autocorrelation (similarity of things that are close in some kind of structure). The upshot of this is that when we find that position 123 variant T predicts being taller, then we will also find that position 124 G predicts the same. If we include both of these in our calculations of a person’s score, we will be double counting the signal. To deal with this, the scoring models are based on so-called independent variants, which just means that they have applied a pruning algorithm (LD pruning) that only keeps one variant for the purposes of prediction in a given genetic region (more complex methods exist of course). You might also want to only use variants whose signal is at least beyond some threshold of certainty, which is to say, you filter them by p value. After all of this, you end up with a reduced set of variants and you can now calculate a person’s score. You do it like this:
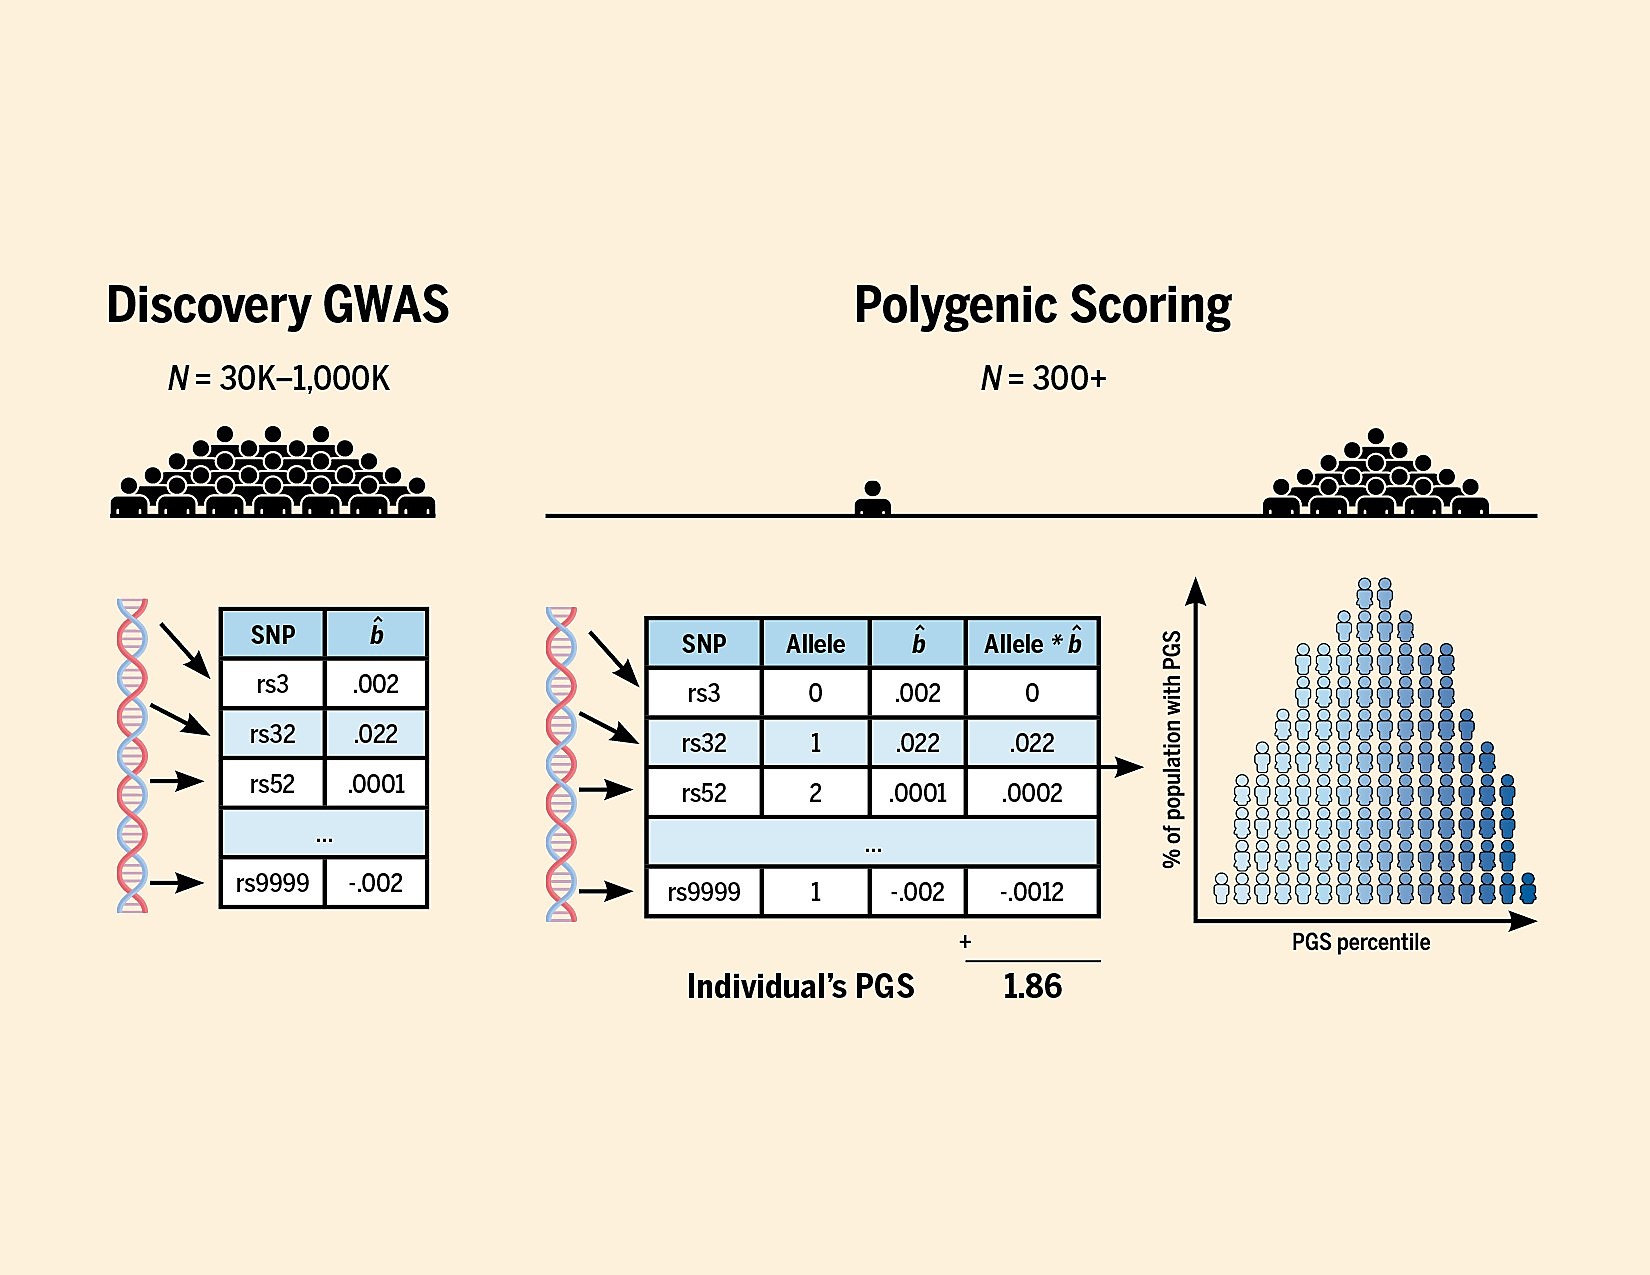
Mathematically speaking, the PGS is just a weighted sum (or mean) of the variants (we think) predict a given phenotype. It is hereby assumed that having 2 copies of a variant does twice as much as having 1 copy (linearity). It is also assumed that they don’t interact (they are additive), which is to say that the contribution of position 123 T is independent of position 456 A. E.g., having AA at position 456 doesn’t influence how we should think about the effect of having TT at position 123.
The upshot of this is that the PGS is really a very simple approach. We only count a certain kind of variant (short ones), and that can be measured with arrays, and which we included in the array (usually they don’t include all short common variants), and we assume we can just sum them up. Considering these limitations, it is amazing that one can get a plot like this one:
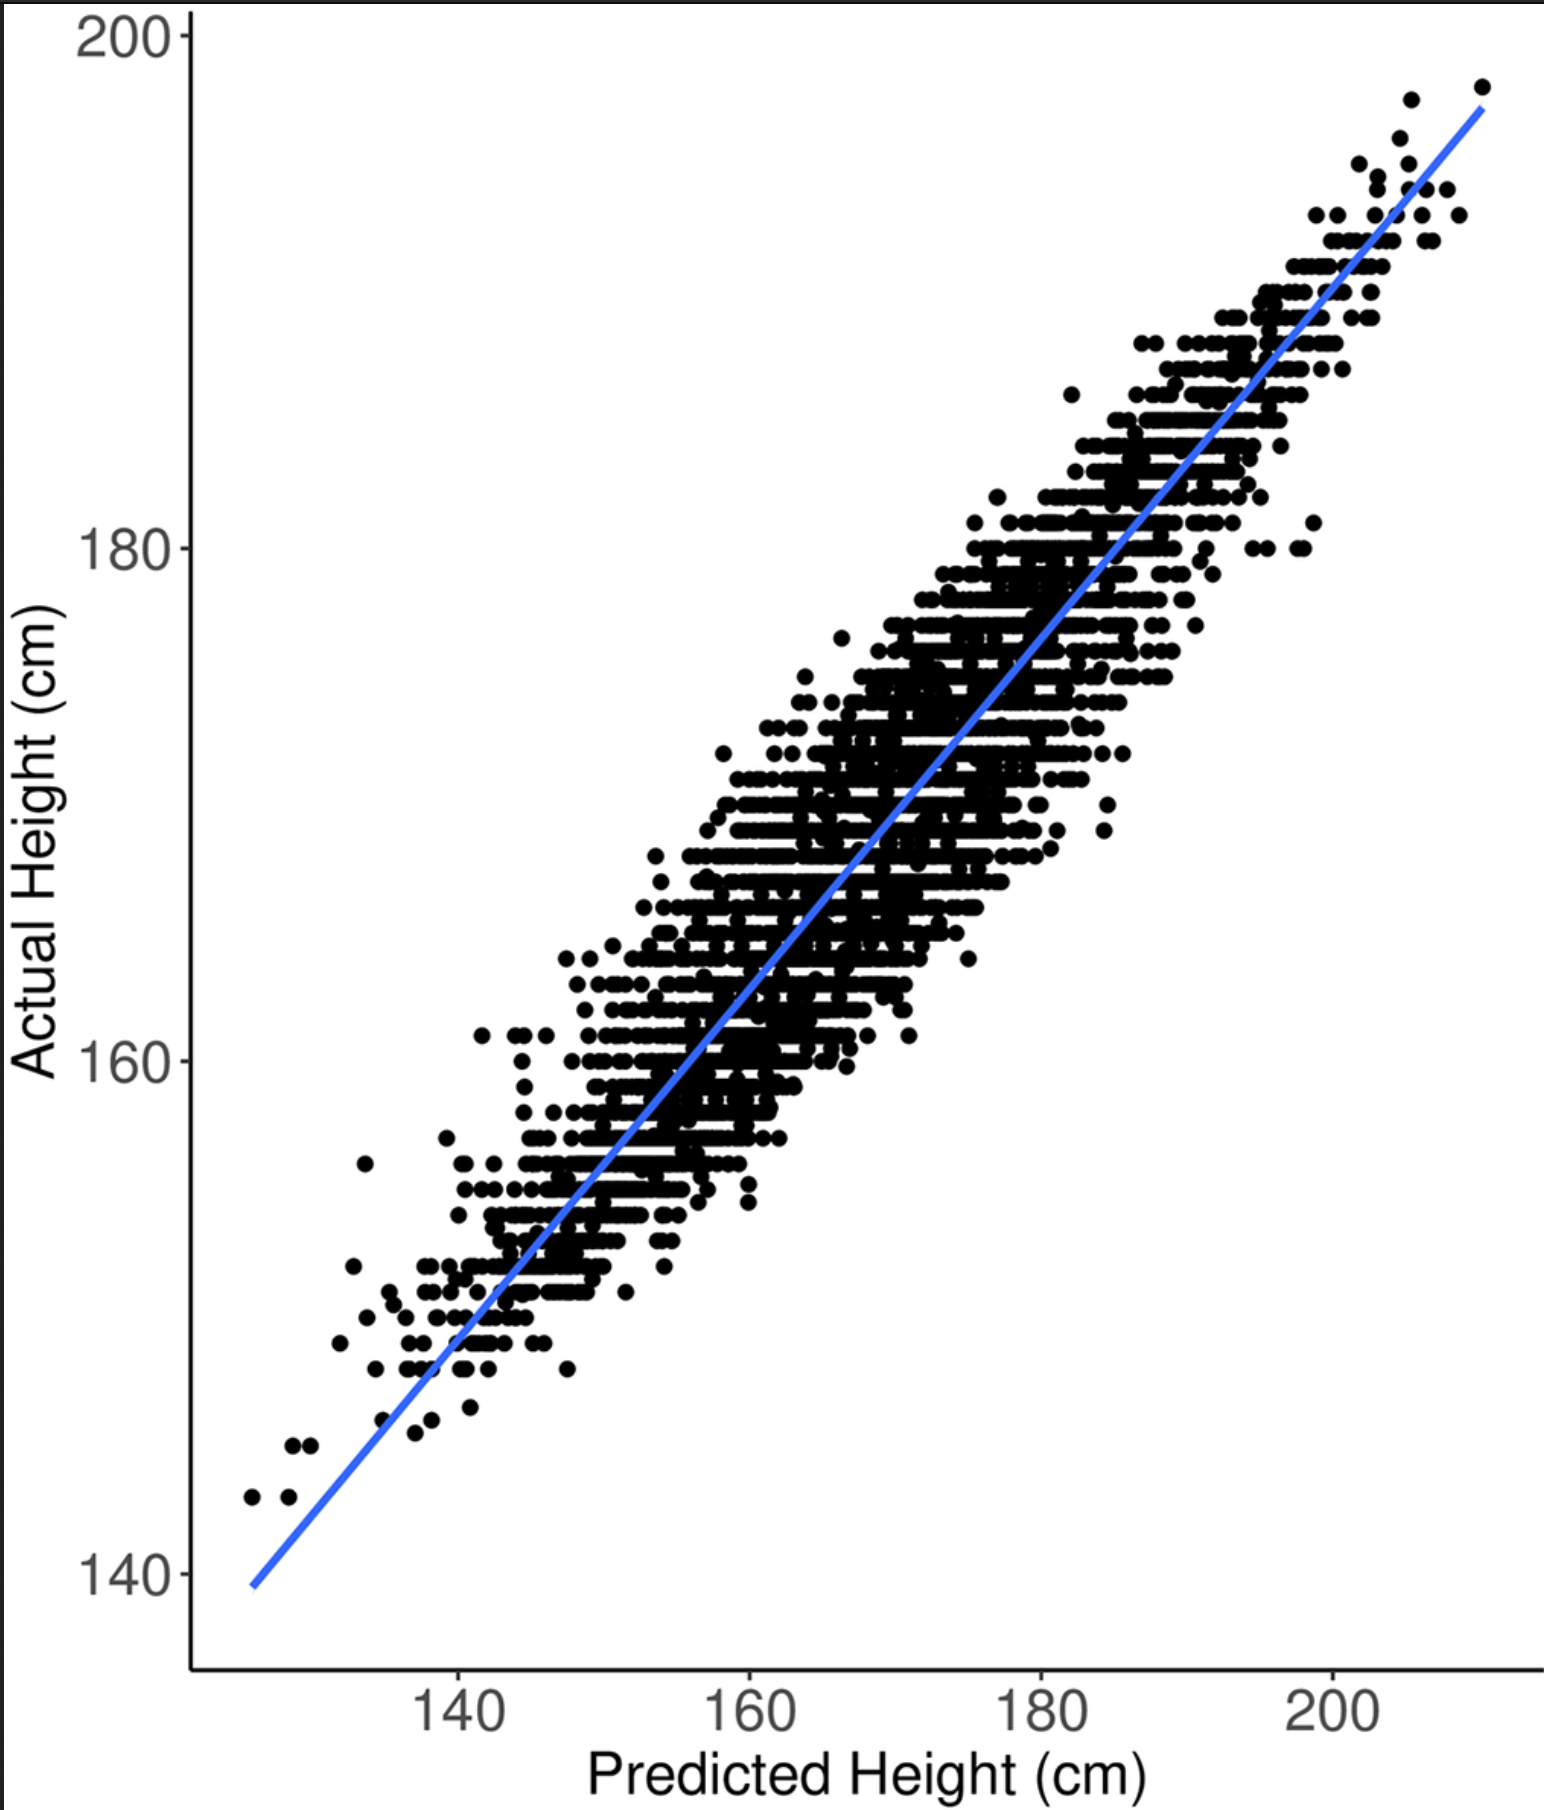
Nevertheless, we know that even if we had infinite sample size and perfect statistical models to capture all the signal in these common variants, they cannot explain all genetic height variation. We know that there are some rare variants with large effects that we are ignoring. If you have one (or two) of these variants, you might grow to be 250 cm tall (gigantism), or only 120 cm (dwarfism).

So, putting these ideas together, we can say that the PGS is only part of the whole picture of genetic causation, even if it does include non-linear and interactive effects. The full model must also include information about the rare variants. These rare variants could come in many forms. Some are single letters or short changes. However, others are larger changes. Here’s some examples:

These kinds of variations cannot generally be measured by arrays, and that’s why they haven’t generally been used in genetic studies (in GWASs).
But recall the plot above with height. There are some dots that are far away from the regression line. The deviation from the expected height for these people is explained by something more that the model doesn’t know about. It could be environmental. Improper nutrition leads to stunting, or maybe a renegade scientist is feeding his children growth hormones in order to make them basketball players. However, the causes could also be genetic. In this new study, researchers used this approach to look for such rare genetic causes in a big dataset:
- Kingdom, R., Beaumont, R. N., Wood, A. R., Weedon, M. N., & Wright, C. F. (2024). Genetic modifiers of rare variants in monogenic developmental disorder loci. Nature Genetics, 1-8.
Rare damaging variants in a large number of genes are known to cause monogenic developmental disorders (DDs) and have also been shown to cause milder subclinical phenotypes in population cohorts. Here, we show that carrying multiple (2−5) rare damaging variants across 599 dominant DD genes has an additive adverse effect on numerous cognitive and socioeconomic traits in UK Biobank, which can be partially counterbalanced by a higher educational attainment polygenic score (EA-PGS). Phenotypic deviators from expected EA-PGS could be partly explained by the enrichment or depletion of rare DD variants. Among carriers of rare DD variants, those with a DD-related clinical diagnosis had a substantially lower EA-PGS and more severe phenotype than those without a clinical diagnosis. Our results suggest that the overall burden of both rare and common variants can modify the expressivity of a phenotype, which may then influence whether an individual reaches the threshold for clinical disease.
They specifically looked at educational attainment, the favorite proxy measurement of intelligence (more difficult to measure, politically unpopular). In fact it has been done before for other phenotypes like breast cancer.
This study used sequencing (exome) data which is the other way to measure DNA variation. In this method, long strands of letters are read and the results are put together as a kind of overlapping puzzle. The result is that one can measure every kind of genetic variation that exists, though it might require expensive measurement (a lot of reads) to be sure about them. Using some methods for figuring out which kind of variant might be bad (deleterious), they were able to count how many such variants each person has and relate this to their phenotypes. And it works:

People with more bad variants had worse outcomes on different mental tests, were shorter, lived more in poverty, and also had more medical diagnoses (not shown above). But can this score just be simply combined with the PGS (common variants)? Yes:
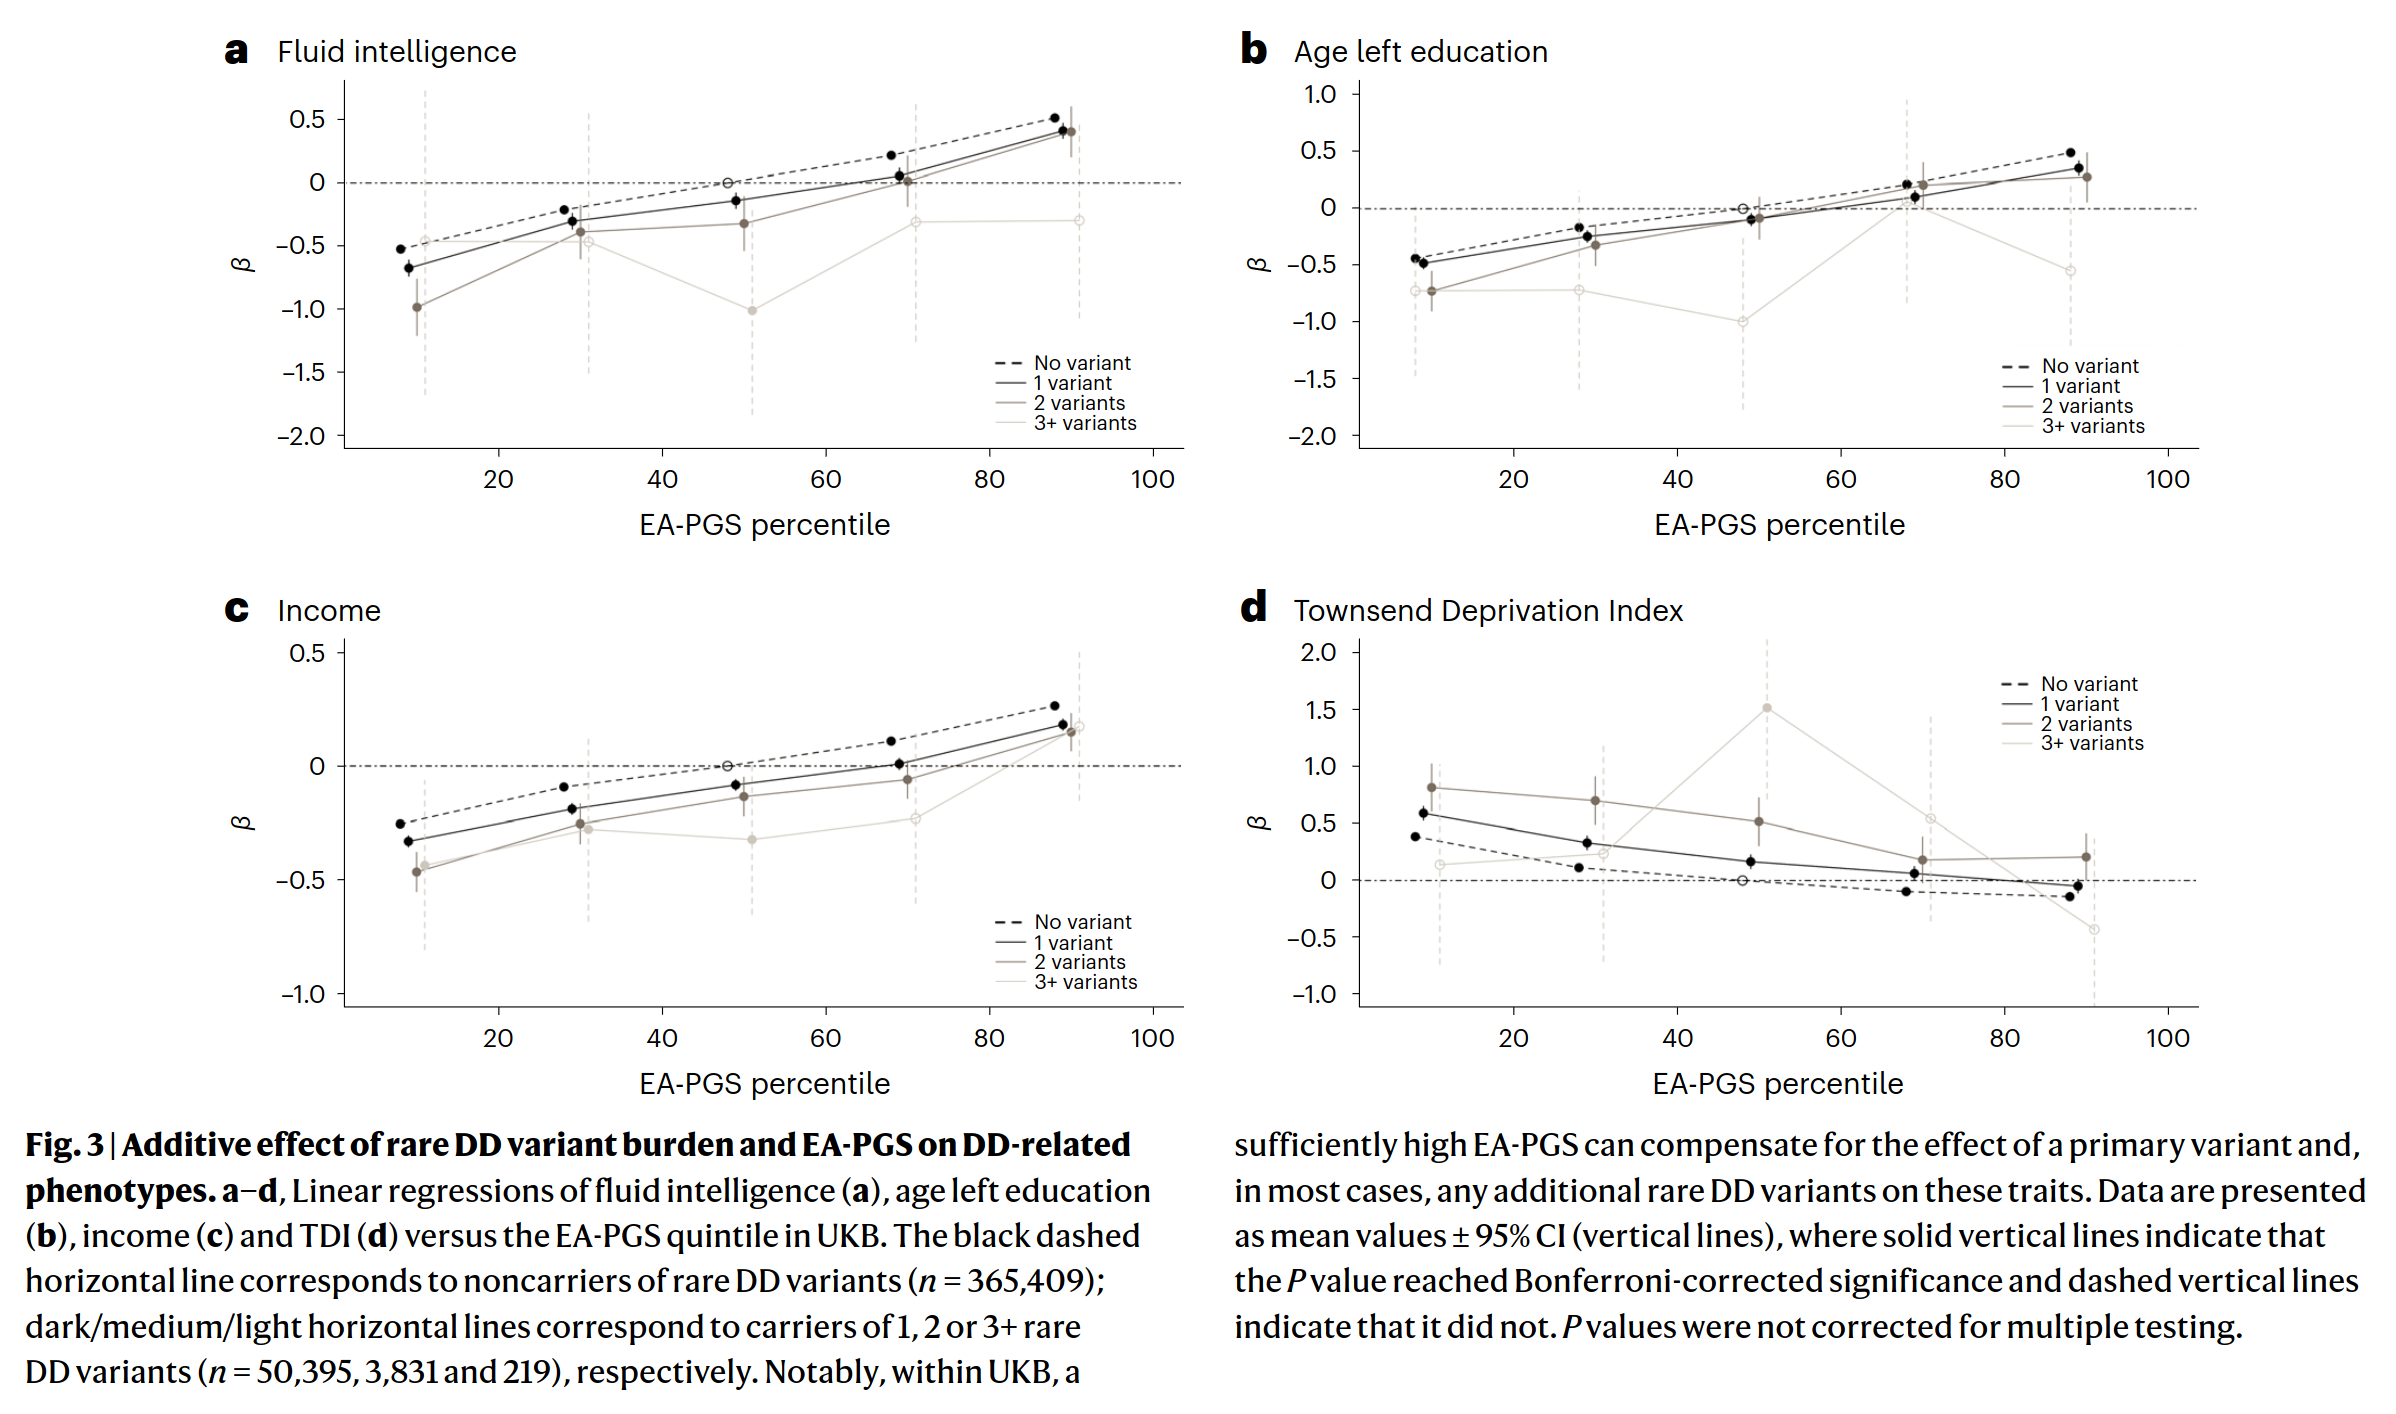
The influence of the rare, bad variants seems to be something you can just add to the influence of the many (thousands) of common variants.
Conceptually then, we shouldn’t really be thinking so simply about the “polygenic score”. One could think of polygenic scores based on different kinds of variants: simple and common, simple and rare, complex and common (not many of these), or complex and rare (many many of these). The way one breaks it down is arbitrary, but to calculate the full genetic expectation — the genetic potential — of a person, one needs to include every kind of variant in the model:
Genetic potential = full PGS = PGS(simple, common) + PGS(simple, rare) + PGS(complex, common) + PGS(complex, rare) + complexity
There are further complications if we think about interactions. Maybe having that T at position 123 interacts with rare variant G on position 126, so they must be taken into account. In the above, I’ve included this in the complexity term.
Finally, it is worth repeating that the models we are building are based on limited sample sizes, and because of this, all the scores we are calculating are really just estimates of their target values (estimand). So when someone calculates their ‘height PGS’ as commonly done, really, it is an estimate of the total linear, additive effect of common genetic variants we have measured or imputed (filled in). A person’s true full height PGS is more complicated to calculate and we don’t yet know how to add everything in. However, given that many large datasets are beginning to collect deep sequencing data, the addition of the other parts of the model above are becoming possible. In the next 10 years, we will see a lot of studies like the above. It will be routine to include the different kinds of variations in the same score because what we are trying to do is to estimate a given person’s genetic potential for a given phenotype, all things considered.