I keep getting asked about this, so I figure a short note is in order. Some months ago, Commie Kevin (Twitter) AKA. Kevin Bird published an anti-hereditarian study:
- Bird, K. A. (2021). No support for the hereditarian hypothesis of the Black–White achievement gap using polygenic scores and tests for divergent selection. American Journal of Physical Anthropology.
Objectives
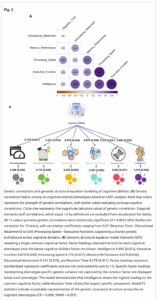
Debate about the cause of IQ score gaps between Black and White populations has persisted within genetics, anthropology, and psychology. Recently, authors claimed polygenic scores provide evidence that a significant portion of differences in cognitive performance between Black and White populations are caused by genetic differences due to natural selection, the “hereditarian hypothesis.” This study aims to show conceptual and methodological flaws of past studies supporting the hereditarian hypothesis.Materials and methods
Polygenic scores for educational attainment were constructed for African and European samples of the 1000 Genomes Project. Evidence for selection was evaluated using an excess variance test. Education associated variants were further evaluated for signals of selection by testing for excess genetic differentiation (Fst). Expected mean difference in IQ for populations was calculated under a neutral evolutionary scenario and contrasted to hereditarian claims.Results
Tests for selection using polygenic scores failed to find evidence of natural selection when the less biased within-family GWAS effect sizes were used. Tests for selection using Fst values did not find evidence of natural selection. Expected mean difference in IQ was substantially smaller than postulated by hereditarians, even under unrealistic assumptions that overestimate genetic contribution.Conclusion
Given these results, hereditarian claims are not supported in the least. Cognitive performance does not appear to have been under diversifying selection in Europeans and Africans. In the absence of diversifying selection, the best case estimate for genetic contributions to group differences in cognitive performance is substantially smaller than hereditarians claim and is consistent with genetic differences contributing little to the Black–White gap.
(John Fuerst already has some comments on this over at Human Varieties, but here’s mine.)
So far so good. His method consists of:
I sought to test for divergent polygenic selection using an method similar to that employed by Berg and Coop (2014), which should have high power to detect polygenic selection with a low false-positive rate, provided GWAS effect sizes are free from systematic biases (Berg & Harpak, 2019). The squared difference of polygenic scores computed from the 685 reported genome-wide significant GWAS with between-family effect sizes from Lee et al. (2018) was 0.068 (raw difference of −0.261), with the African PGS equal to −0.99, and the European PGS equal to 0.161. I observed only one random polygenic score that exceeded this observed squared difference (Figure 2a). When within-family effect sizes were used, the squared difference in PGS was attenuated nearly 95% to 0.0027 (raw difference of −0.052). When compared with the empirical null distribution, 43.2% of randomly generated polygenic scores had greater than or equal squared polygenic score differences, yielding a nonsignificant empirical p-value of 0.432 (Figure 2b).
So he did a null test comparison using the between family GWAS hits from Lee et al 2018 (EA3) and the unreported sibling results (which one can download here). As he himself noted, the sibling ones were not very congruent with the between family ones, being only same-direction of effect some 65% of the time even when applying a p value filter. Bird nonetheless thinks these have high power for his analysis, an assumption that is hard to understand. His results:
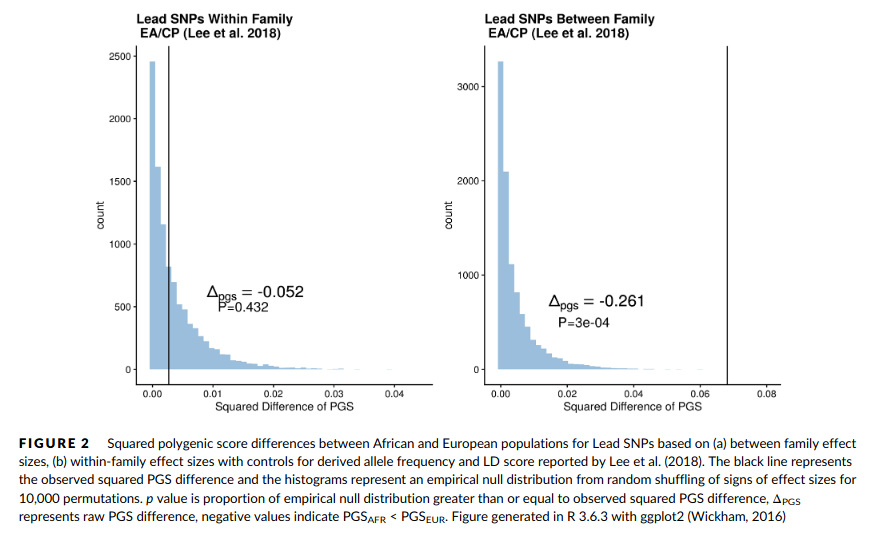
The right side replicates Davide Piffer’s (2021) randomization tests for differentiation. The left side plot shows that group differences on the sibling GWAS polygenic scores are not beyond what one would expect by chance. Surely, not a surprise considering these polygenic scores don’t predict much at all! Actually, here Bird used an older test of divergent selection (Berg and Coop 2014), while Piffer used Fst’s as done by Guo et al 2018. Bird also used the Fst approach but was somehow unable to find a larger than null differentiation, which Piffer did find. I guess we will have to look at his code to see what went wrong there, I can’t immediately see an issue from his description. I’ve also run the Fst randomization test before and found it was far beyond chance levels, even with older GWASs. I guess we need to publish the code for these tests, so 3rd parties can evaluate.
Strange also is the reliance on Guo et al 2018. The reader might recall that this paper actually found evidence for natural selection for educational attainment (proxy for intelligence), despite using an older GWAS (EA2, 328 snps vs. 1200+ in Lee et al/EA3). But Bird says instead “Additionally, the results presented here build upon the failure of Guo et al. (2018) to find significant genetic differentiation of a different set of education-associated SNPs compared with control SNPs” Guo’s tables:
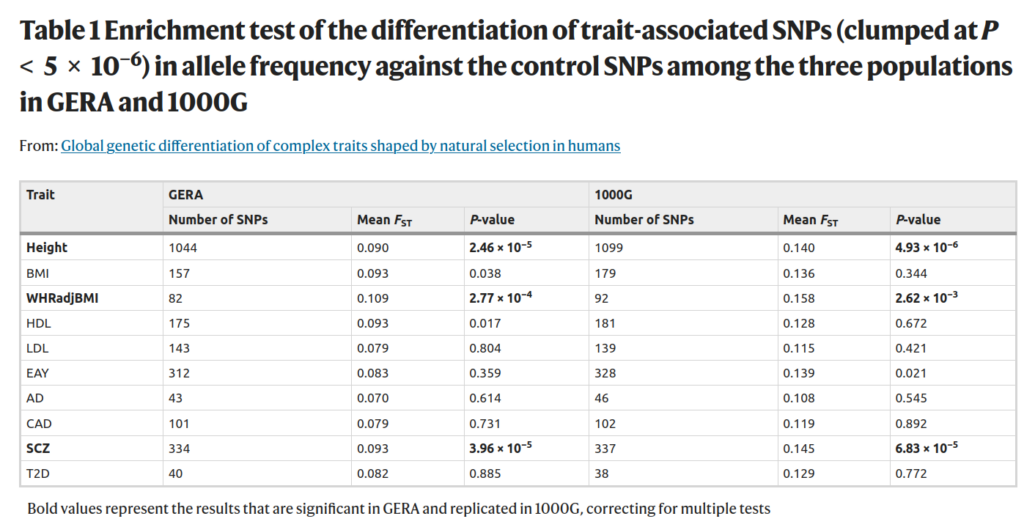
A marginal hit in the larger sample for EAY (educational attainment years), p = .021, not impressive but it was there. It’s not bold because it did not survive multiple testing adjustment.

Very low p values for EAY this time, in both datasets. This second test is for different LD patterns, which one might take as an alternative metric of evolutionary pressure of some sort, which differs by these populations.
Returning to the sibling GWAS, it is curious that Bird chose this approach. Just a few years ago, researchers (Sohail et al 2018; Berg et al 2018) were warning us that residual population stratification had resulted in overestimates or even false positives of divergent selection for human height. Probably no one really believes human height is not actually different by group, so this presents a positive control case. Later when someone did a more powerful sibling GWAS for height, the conclusion was reversed back so that signal of divergent selection was again visible (Howe et al 2021):
We found strong evidence for polygenic adaptation on taller height in the European meta-analysis GWAS using both population (r = 0.020, 95% C.I. [0.011, 0.029]) and within-sibship GWAS estimates (r = 0.011, [0.003, 0.020]) (Supplementary Figures 4/5). These results were supported by several sensitivity analyses; a) evidence of enrichment for positive tSDS (mean = 0.23, SE = 0.06, P < 0.001) amongst 416 putative height loci from the within-sibship meta-analysis data (Supplementary Figure 6), b) positive LDSC rg between height and tSDS in the meta-analysis data (Supplementary Table 7) and c) evidence for polygenic adaptation on taller height when meta-analysing correlation estimates from 7 individual studies (e.g. SDS using only UK Biobank GWAS summary data) for population (r = 0.013, [0.010, 0.015]) and within-sibship (r = 0.004, [0.002, 0.007]) estimates (Figure 5). There was also some putative within-sibship evidence for polygenic adaptation on increased number of children (P = 0.006) and lower HDL-cholesterol (P = 0.024) (Supplementary Figure 4).
So as the sibling GWAS for intelligence/EA gets bigger and better, I expect the stratification tests will get p < .05 again.
To conclude my reading of this study:
- Bird relies on the sibling-GWAS for EA from Lee et al 2018 (EA3). That this produced null results is not surprising since it has very low signal to noise ratio. Bird somehow ignores this power issue.
- Bird’s Fst variation test for Lee et al 2018 between family hits is at odds with results from other researchers. Maybe someone has a coding error or different QC steps.
- Bird cites prior paper for methods (Guo et al 2018) but somehow does not inform the reader that this study actually produced evidence of divergent selection for educational attainment.
- Hereditarians can confidently predict that future, larger sibling GWASs will result in hits for these polygenic selection tests.
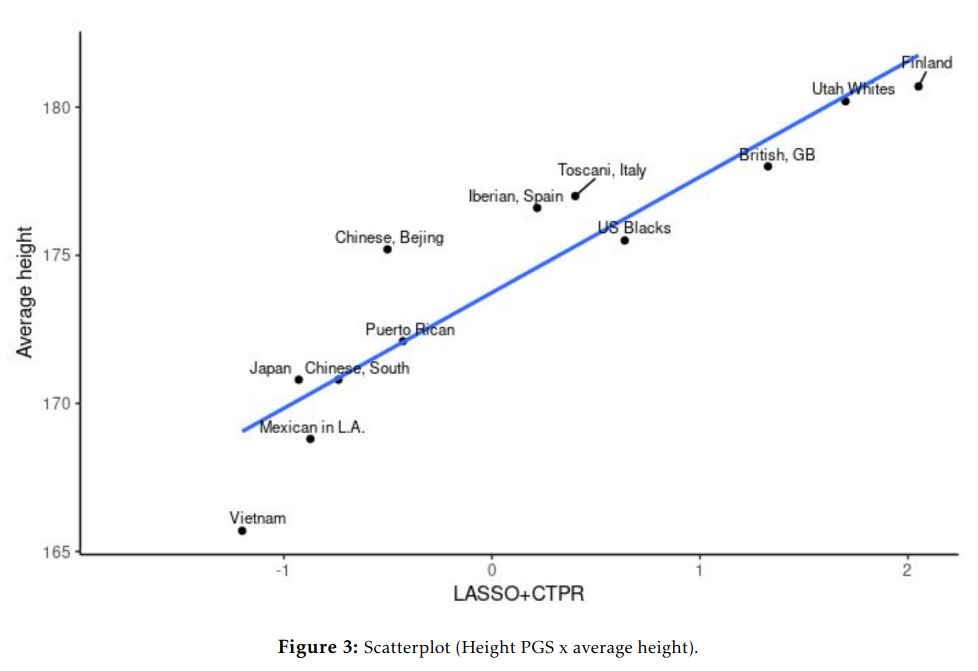
One more thing is that we don’t need to rely on these phenotype agnostic tests for divergent selection. We already have good ideas about the actual phenotypes of many populations, and so we can obviously correlate these with averages of polygenic scores. The p value from this ordinary correlation is itself a weak test against the null of neutral selection/drift. A recently test looks like this (Piffer 2021):
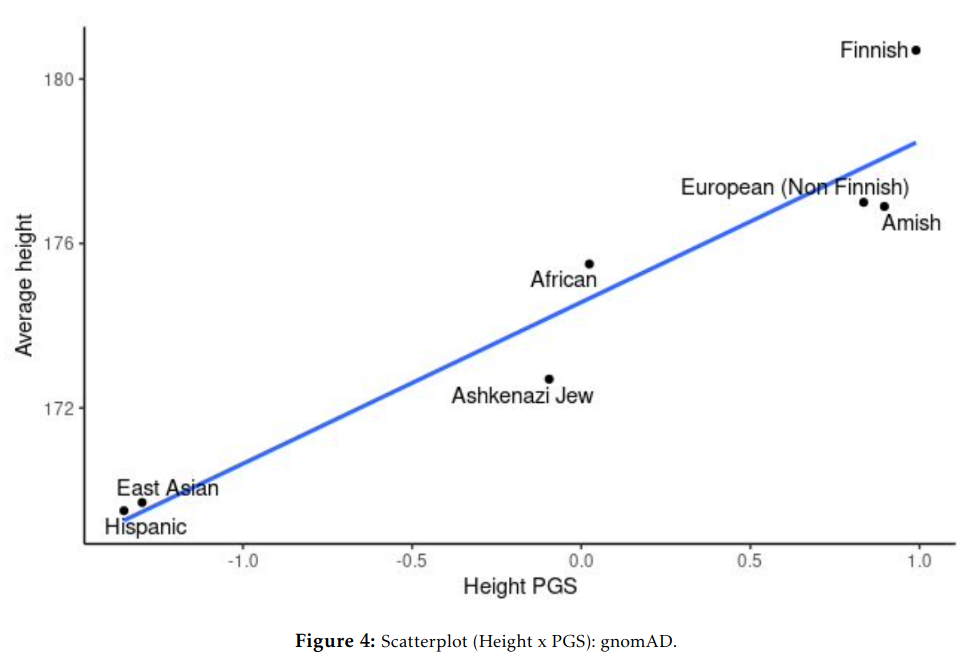
For height:
And second dataset:
And for education/IQ:

And second dataset:

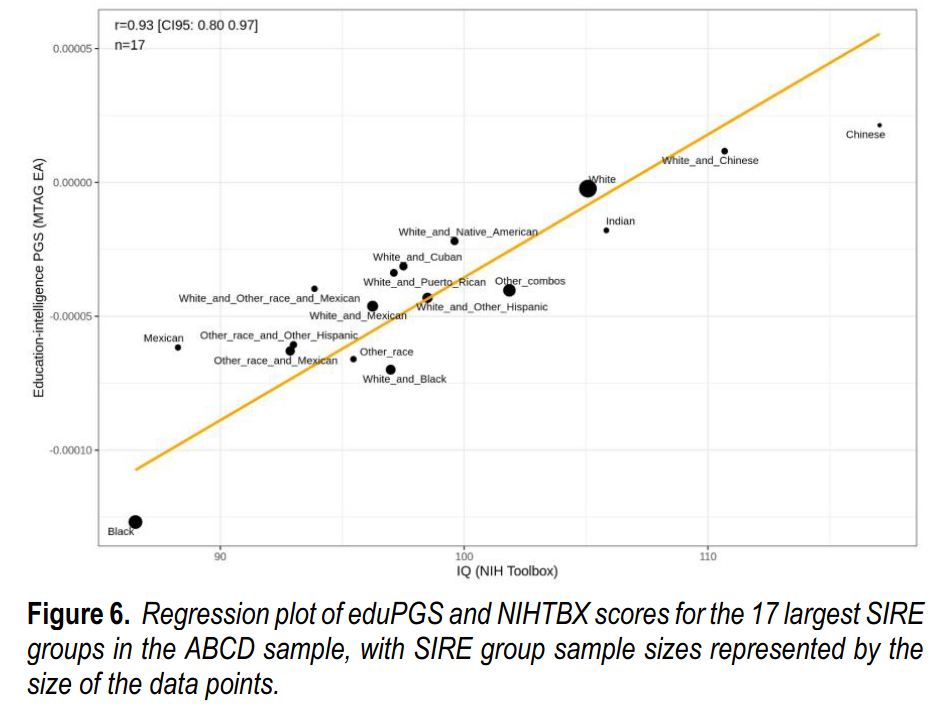
These correlations are somewhat of a mystery for those who think there is no divergent selection. If the polygenic scores are so bad etc., then why do they keep matching up so close to perfection with real values — both for human height and intelligence? These results have replicated since 2013, since the first GWAS for education in fact. If one thinks this can be ignored by attacking national IQs, one is sorely mistaken, because as Fuerst et al 2021 showed, these patterns hold for groups of children who are all raised in the USA, all the same age, all speak Native English, and all took the same test at the same time (ABCD dataset):
Why is it a weak test? Because of genetic relationships between populations, the genetic data are high autocorrelated, and thus the actual independent datapoints is not say 17, but some lower value. For this reason, using random polygenic scores to do a randomization test is a better idea than using the NHST analytic p values. That aside, hereditarians will make a confident prediction:
- Whatever future GWASs that come out will also show strong positive correlations between average phenotype values and average polygenic scores. This is true both for the between and sibling GWASs.
Since EA4 and the sibling GWAS consortium (Howe et al 2021) studies are coming out soon (and their summary statistics), we will see whether these predictions will be vindicated. Sibling models are more interesting as these remove most of the ancestry confounding since siblings have the same expected ancestry and the correlation between traits for siblings and ancestry will be ~0. The question is mainly how soon we will see well-powered sibling studies for intelligence or education. It seems the sample sizes here are for individuals, not pairs, so the height one is based on some ~64k sibling pairs, and the EA one on about 54k pairs. The intelligence one, the most relevant, is only at 13k pairs, so it is very low signal. The first proper EA GWAS had 227k persons (Rietveld et al 2013), so this one with 54k pairs is rather too small for this trait. Still, maybe it will still be enough when analyzed at the group level. A polygenic score can be conceived of a score consisting of a random normal noise element, and a signal, which together results in the score we estimate. When the accuracy of a given score is very low, each person will only contribute a small amount of signal. However, if one averages scores from say 200 persons for some group, the group mean true score (signal) should still be somewhat reliable. The details remain to be further studied. Kevin of course is not helping out much with the science. He’s busy harassing researchers in the field by sending threatening letters to their universities. In other words, typical communist tactics.