Last year, this study was published:
- Brandt, V., Zhang, Y., Carr, H., Golm, D., Correll, C. U., Arrondo, G., … & Cortese, S. (2023). First evidence of a general disease (“d”) factor, a common factor underlying physical and mental illness. World Psychiatry, 22(2), 335.
The authors point out that recent thinking in psychiatry have focused on the factor structure of mental illness (nosology), and the almost ‘positive manifold’ — almost all diagnoses show positive correlations (if you have X you are more likely to have Y, no matter what X and Y are as long as they are psychiatric diagnoses). One interpretation of this is that there is a general factor of mental illness, called the p factor, for general psychopathology, by analogy with the g factor for general intelligence. The existence of the positive manifold is not seriously questioned, though the causal interpretation of it is. The basic causal interpretation of a factor model is that unobserved (latent) variables cause variation in various observed (manifest) variables and that’s why they are correlated. Thus, it is a causal model. However, we don’t have to accept such a simple causal model to accept the use of a general factor as a kind of overall index of mental illness. We could accept that mental illness variation is caused by multiple correlated unobserved factors, or are a causal network, or something more exotic, but still accept that we can make an overall index of these by adding them up as a weighted sum. This overall index may be useful for prediction purposes, or might not, depending on what one is trying to predict. Alternatively, it could serve as a good summary measure for evaluating interventions (“Does giving your girlfriends sour gummies improve mental health in general?”).
The new part of this study is that the authors remind readers that there are also positive correlations between mental disorders and physical disorders too. They are rather weak, but they can be reliably found in large datasets. Following the same reasoning as above, then, one can posit an even more general causal factor of all or most disease, the d factor, general factor of disease. They show using an old British dataset how this could be modeled:
We found that the bifactor model fitted the data best (CFI=0.98, TLI=0.98, RMSEA=0.016). All physical and mental conditions loaded positively onto a common disease factor, with the highest factor loadings for chronic fatigue syndrome (0.71±0.04), heart problems (0.66±0.04), irritable bowel syndrome (0.57±0.03), ulcer (0.56±0.06), and obsessive-compulsive disorder (0.53±0.03). The majority (15/22) of physical conditions loaded significantly on a “physical factor”, apart from cancer, chronic fatigue syndrome, ulcers, gallstones or kidney stones, vision impairments, and seizures. Cardio-metabolic variables (obesity, diabetes, hypertension, heart problems) loaded negatively onto the physical conditions factor. Mental conditions loaded highly positively onto a psychopathology (“p”) factor (see supplementary information).
Therefore, we found that the data were best explained by a bifactor model with a mental conditions factor, a physical conditions factor, and an additional underlying disease dimension, reflecting a general vulnerability to develop any of the included conditions. Therefore, our results support the assumption of the existence of a general “d” factor in adults.
Although our study does not test underlying mechanisms, several suggestions can be made based on existing literature. First, it is likely that a range of physical and mental conditions share common genetic polymorphisms that generate a vulnerability towards developing a wide range of diseases3. Other possible mechanisms include common lifestyle and socioeconomic factors. For instance, smoking, high alcohol consumptions, disrupted sleep, and lack of exercise are associated with increased cardio-metabolic risk. Unhealthy lifestyle is also associated with immune system dysfunction, which in turn is related to a variety of physical and mental conditions.
Their paper is 2-3 pages long, without any figures, but you get the idea. Their supplement lists their factor solution’s loadings:
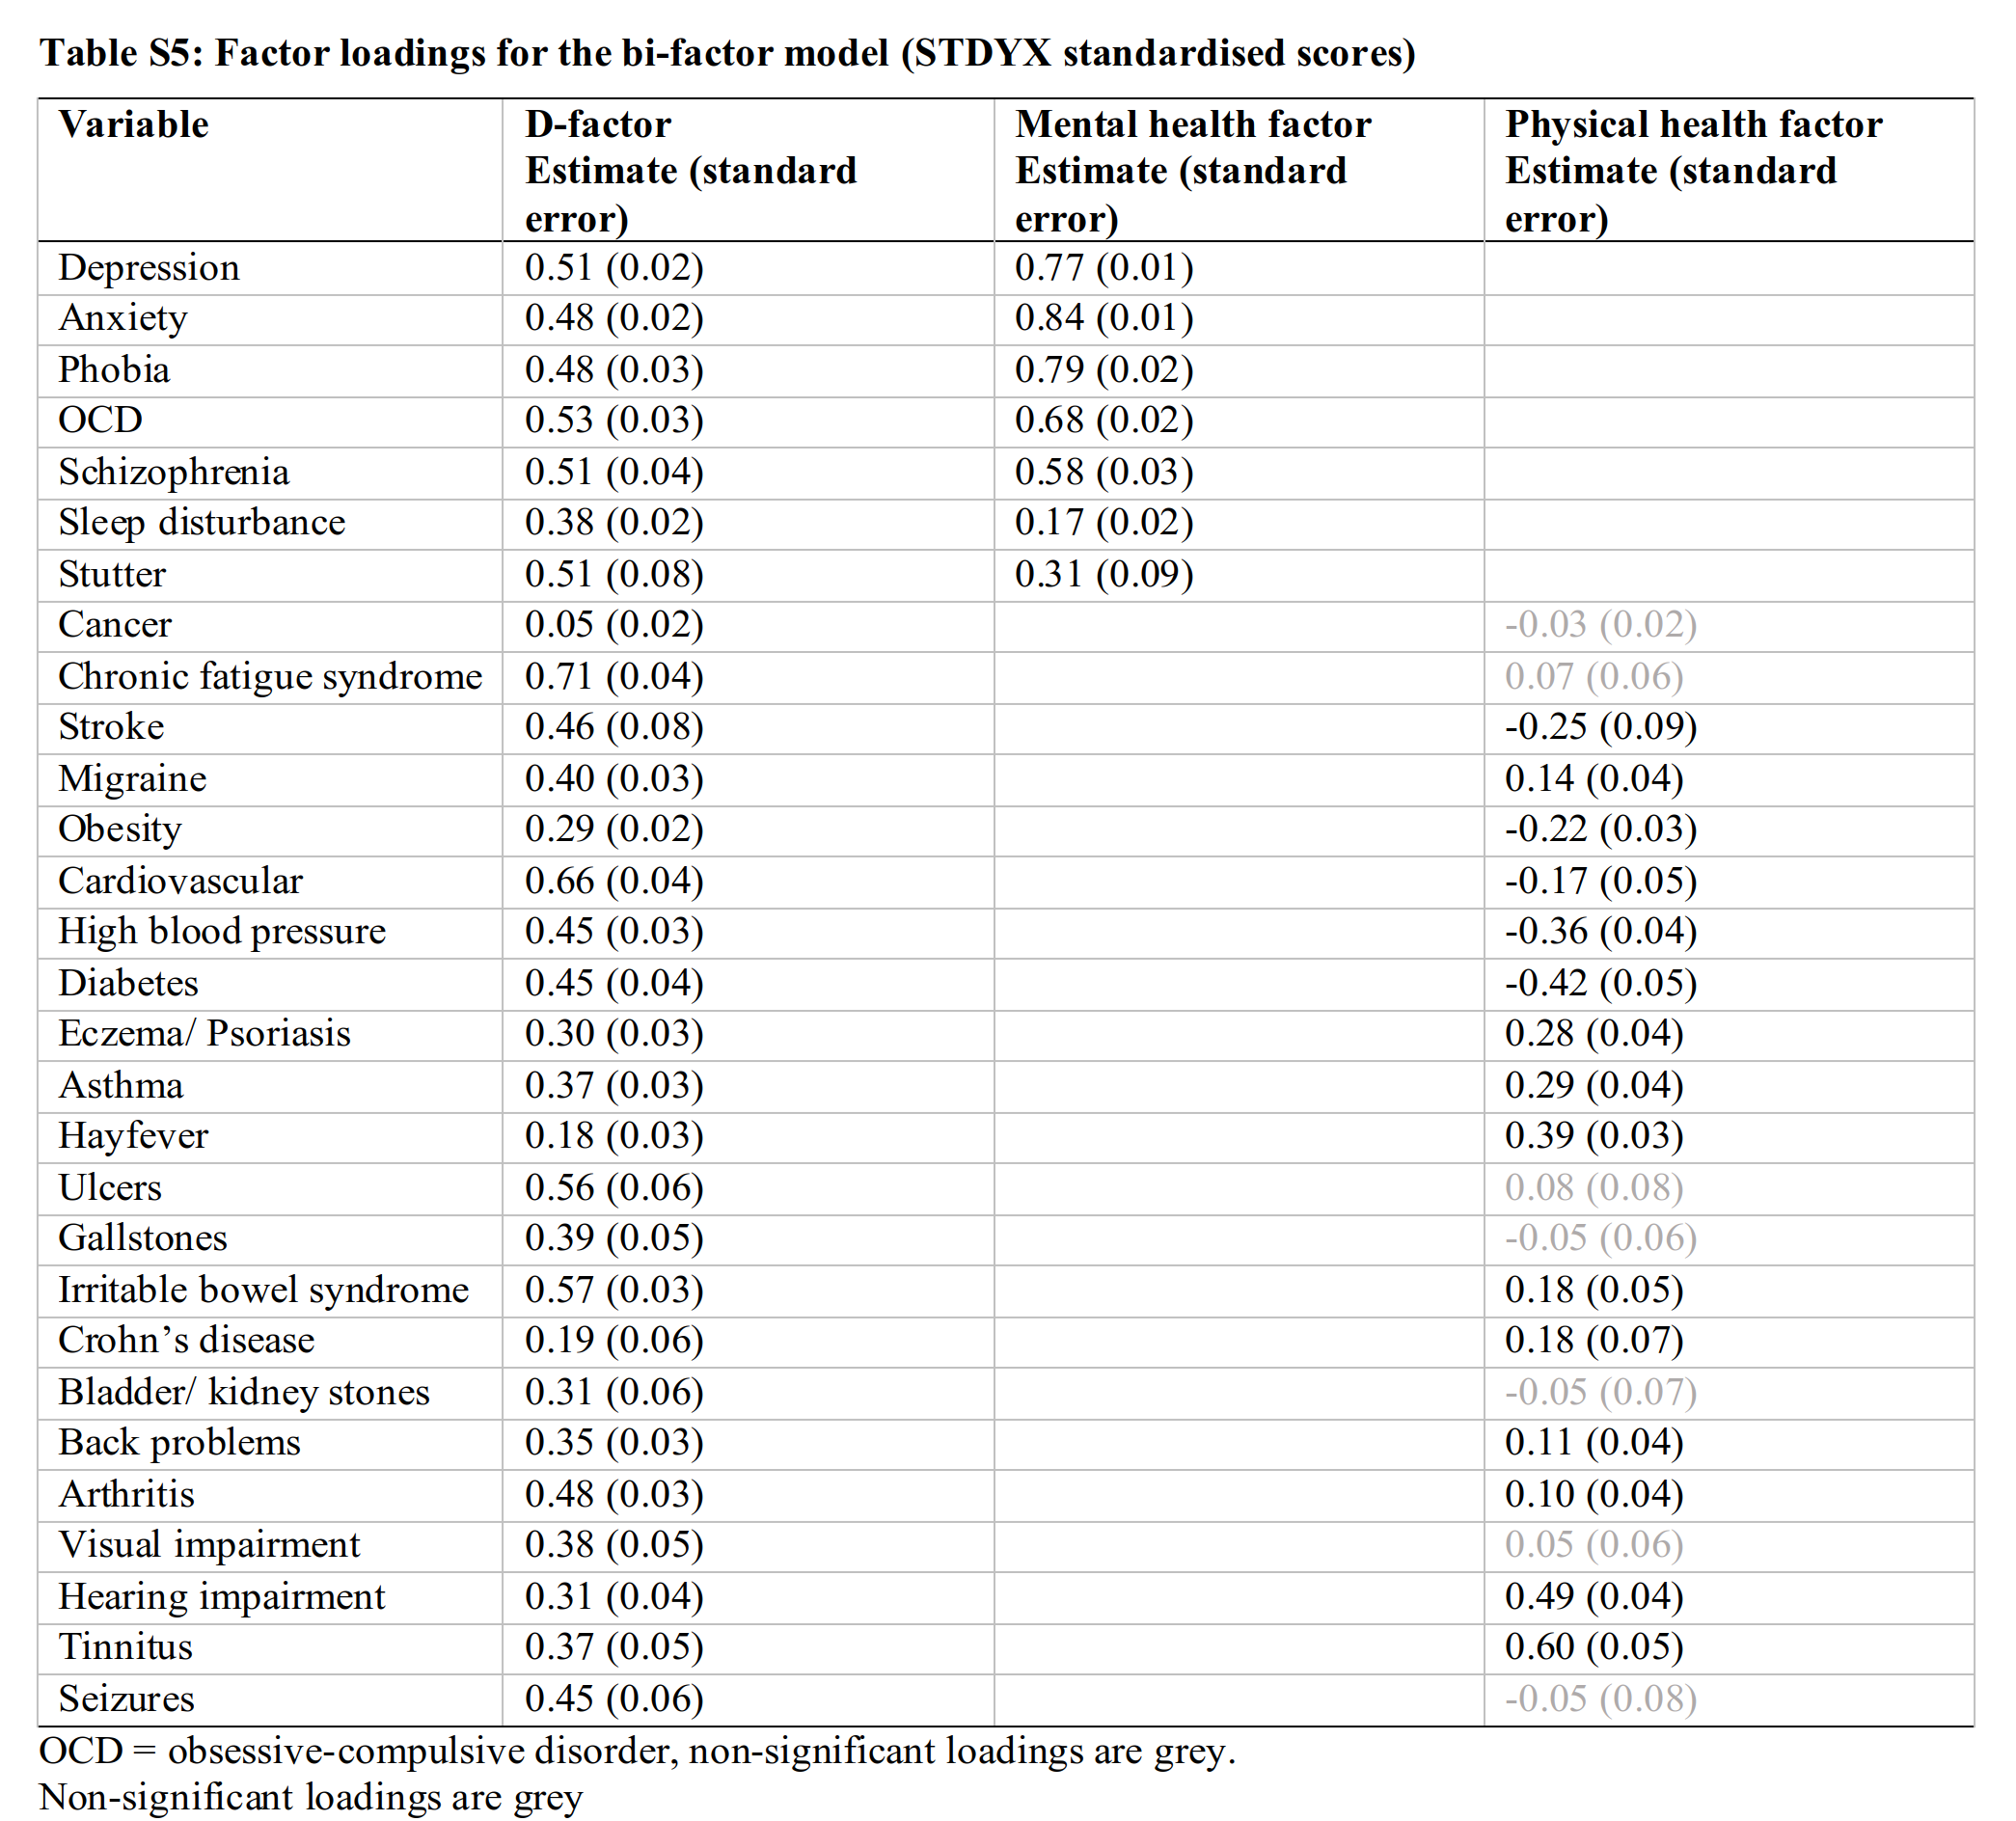
Using these numbers, one can theoretically derive the expected correlation between two disorders. For instance, depression and diabetes have loadings of 0.51 and 0.45, and they don’t share any other factors, so their correlation should be about 0.51 * 0.45 = 0.23. The fact that their physical factor has many weak and negative loadings suggest this model is not quite right, but perhaps a useful start.
From a theoretical perspective, this general factor of disease could be interpreted as the manifestation of the elusive mutational load. There are 100,000s of genetic variants that contribute to human variation across traits. In general, evolutionary pressure from (early life) mortality will result in the alleles associated with disease becoming less common. However, in recent times — since about 1850 in England — mortality rates began to drop and this evolutionary pressure towards healthy genetics was weakened. Due to the constant influx of new mutations and random variation (drift) over generations, the lack of evolutionary pressure towards healthy genetics will result in an increase in poor genetics for health, or mutational load. In general, no rigorous quantification of this has been offered to my knowledge, though one could attempt to score an overall index from existing GWASs of common diseases and Clinvar’s database of rare variants for severe genetic disorders. Such an index would be a useful target for embryo selection.
Arch-methodologist and network psychometrics fan Eiko Fried have already written a reply to this study attacking it on two grounds. First, the authors used model fit statistics to show that the bifactor model (with a general disease factor) fits better than the other options. However, it is actually known that these model fit statistics are biased in favor of the bifactor model, so this unfortunately doesn’t actually show anything.
Second, given such a dataset (a correlation matrix of 29 diagnoses), there’s million of possible statistical models one could fit. A large number of these would be statistically equivalent given the precision of the study. Thus, the study is inconclusive regarding which of these models “fits better”. As Eiko explains:
First, there are hundreds of models that represent hundreds of different causal processes, but the authors didn’t fit those hundreds of models to their data: they only fit three. This makes it difficult to conclude that they really found support for their particular theory. For example, one could have the theory that …
- … having depression makes one more vulnerable to developing an anxiety disorder
- … having a physical health problem such a chronically weak immune system makes one more vulnerable to develop other physical health problems due to this weak immune system
- … the comorbidity of physical and mental health problems, such as between cancer and depression, is not explained by some underlying disease factor, but that the relation comes from the fact that people with cancer are more likely to develop depression.
The suggestions are plausible. Getting cancer sucks! It wouldn’t be surprising at all if there was a causal path from cancer to depression (much research about this). We also know that many other diseases cluster since they relate to the same biological systems, e.g. autoimmune disorders. This would mean that one should have a group factor for these in the model. One would have to start with a much larger collection of diagnoses to do the modeling. I think one should begin with Nordic register data for the best statistical precision.
Taken together then, we can say that this study didn’t really prove there is a general factor of disease as a singular causal entity of sorts, though it does suggest that one can compute an overall index in a sensible manner (assuming the loadings would be stable, which is a big assumption given the prior work on the p factor!). The results are thus congruent with mutational load theory, but not strong evidence for it.
Edited to add
There is a replication of this approach in a smaller sample (n = 1120) of adolescents:
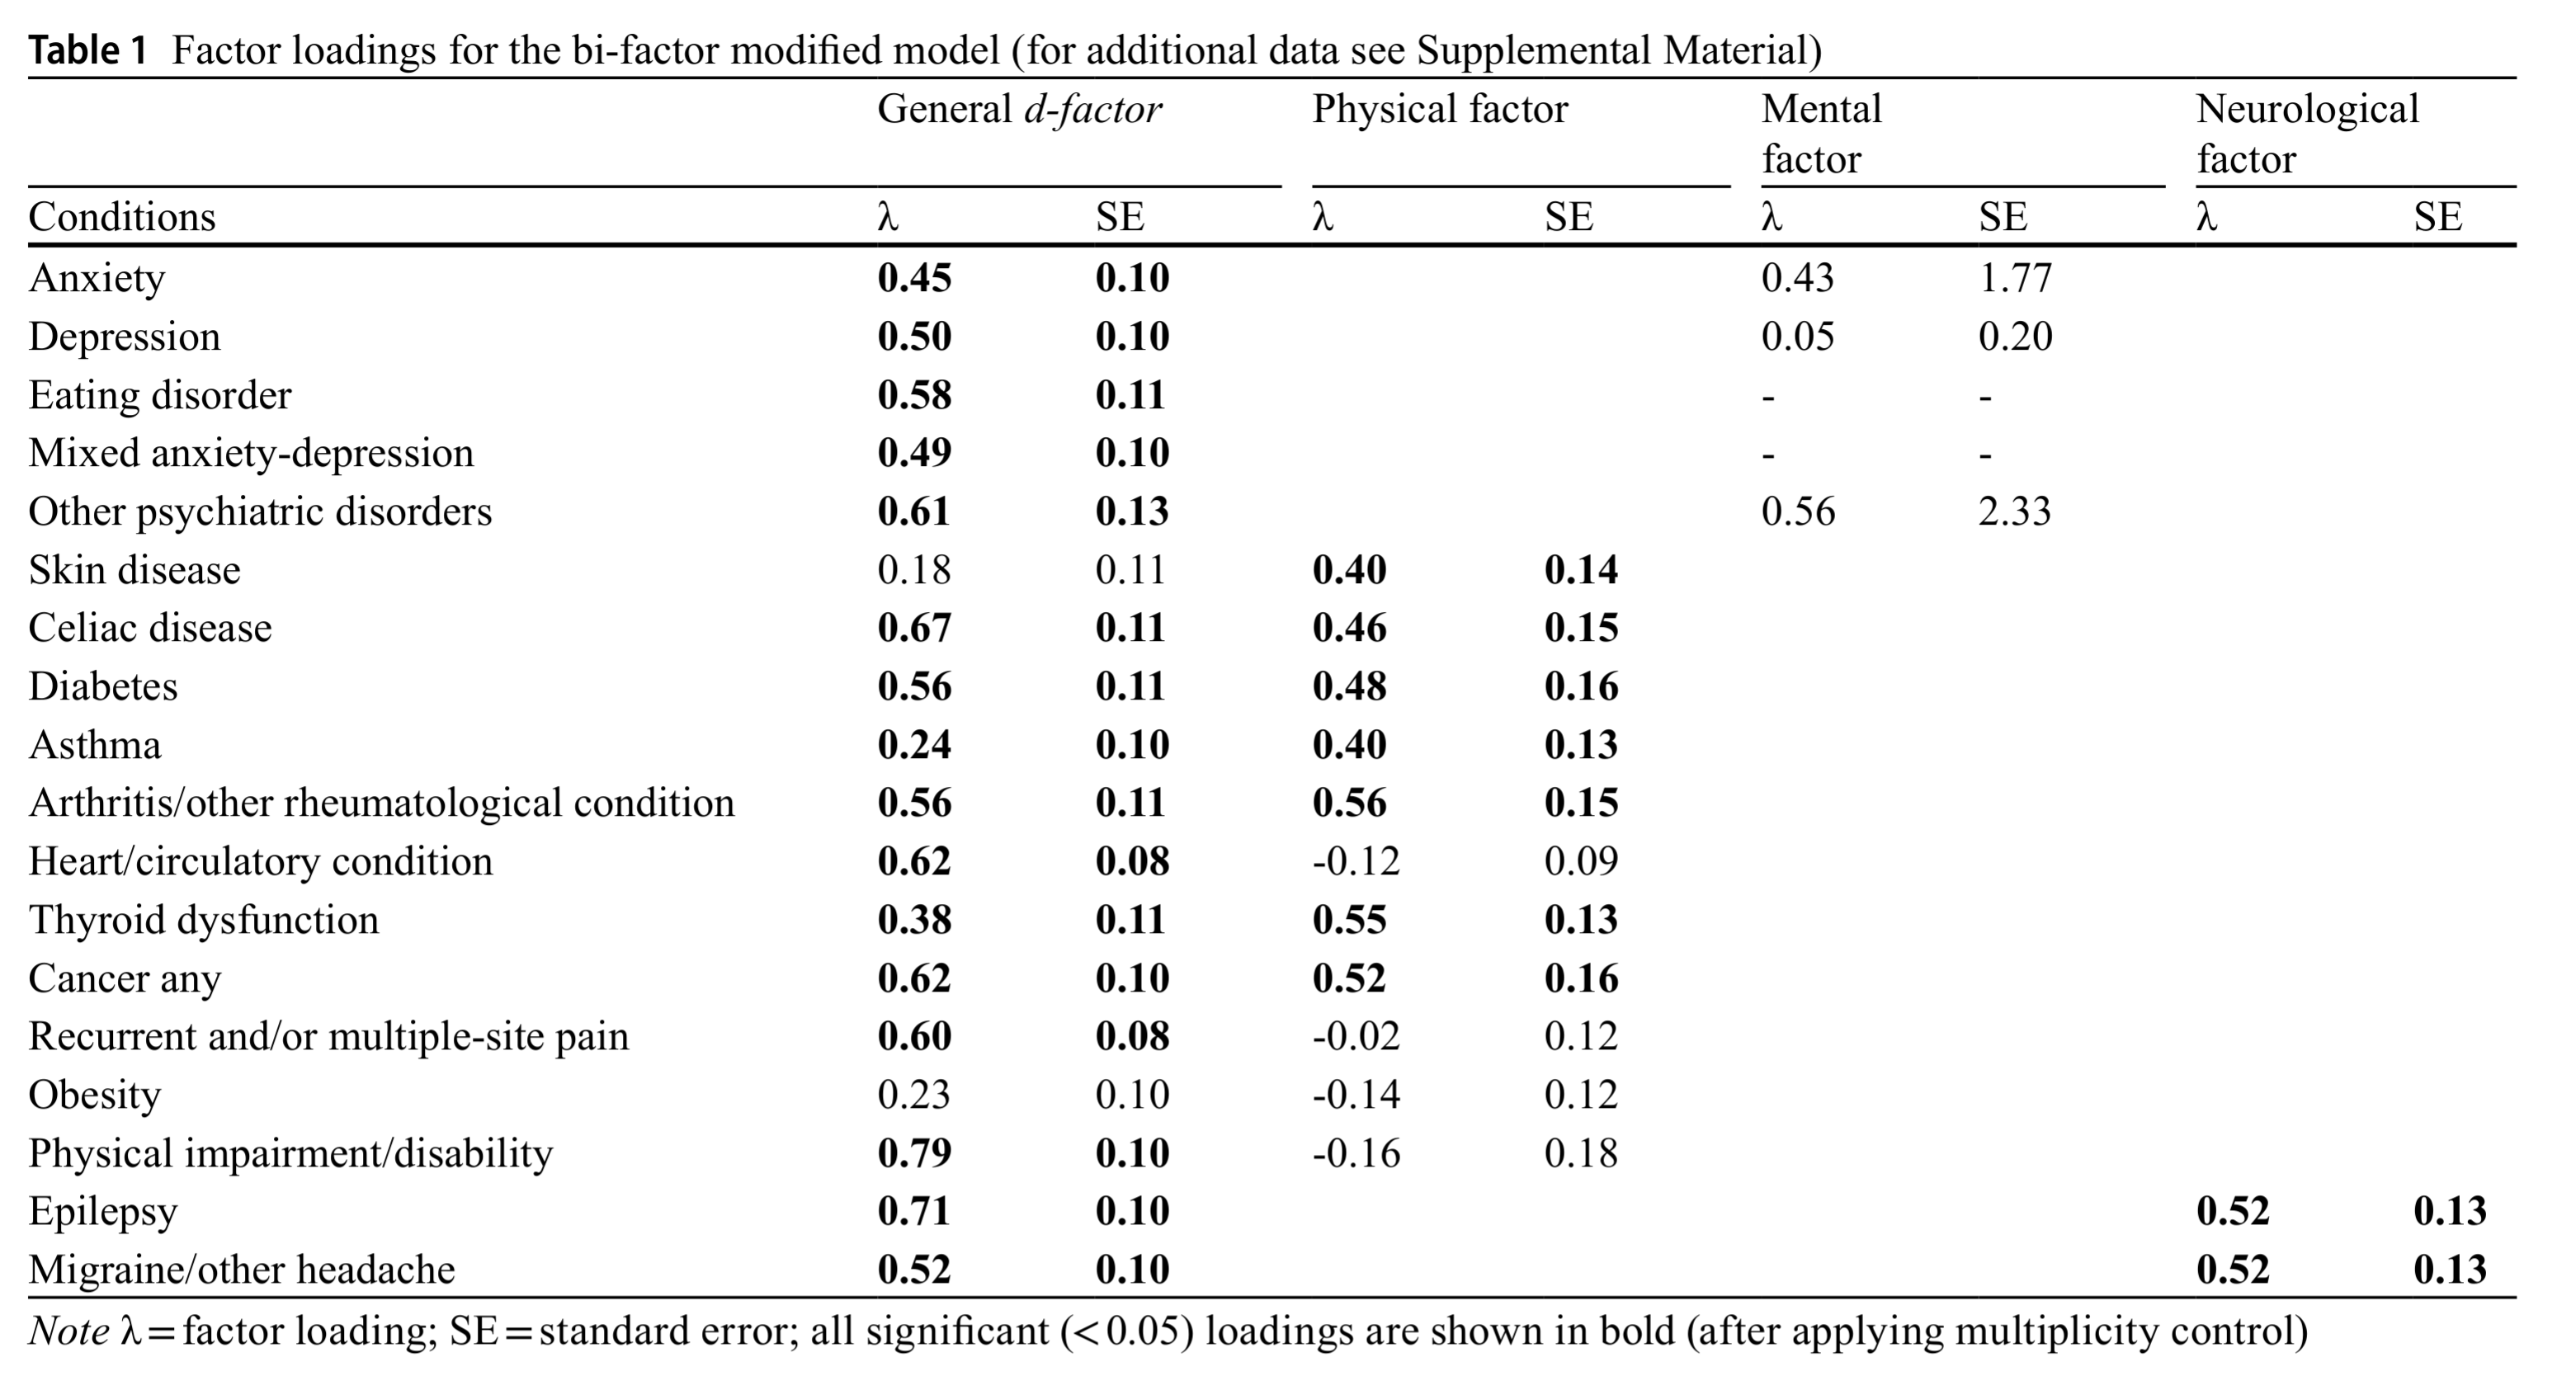
It shows the same general pattern, but also similar oddities. Their mental factor (which should be roughly the p factor) fails to show positive loadings across all diagnoses. But then again, you see the standard errors, which are absurdly large. Clearly, this dataset was far too small for this model.