Jonathan Egeland has an excellent recent paper on the Flynn effect and its paradoxes:
- Egeland, J. (2022). The ups and downs of intelligence: The co-occurrence model and its associated research program. Intelligence, 92, 101643.
This paper discusses the co-occurrence model and its associated research program, and it argues that the model provides the best supported theory of secular changes in cognitive ability. The co-occurrence model offers a better solution to Cattell’s paradox (relative to the alternatives in the literature), and it is able to accommodate Flynn’s four major paradoxes also. A review of empirical work conducted in order to test the model’s predictions demonstrates that many populations in which selection favors lower intelligence have experienced a decline in g or some cognitive ability variable that correlates with g, at the same time that average phenotypic IQ has increased. Moreover, since the co-occurrence model makes predictions about variables that are not directly concerned with cognitive ability testing, its research program can be extended to other domains of research.
The paper describes the history of the findings, and the questions raised. Briefly, the naive interpretation of increasing IQ scores across cohorts is that intelligence is going up. However, if we think about the numbers, it would mean that people around 1900 would be around 70 on some tests, and thus would be considered educationally retarded or some such. This is hard to believe. Furthermore, rates of innovation, scientific geniuses and so on have been declining over the same period, not exploding as one would expect if the raise was genuine. Finally, we know that fertility correlates negatively with intelligence and has done so approximately since 1850-1900 depending on country. We also know that polygenic scores for intelligence and education confirm this genetic decline. Putting all of this together, we get the plausible conclusion that the IQ scores cannot be validly compared over time. This idea was then tested in a number of studies and found to be correct (measurement invariance was violated). A productive research program.
Here I want to provide the reader with an illustration of how the numbers might look. I’ve simulated data such that:
- There are 9 tests in a battery. They vary in g-loadings, and each test has a secondary loading on one of three group factors, in a bifactor model.
- Each test has a certain rate of its Flynn effect, and this is not correlated with the g-loadings.
- There are 5 generations of 1000 people, which would span about 30 * 5 = 150 years, roughly the time since dysgenics began in NW Europe and now (2020 – 1870).
- Real intelligence (g) declines by 3 IQ per generation, or 1 IQ per decade. This is about the estimate one gets from correcting the polygenic score results. The group factor scores don’t change over time.
Here are the test parameters I used:

The columns with “_obs” are the loadings observed in the simulation results. “flynn” is the rate of gain from the mysterious effect, and “flynn_effect” is the observed change between first and last generation for the simulated data.
I’ve fiddled with the numbers to get results that look like reality. Here’s the observed scores over time for the 9 tests:
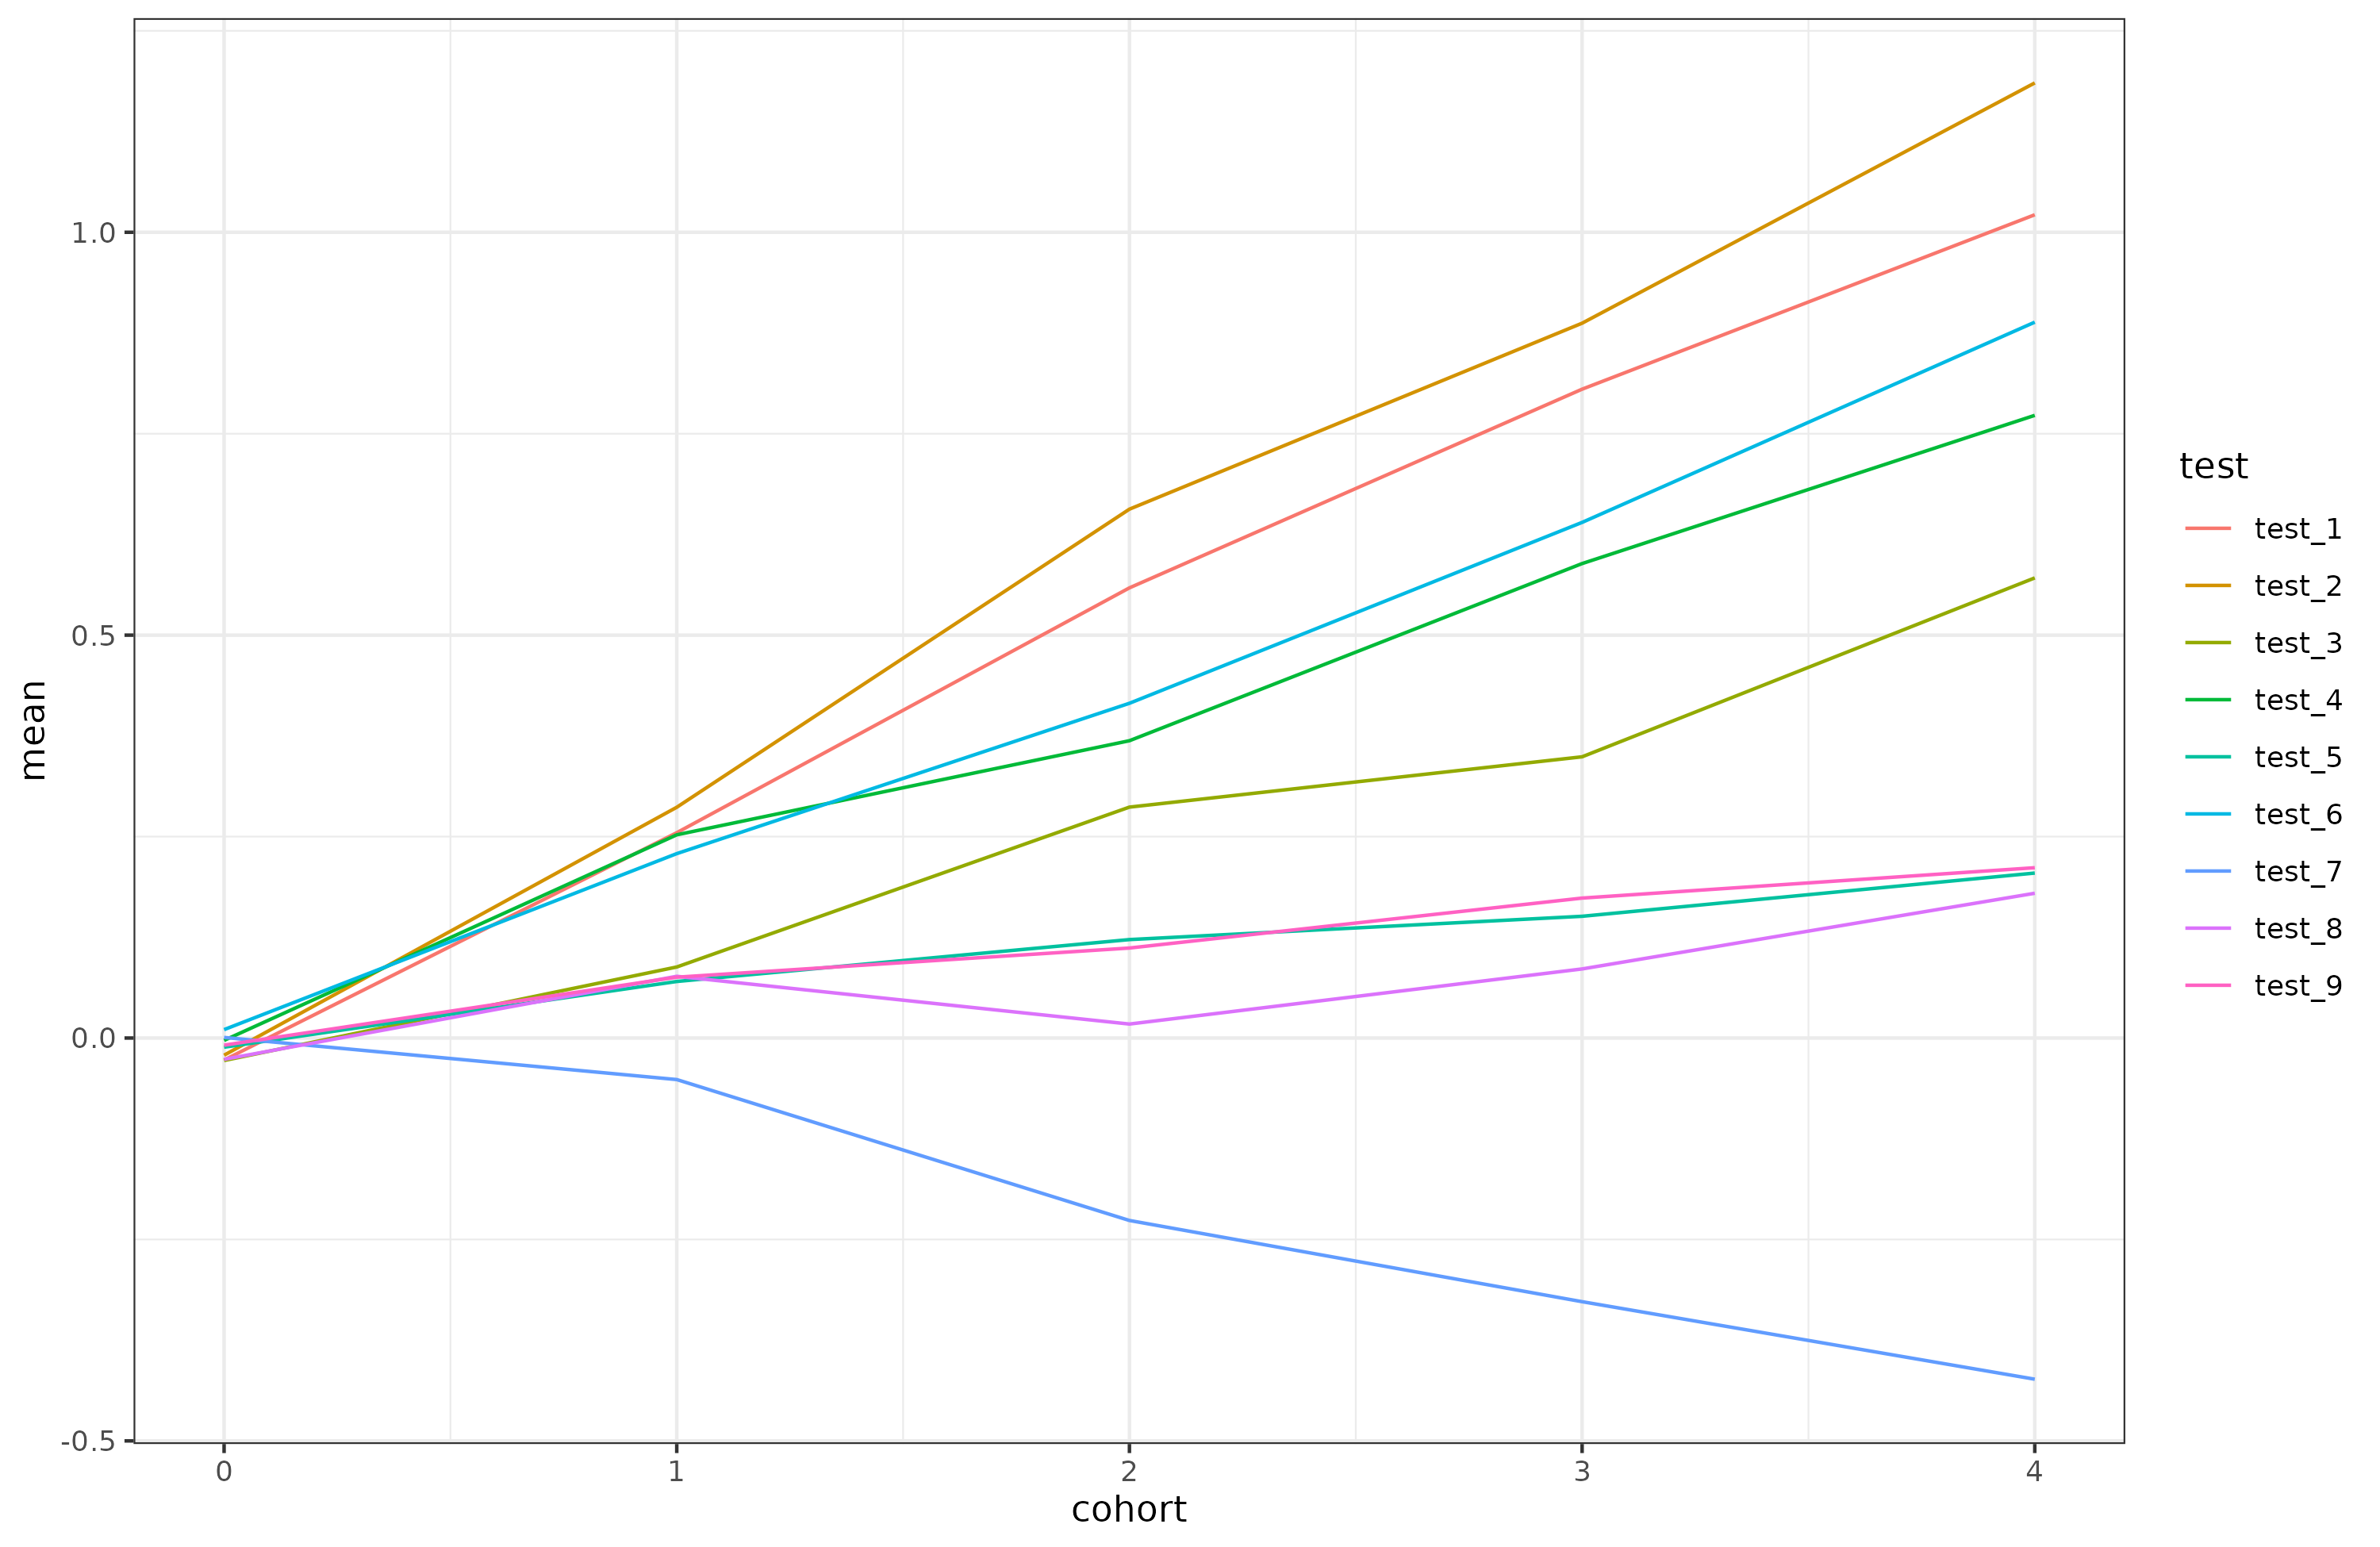
Of the 9 tests, 8 show an increase and one shows a decline. As such, there is also an IQ gain over time:
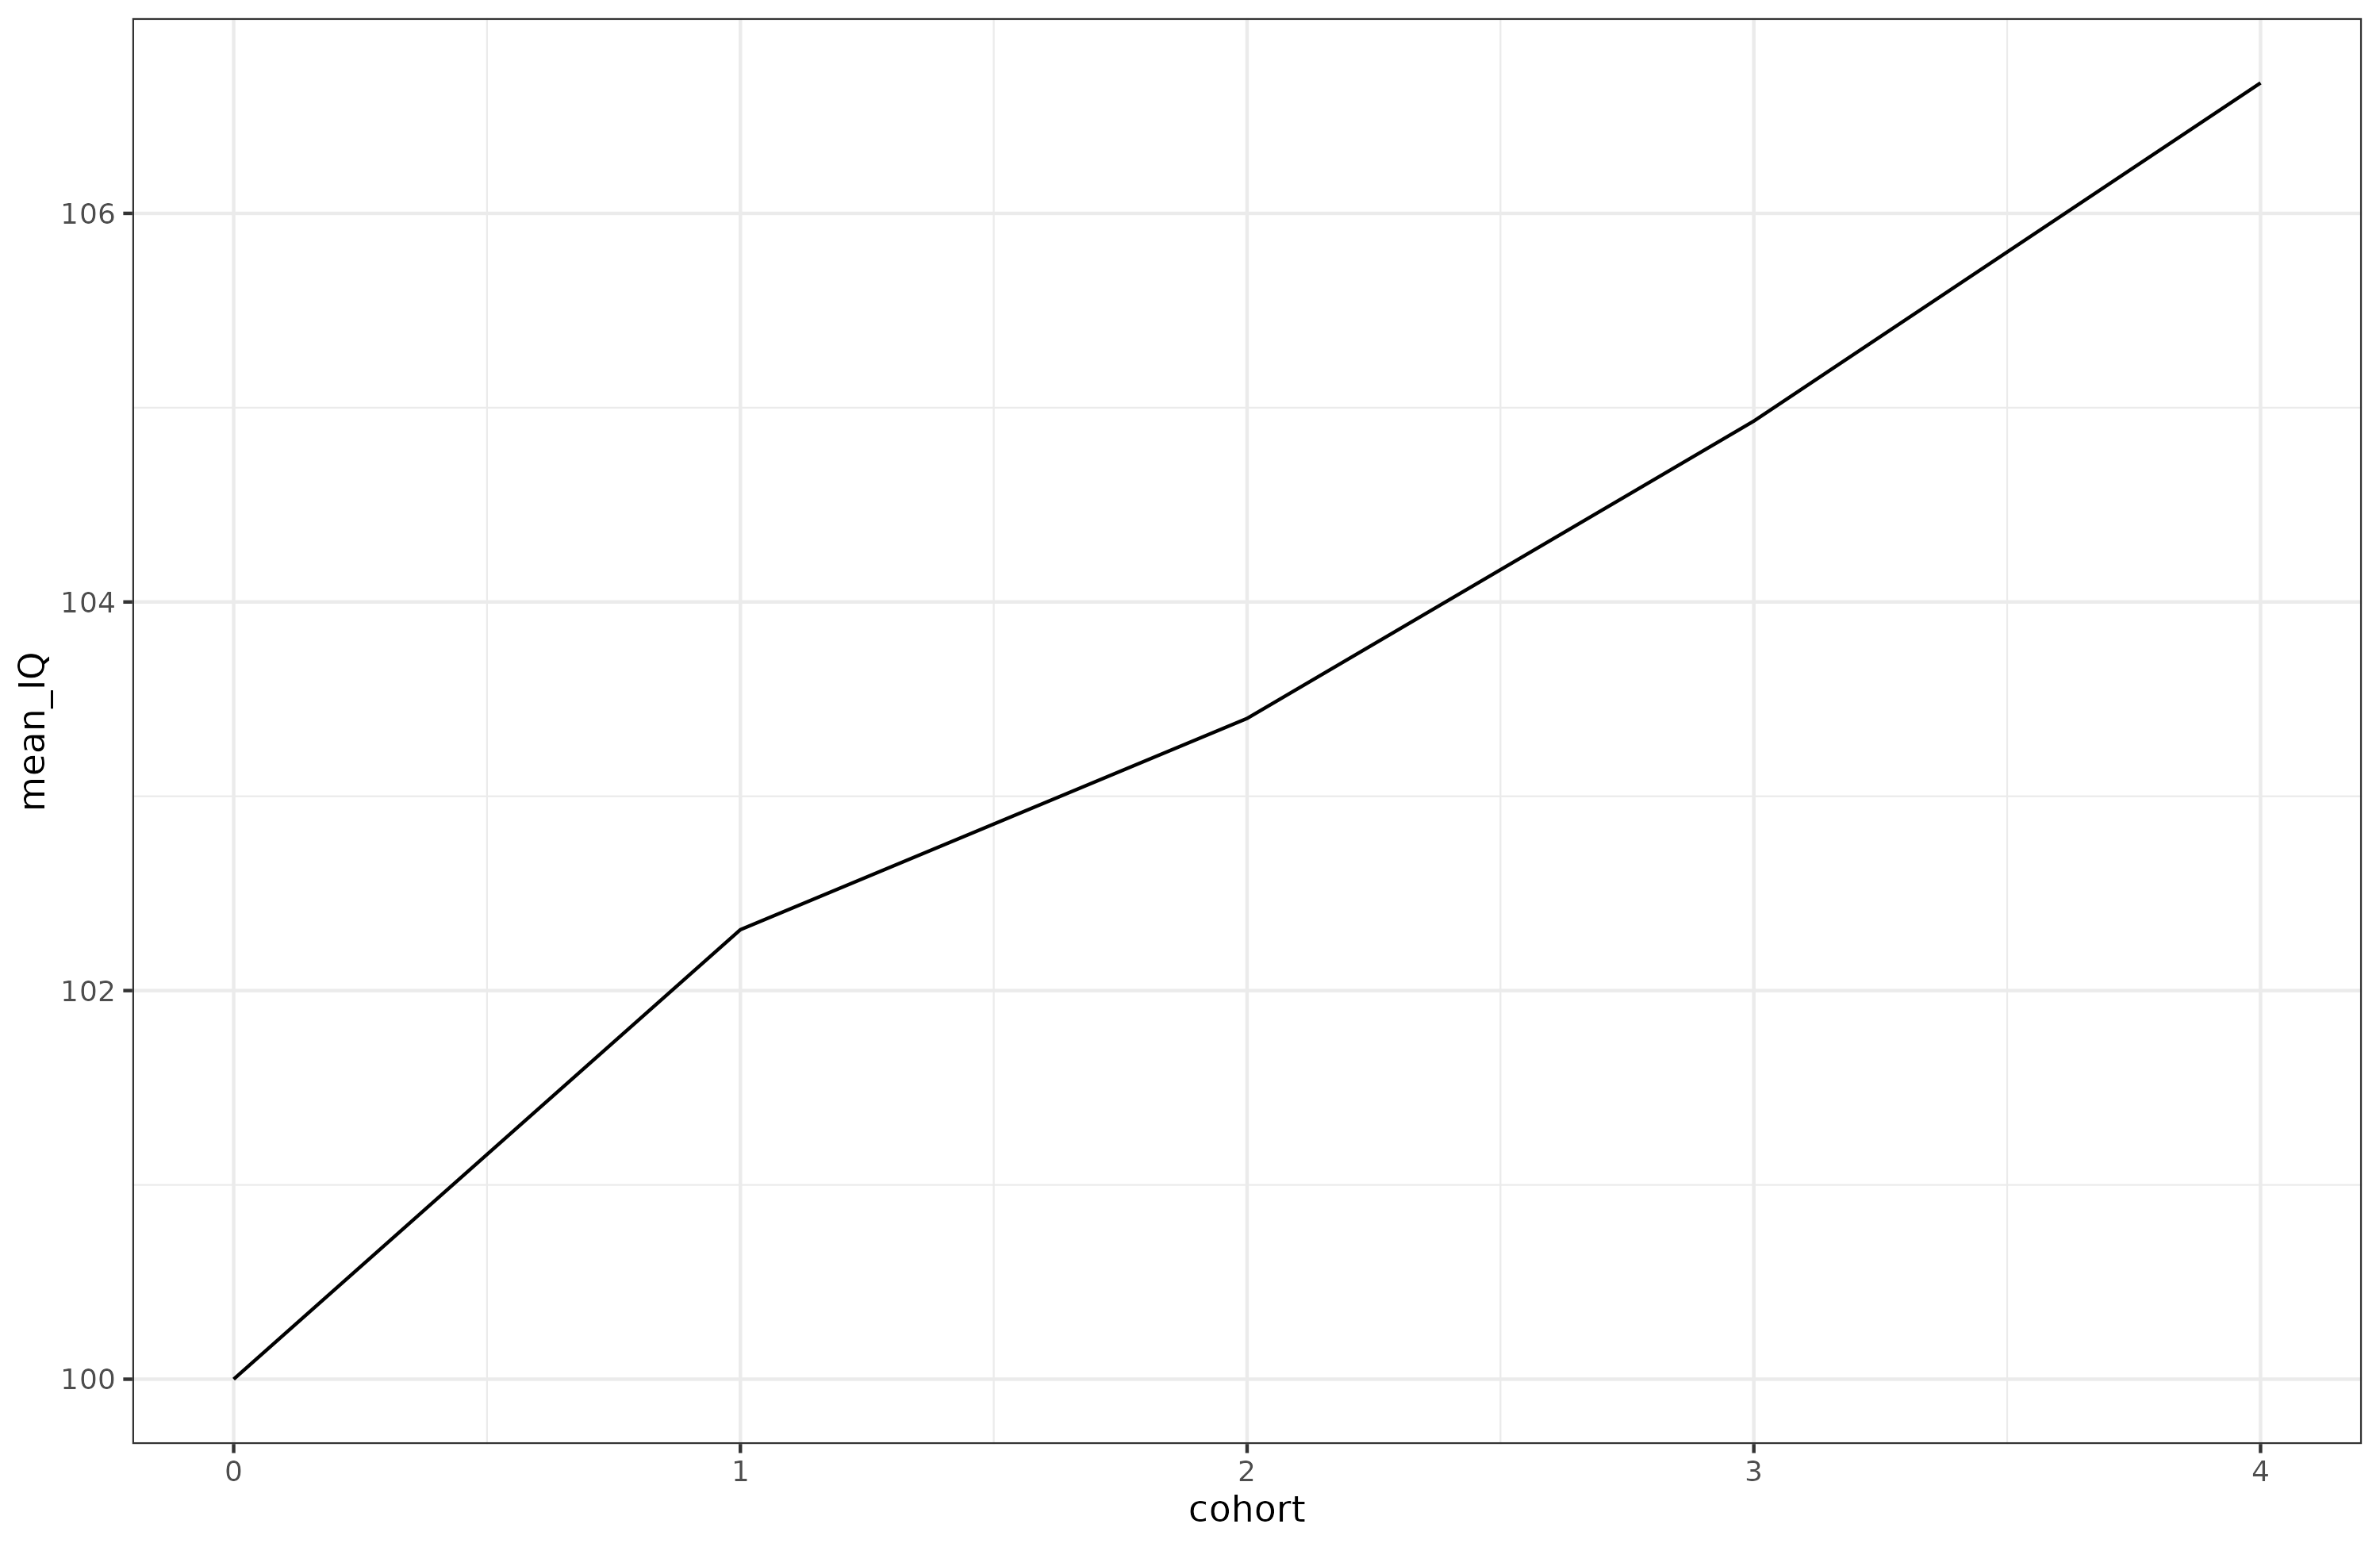
Across the 5 cohorts, 7 IQ points were gained. (Curiously, the SD of IQ also shrank over time as do real results. I didn’t intend for this to happen, and the SDs of the tests are the same over time, so I don’t see why this happens. There are no ceiling effects.). The gain is smaller than typical real life results because this battery includes a broad selection of tests, some with only poor g-loadings and 1 test with a negative Flynn effect (sometimes called anti-Flynn effect). A typical battery like WAIS doesn’t have any tests with a negative Flynn effect, and neither does it have a test with a g-loading of only 0.2. Speaking of, applying Jensen’s method (‘of correlated vectors’), there is a negative correlation between the tests’ observed g-loading and Flynn effect:
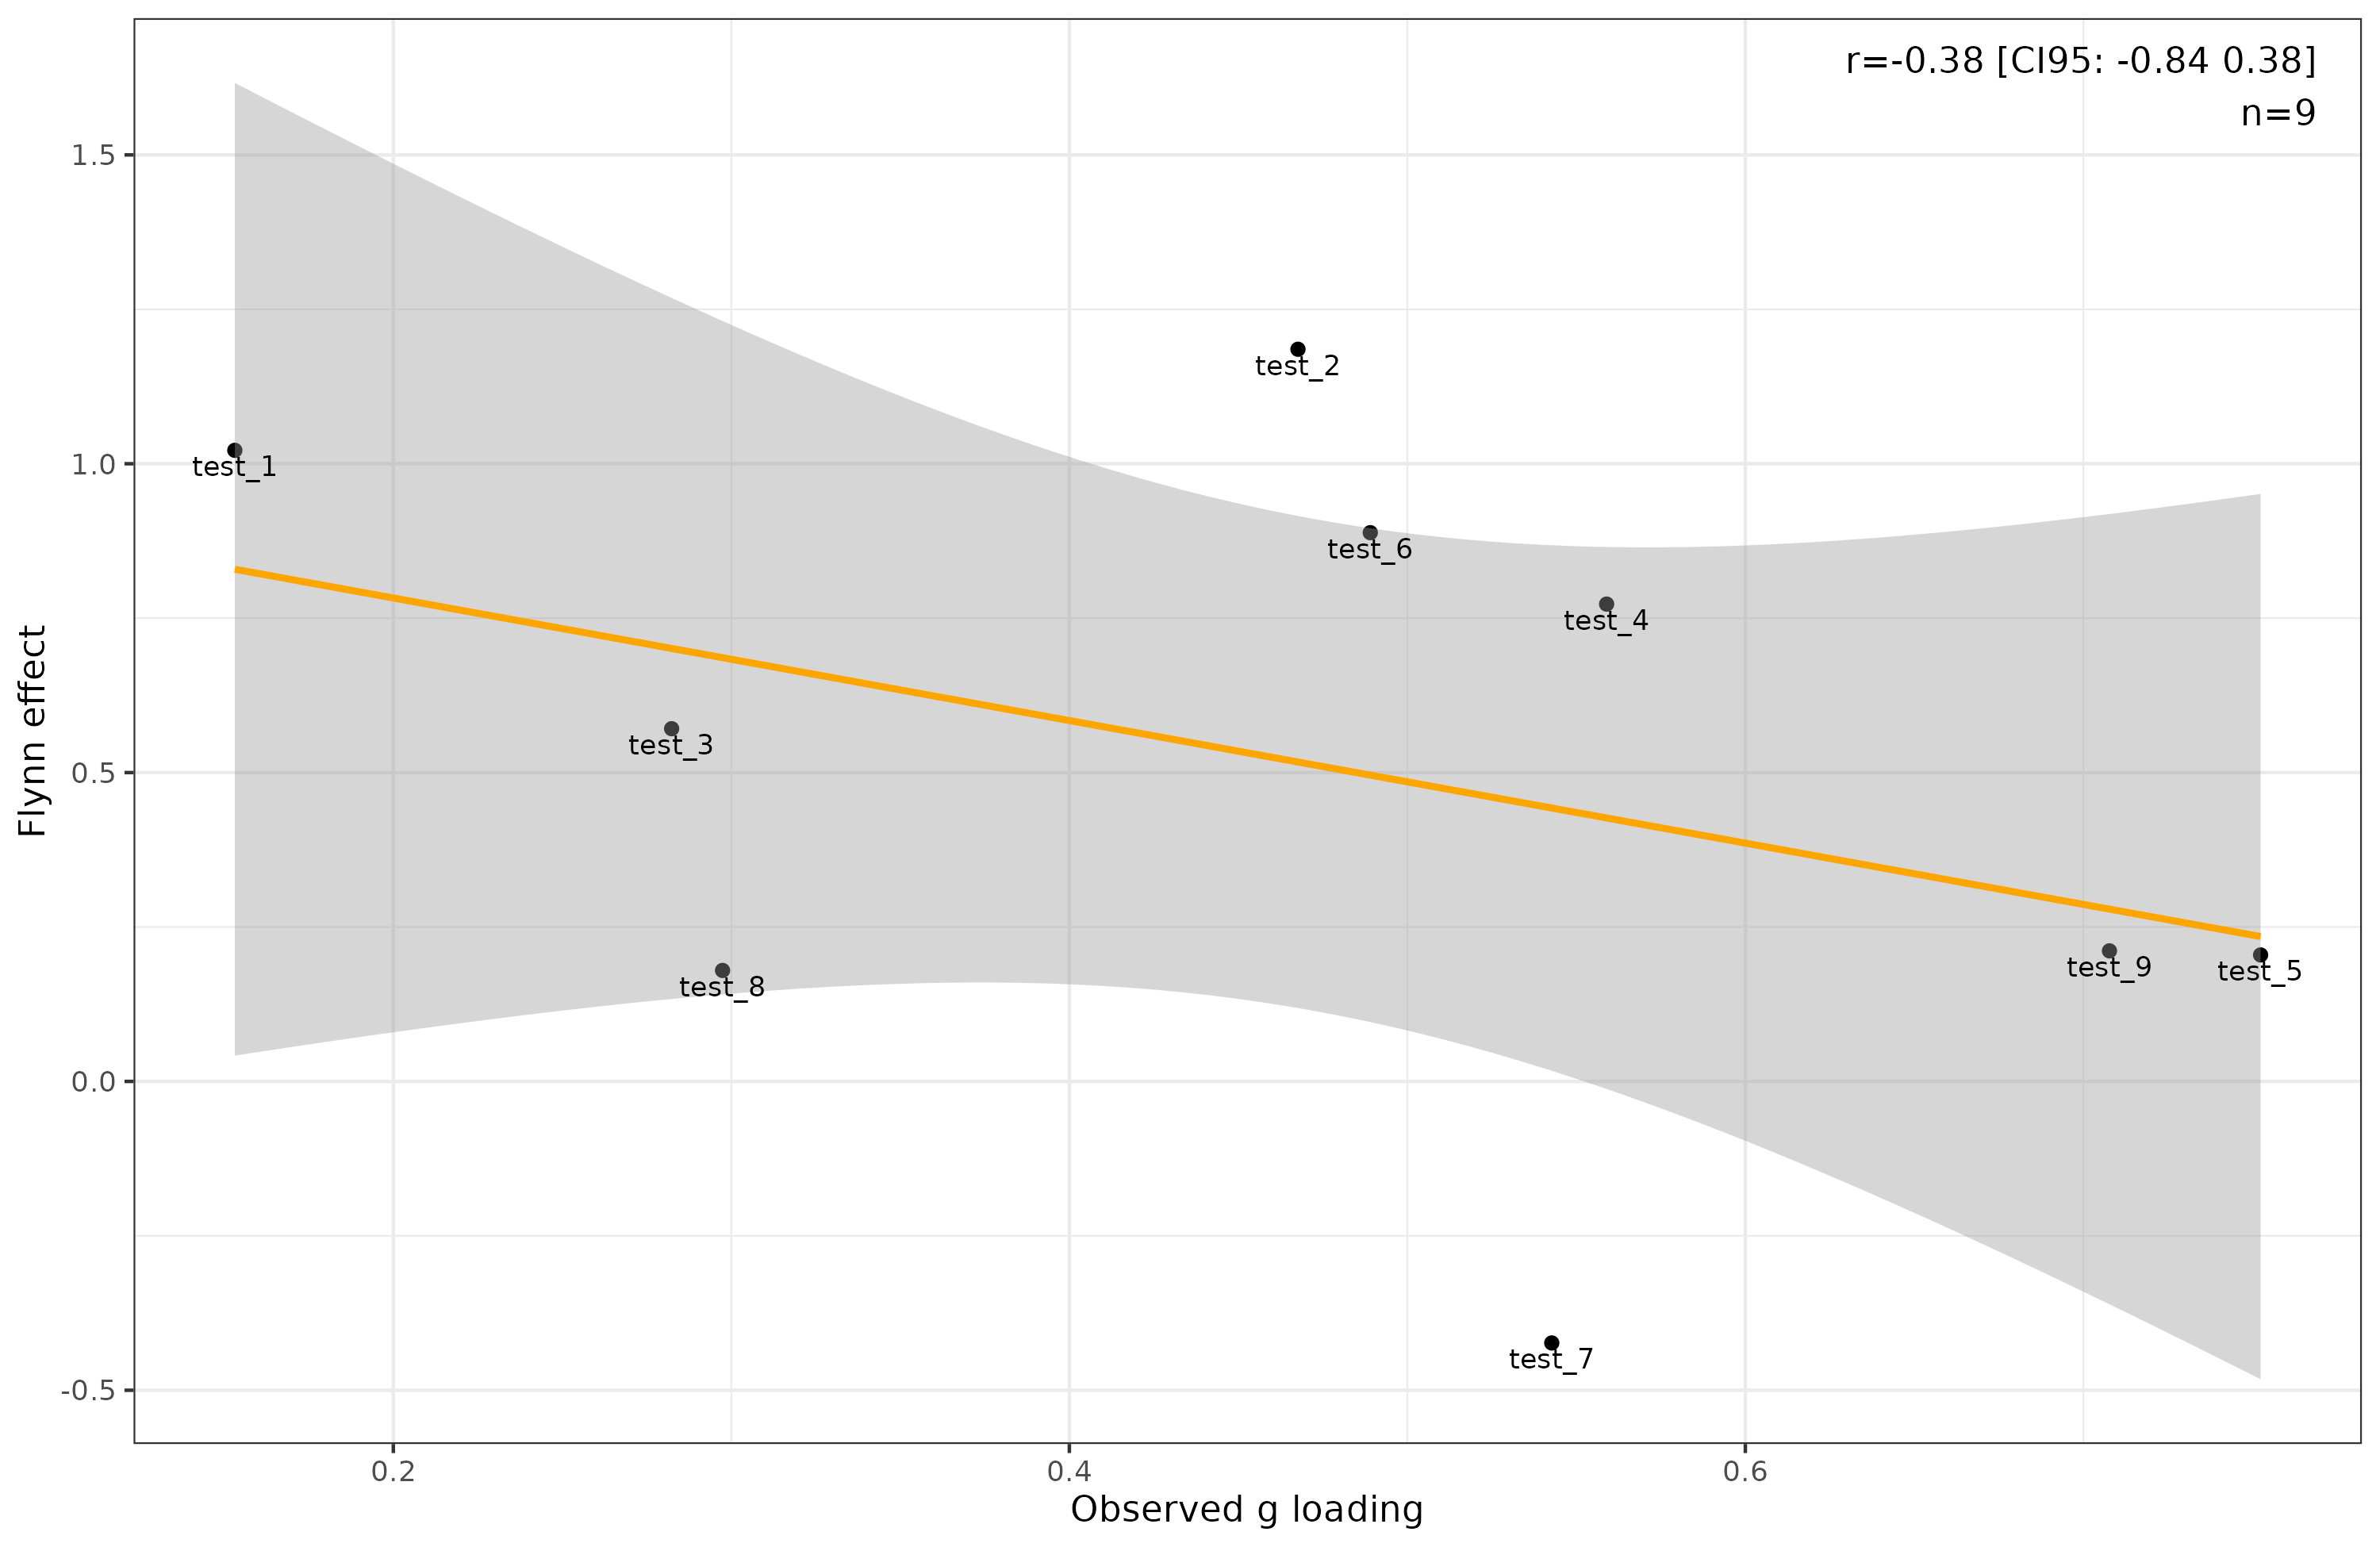
This negative correlation is not real. If one uses the model’s true g-loadings, it is -0.07 (remember, n = 9 tests). However, the fact that despite ample statistical precision, there is a lack of correlation between the rate of gains and g-loadings makes it likely that the increase in IQ scores does not reflect an increase in g. As a matter of fact, in the data, g declined by 0.8 d (12 IQ) over the period, but this is masked by the mysterious causes of the Flynn effect.
Of course, Jensen’s method is a poor man’s MGCFA/DIF, so I applied MGCFA as well (multi-group confirmatory factor analysis). MGCFA models the data for 2 groups and checks whether the data are consistent with the specified model. Specifically, when we have two groups, the model will explain the differences in the observed test scores as a function of the 4 latent variables, these being g, and group factors 1-3. One then adds restrictions to the model in step-wise fashion to see if the same model can explain both datasets. Doing so, we find that configural and metric invariance hold. That means the cohorts have the same factor loadings (slopes). However, scalar invariance is strongly violated (CFI 0.999 to 0.989, rmsea 0.010 to 0.292, p < 0.001). This means that the intercepts are not equal. In other words, tests change their means over time and this cannot be explained by changes in the underlying 4 latent variables. This is the same as real life results.
With this conceptual and mathematical framework in mind, the paradoxical findings from before can now be made sense of: 1) Rates of innovation, genius etc. are declining because g is actually declining, but appears (or appeared) to be increasing. 2) Results now fit genetic results and studies of natural selection. One can complicate things further by letting g have genetic and environmental components, such that the environmental component shows a real increase and the genetic one shows a large decline since 1870. We don’t really know for sure about these things. The key question is: what determines the rate at which humans improved their performance on different mental tests over time? It’s hard to test theories because we only have datasets for a few batteries of tests (Wechsler, Stanford-Binet), and a few standalone tests (e.g. Raven, reaction time). Maybe in total we can estimate the change rate for 15 tests, many of which are similar. n = 15 tests is not much to base a theory on. As far as I know, no one really has any good theory. This question is what James Flynn spent his last years writing about. We cannot go back in time and administer more tests, but we can look at old studies with many different tests given to representative samples, and administer the same tests to modern samples (begin with Carroll’s 1993 book and dataset, Project Talent). This would allow us to estimate the rate of change for many more tests, hopefully some that are quite distinct from the current sample (Russell Warne tried this approach with the Army Beta). Using this approach, maybe we can finally make some progress with this question. In fact, it is strange that given all the writings about the Flynn effect, no one has pursued this rather obvious idea.

