Going back to Lyman Stone’s tweet:
in fact, national IQ’s predictiveness of GDP is often very weak within-region, i.e. within-ancestry-groups. measurement error is obviously a plausible part of this, but it also just tells us that whatever is happening with national IQs, they *might* explain why Europe and East Asia are rich and Africa isn’t, but they probably *won’t* explain why some East Asian countries are richer than others. they don’t much outperform just having categorical variables for major regions.
In my last post, I looked mainly at within country predictions of level of development from cognitive ability scores. Now these aren’t strictly speaking the same as within regions, or even within-ancestry-groups, which is what Lyman Stone was talking about. So let’s also do the worldwide regions to test his claim. Here I decided to use the premade Social Progress Index (not my composite variable from it, their own index). This is because Lyman Stone has concerns that I have been cheating with the construction of the composite index. In his words:
do you genuinely intend us to believe you did not engage in some kind of creative measurement to generate the finding that 2 SD of implied IQ generates exactly 2 SD of “socioeconomic development”?
how many different times did you respecify the model before you landed here
Alright, so here’s an index I definitely didn’t make. I didn’t even select the variables for inclusion (there are 51 variables). It was in fact made by some left-wing sociologists who made it because (according to their own promotion article in The Economist in 2013):
“GDP is simply too one-dimensional to provide a complete measure of a nation’s progress,” says Michael Green, who heads the Social Progress Imperative, a non-profit created to promote the new index. He mentions Nigeria and Ghana as examples. Nigeria has a higher GDP but has had slower social progress. Ghana, however, has a smaller GDP but ranks higher on the SPI. Moreover, says Mr Green, metrics improve accountability and create healthy competition. “They provoke action, the desire to be on top,” he argues.
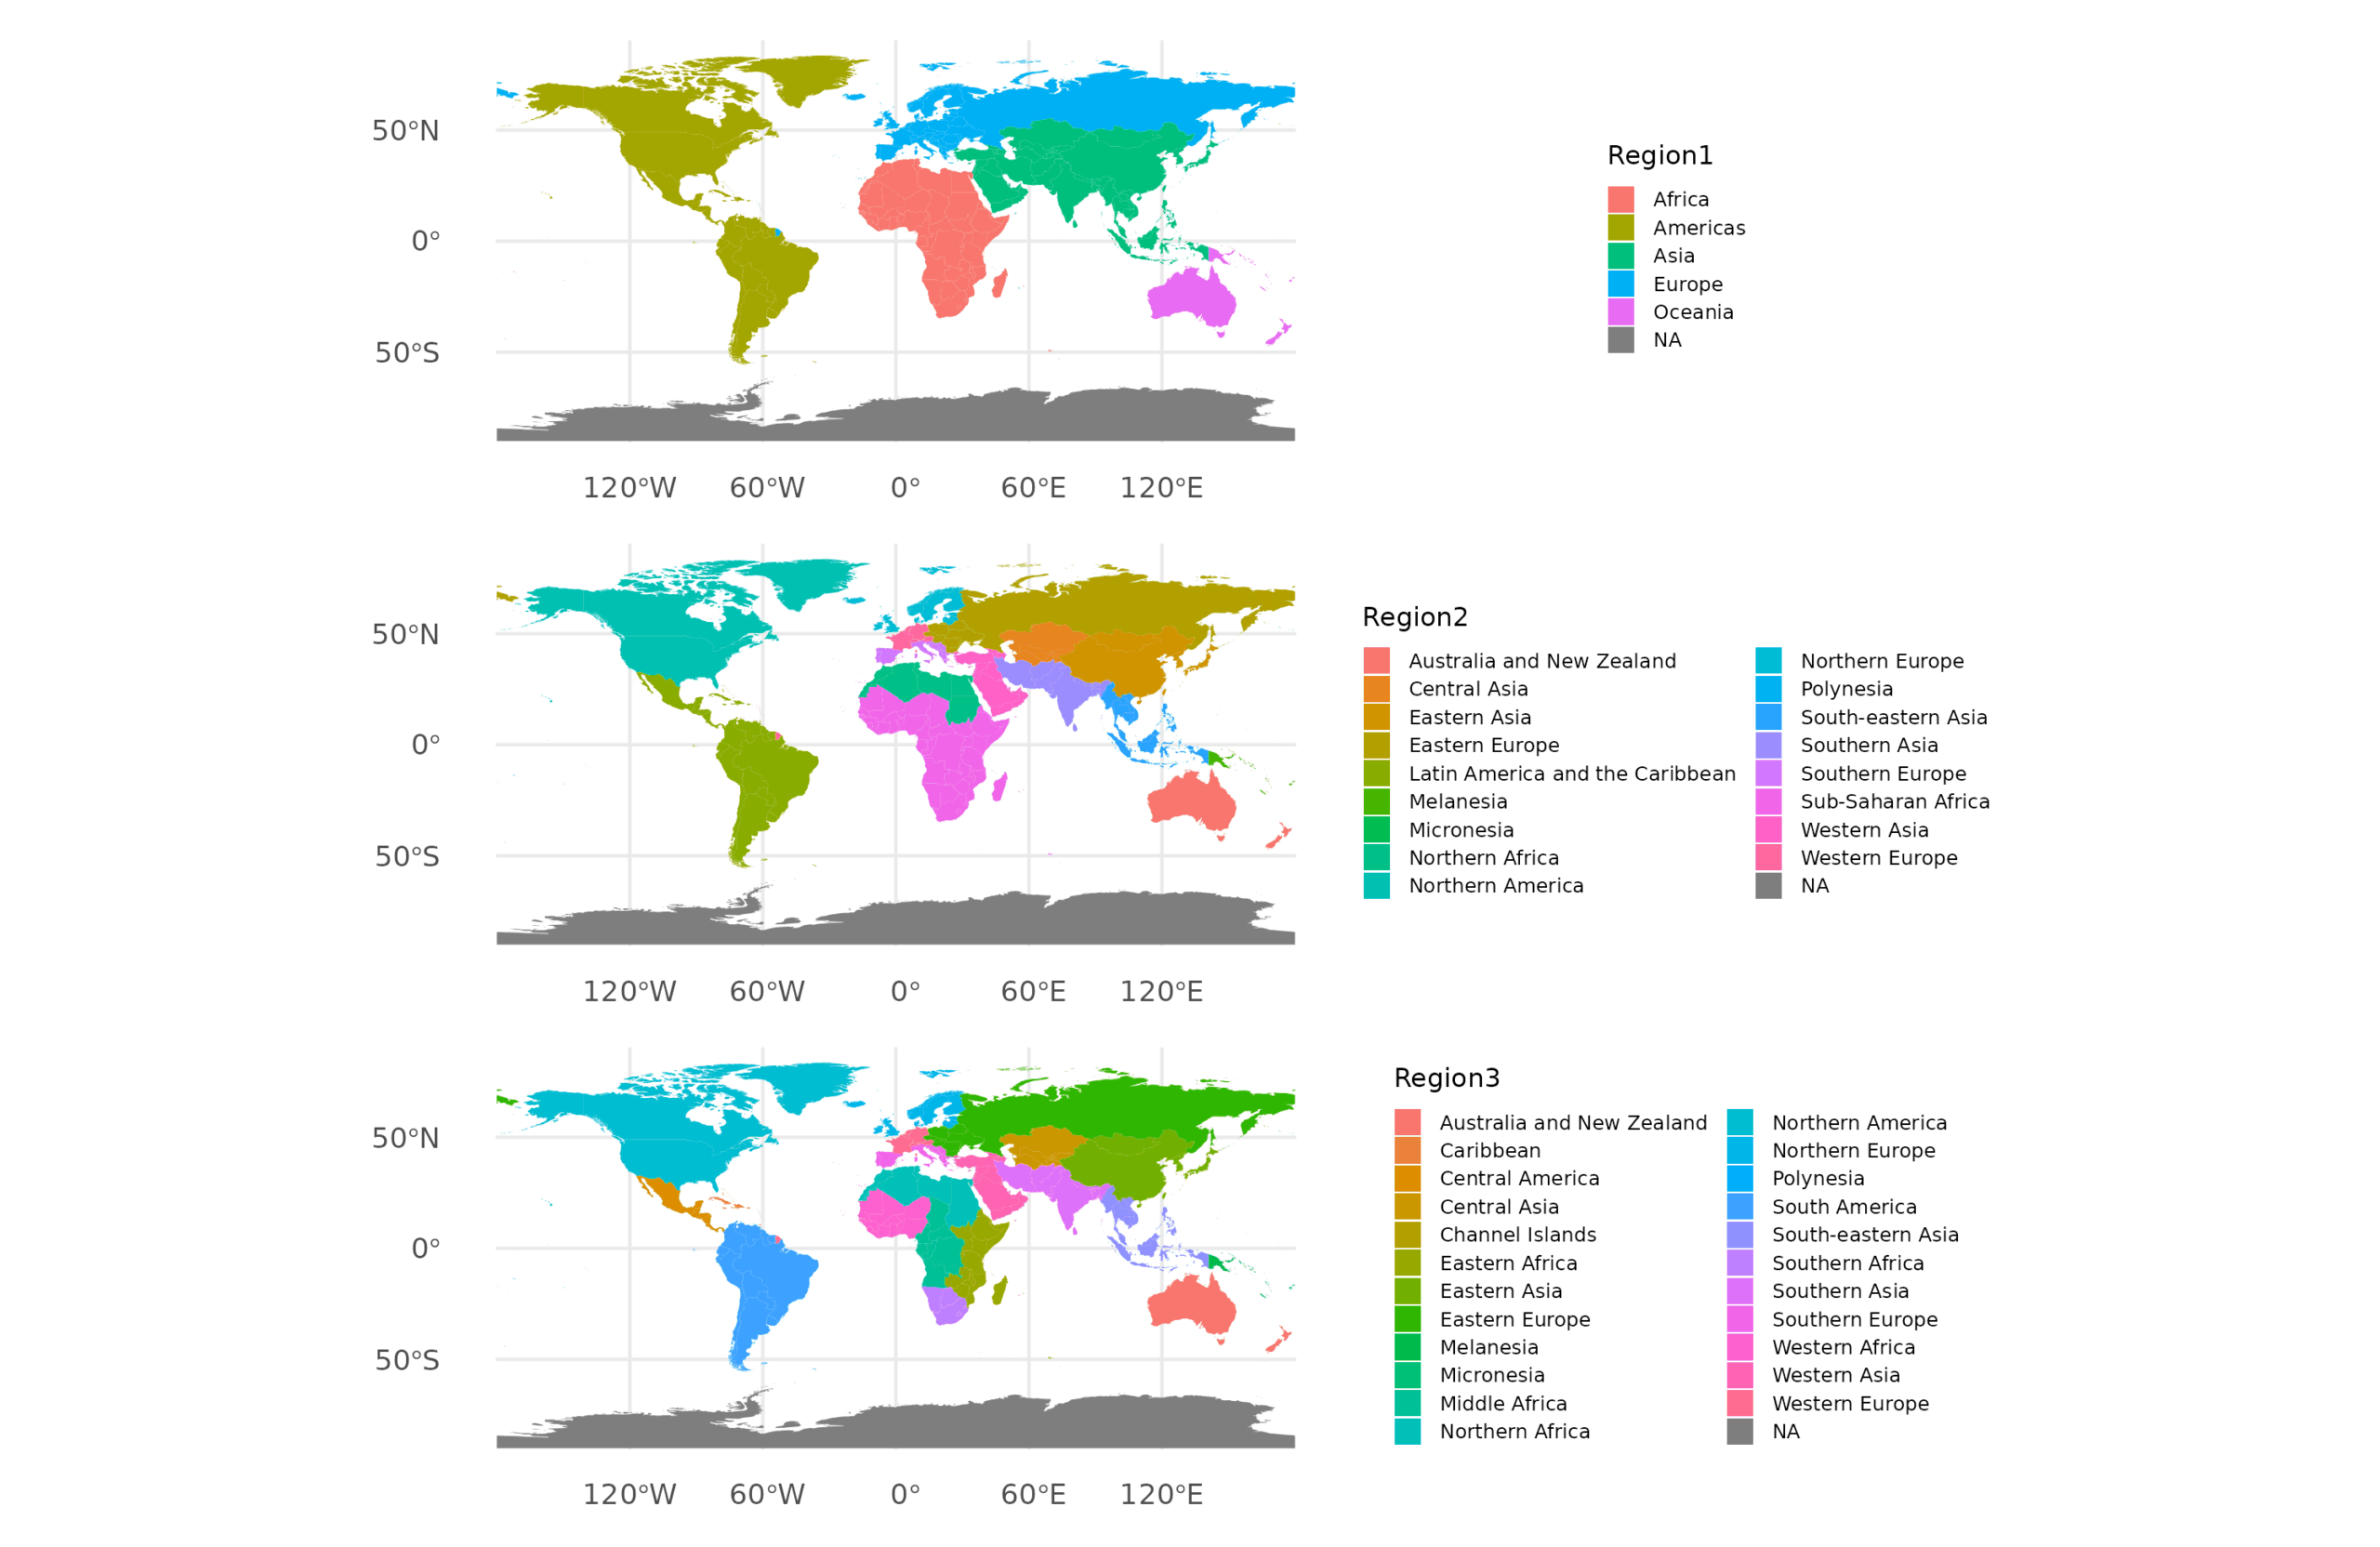
Anyway, so let’s predict the SPI from national IQs. As before, I will be using the Seb Jensen NIQs (our most recent compilation). For regions, I like the United Nations ones which I have put here. These look like this:
(As usual, the most time-consuming part of this post was merging the data since there’s a number of sort-of countries with varying ISO codes. In case you are curious, the offenders are South Sudan (SSD, not SDS), Western Sahara (ESH, not SAH), Palestine (PSE, not PSX), Åland (ALA, not ALD), and Kosovo (XKX, not KOS)).
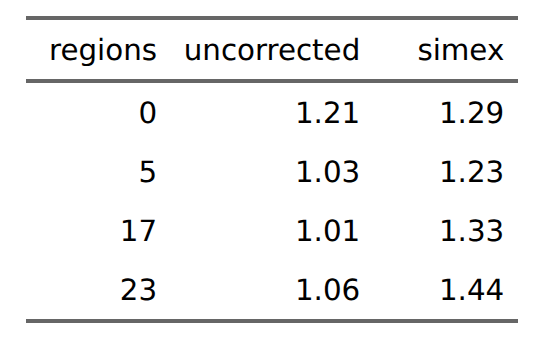
With that said, here’s the first set of models, OLS:
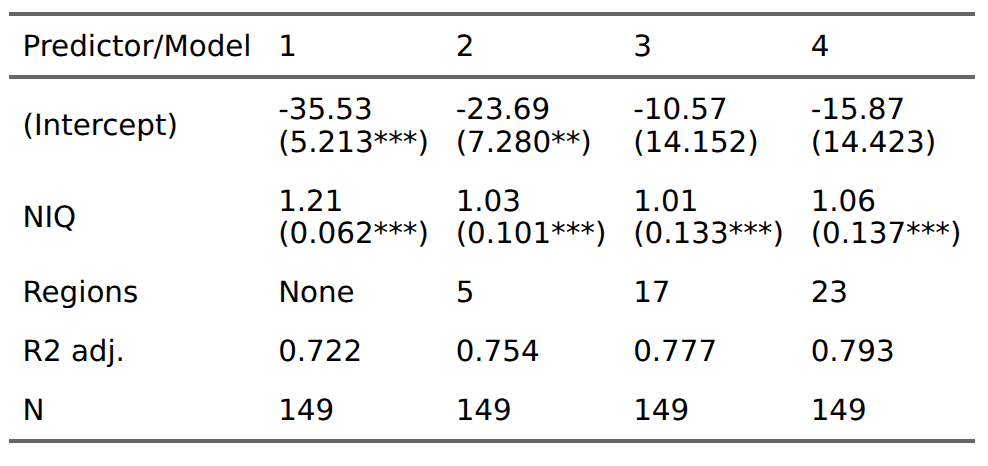
We see that 1 IQ (national) predicts a gain of 1.21 on the SPI. The SPI has a scale of 0-100, where 100 is perfect score. These values correspond to standardized betas of 0.85, 0.72, 0.71, and 0.74. As such, regional controls reduce the validity of the NIQs by about 15%. Not too shabby. Note that I didn’t use regression weights since otherwise maybe Lyman Stone will accuse me of cooking the regression weights too!
But these models just supply a dummy variable for each region and checks if the NIQs can predict variation beyond that. The slopes may be different by region. We can plot this to get an idea:
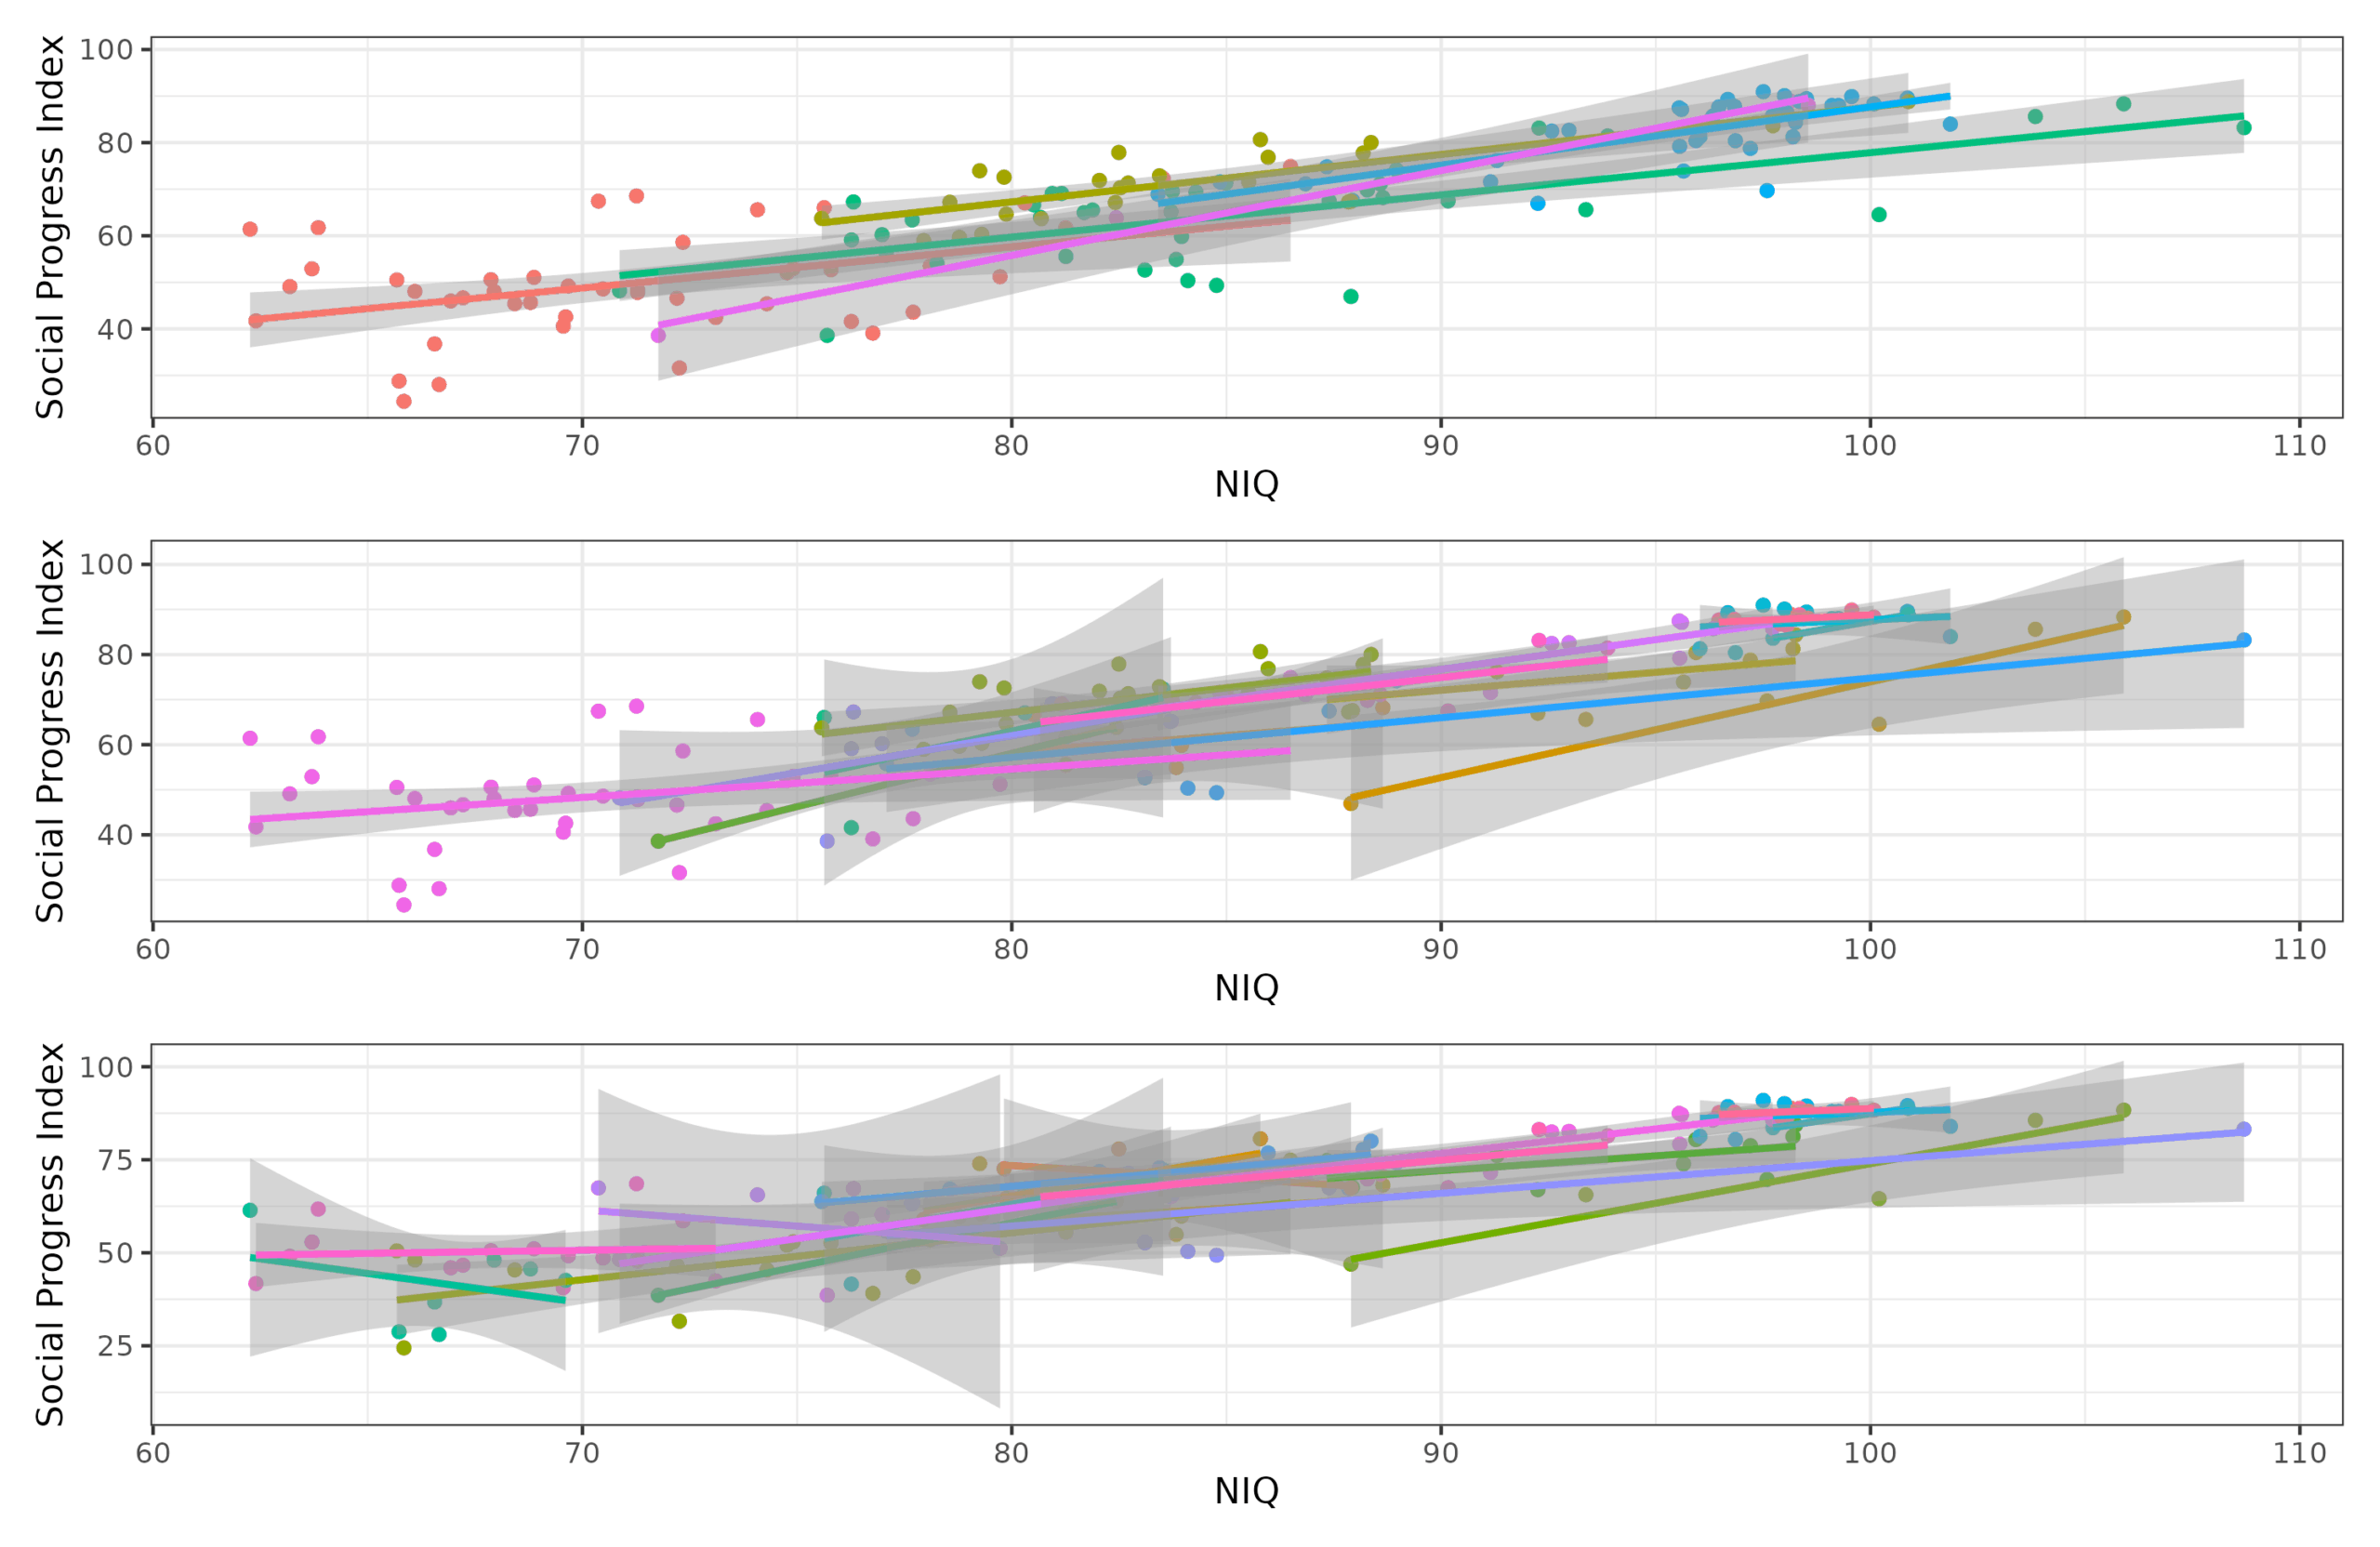
If you squint, you can find some slopes that are not possible or the same value. However, the confidence intervals are also wide, especially for the smaller regions which only have a few countries. There are two formal ways to examine this idea. The first and most strict is to fit proper fixed effect models (fixest package). These take the data by region, then remove the means of the variables, and then compute the slopes, and then average the results with appropriate weights. However, the values are the same as OLS in this case (they usually are, but if one has weird data, then maybe not). We can also try the random effects model from lmer package. This can in theory model the slopes as being different by region. Fitting the models, however, showed that they all fail to detect any slope differences beyond chance (all models were singular).
OK, so we fail to find any supportive evidence of Lyman Stone’s claim (yet again). In fact, the 15% decline in validity we saw earlier is partially due to measurement error in the NIQs (and presumably in the SPI itself). No one claims the national IQ estimates have no error (truly, no one knows for sure what the average IQ in South Sudan is, a country that has existed for 14 years), and our current dataset is no different in this regard. While we don’t know for sure what the errors are, we do have some estimates (estimated standard errors by country). We can plug these into the simex package to theoretically obtain error-free slopes:
Now the NIQs are more predictive instead of less predictive when we add regional controls. This pattern of results suggest that regional non-IQ differences are obscuring some of the validity of the NIQs, once measurement error is taken into account. This isn’t so surprising because these differences include the amount of capitalism, recent communism, cultural values, any psychological traits that differ by population other than intelligence, and so on.
Simex is a very cool method, which I want to explain a bit in detail since I almost never see anyone using it. The idea is that we can figure out plausible real (error-free) values of regression terms by adding more errors to them and then working our way backwards. Visually:
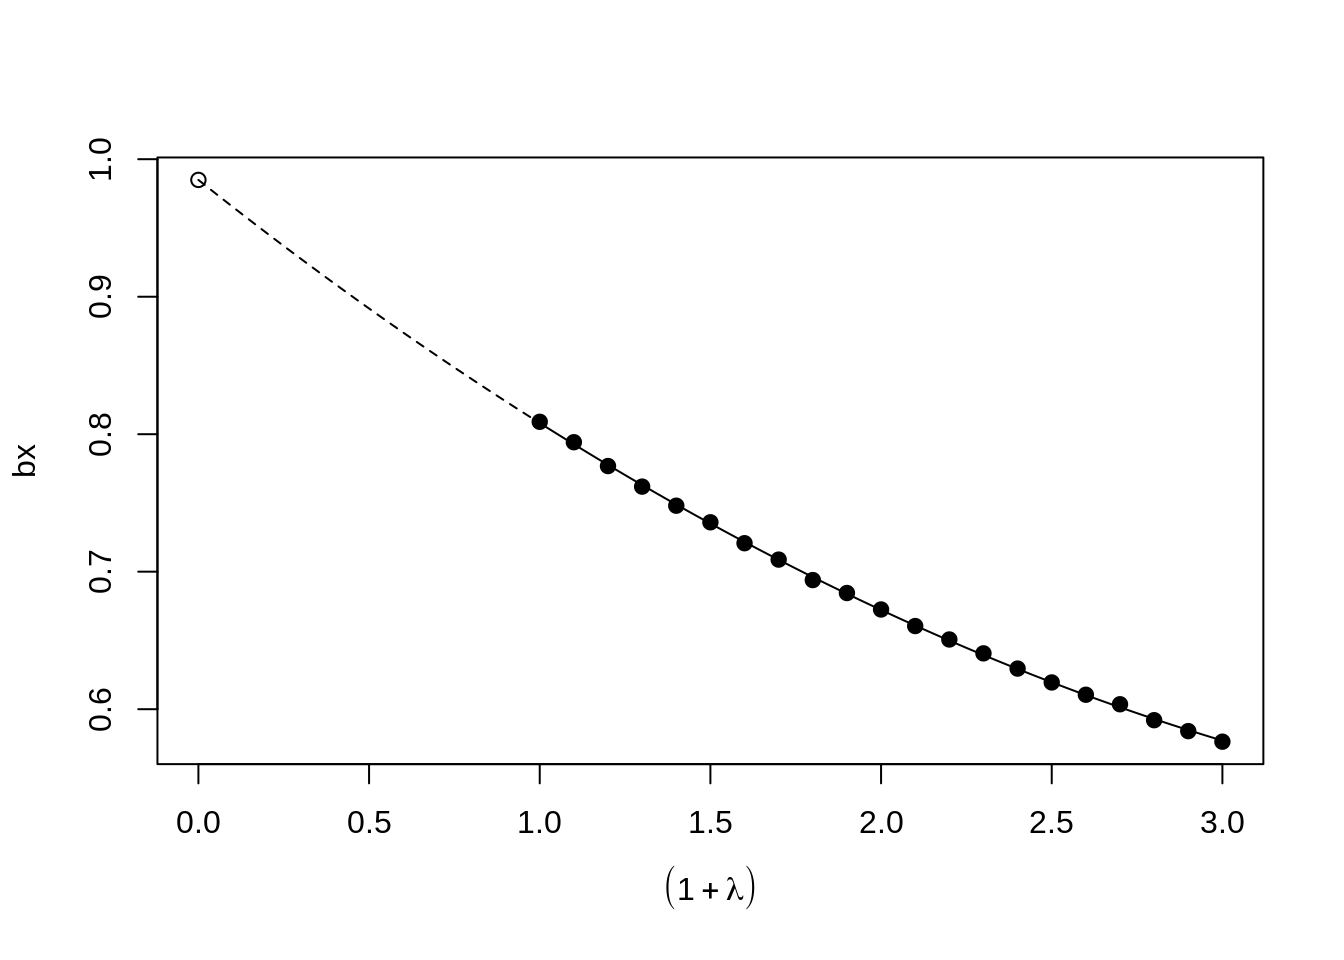
In this case, we assume for our observed regression results that given a standard error of 1.0 (average), the beta is about 0.8. If we add more random noise, we see the slope decreases towards 0.6. Using the values we see for increasing amount of errors, we can fit a model to project what the true beta should be if the error was 0, which in this case is about 1. These are in fact simulated data where the true beta is 1 (model simex estimated ). This method is entirely general and can be applied to regression models with any number of terms. Simex will then try to figure out the respective true slopes by adding varying amounts of noise to each predictor with some assumed measurement error. This is also why it is called the “simulation and extrapolation method”. In general, simex isn’t perfect. Here’s some results from my simulation:
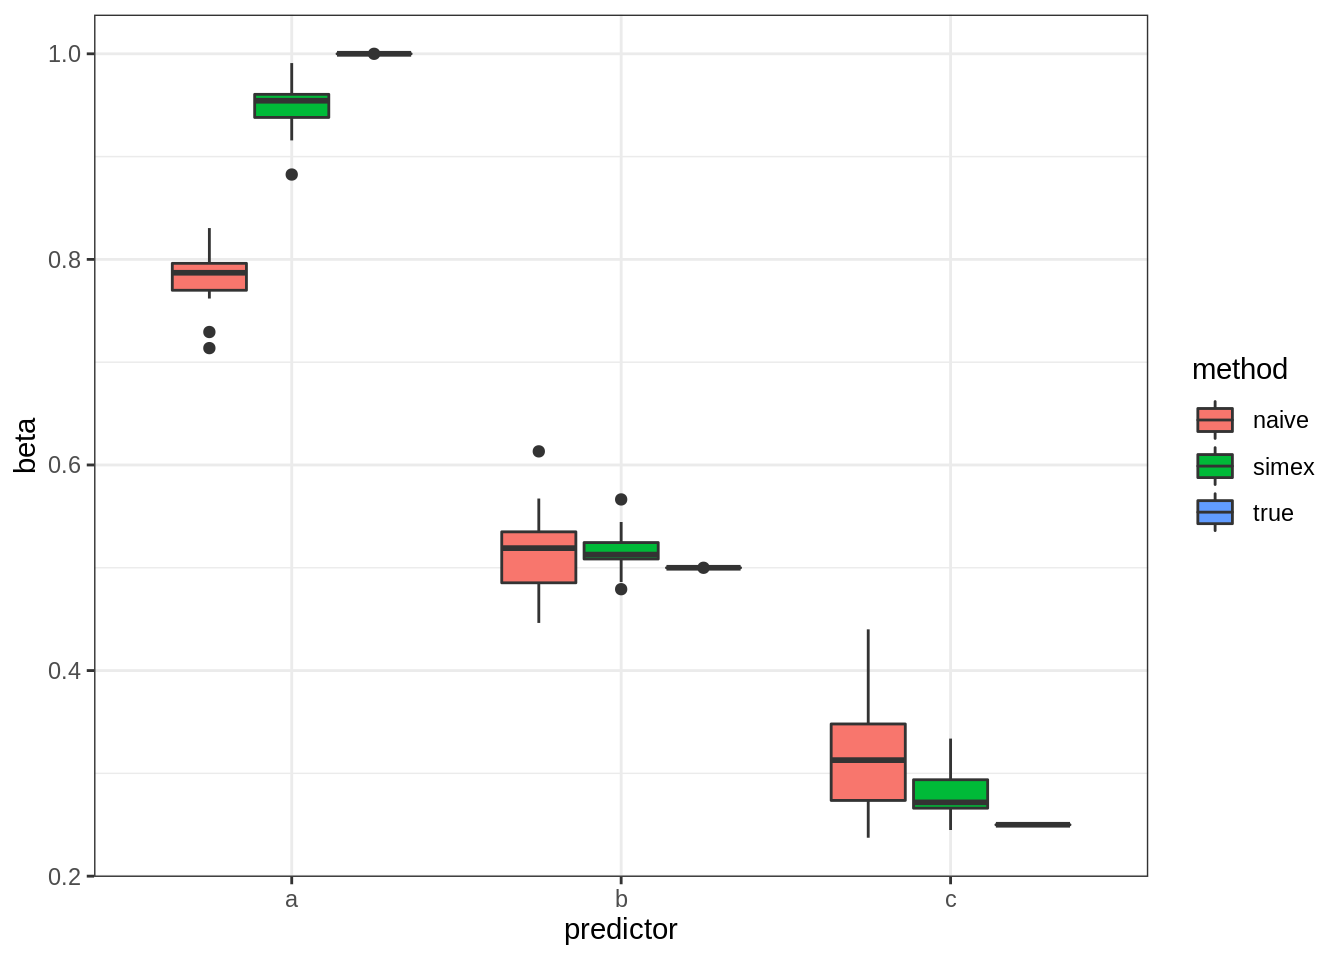
These are the 3 parameters from a regression model across simulations. Simex gets closer to the true values, though it is undercorrecting for A and C, while it slightly overestimates B.